The Dependence of the CZK Exchange Rate on the Development of the GDP in the Czech Republic in the Conditions of an Expected Crisis
←
→
Page content transcription
If your browser does not render page correctly, please read the page content below
SHS Web of Conferences 9 2, 08013 (2021)                                    https://doi.org/10.1051/shsconf/20219208013
Globalization and its Socio-Economic Consequences 2020

         The Dependence of the CZK Exchange Rate on
         the Development of the GDP in the Czech
         Republic in the Conditions of an Expected Crisis
         Veronika Machová1,*, and Tomáš Krulický2
         1 Institute of Technology and Business in Ceske Budejovice, School of Expertness and Valuation,
         Okruzni 517/10, 370 01 Ceske Budejovice, Czech Republic
         2 University of Zilina, Faculty of Operation and Economics of Transport and Communications,

         Department of Economics, Univerzitna 1, 010 26 Zilina, Slovakia

                       Abstract.

                       Research background: In the past, some studies proved that the
                       development of a currency exchange rate predicts the development of the
                       whole national economy. The monetary market overtakes the development
                       of the actual economy for a few months. Does this apply also in the case of
                       the Czech koruna, in the era of the global Coronavirus pandemics and in the
                       world affected by the pandemics?
                       Purpose of the article: The main objective is to analyze a dependence of
                       the Czech koruna (CZK) to Euro (EUR) exchange rate development on gross
                       domestic product of the Czech Republic in the conditions of an expected
                       crisis.
                       Methods: The data used of the analysis are represented by the information
                       about the CZK and EUR exchange rate from the beginning of 1999 to the
                       15th June 2020 and by the quarterly development of the Czech GDP. To
                       measure the dependence and predict the development of the GDP based on
                       the CZK exchange rate development, the method of AI is used, namely the
                       regression analysis using the artificial neural networks.
                       Findings & Value added: The effect of EUR/CZK on GDP can be
                       quantified reaching around 31%. It is assumed that the GDP will fall
                       significantly in 2020 with a certain growth only being possibly expected in
                       2021 (even more significantly in the second quarter of 2021). Due to the
                       GDP development, the development of the EUR/CZK could then be
                       forecasted as well.

                       Keywords: exchange rate; GDP; national economy; artificial neural
                       networks

                       JEL Classification: C45; E27; F31

         *
             Corresponding author: machova@mail.vstecb.cz

   © The Authors, published by EDP Sciences. This is an open access article distributed under the terms of the Creative
   Commons Attribution License 4.0 (http://creativecommons.org/licenses/by/4.0/).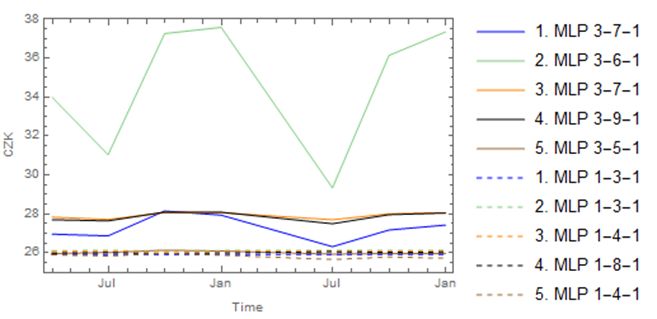
SHS Web of Conferences 9 2, 08013 (2021)                               https://doi.org/10.1051/shsconf/20219208013
Globalization and its Socio-Economic Consequences 2020

         1 Introduction and literature research
         The currency value development has a fundamental effect on gross domestic product (GDP).
         This relationship can be explained by an example of a particular economy, specifically the
         economy of the Czech Republic. In 2013, due to a crisis situation, the Central Bank (the
         Czech National Bank) began to implement an expansionary monetary policy, which a priori
         aimed to start the national economy. The manifestation of this monetary activist policy was
         the devaluation of the Czech koruna (CZK) on the currency market, which the CNB further
         supported by interventions on the currency market. Thus, the CNB Board fulfilled their
         second objective, i.e. to strengthen exports. This means a traditional view in relation to the
         exchange rate, exports, and the resulting domestic product [1]. In the current strong trend of
         new computing technologies, the use of cybernetic models may seem desirable and
         necessary. It is important to mention that the COVID-19 epidemic significantly affected the
         prediction models. The possibility of a later reflection of epidemics in the results analysis of
         these systems cannot be ruled out. This precedent raises a promise of more valuable
         predictions, as the systems will be taught a new variable.
             The outbreak of the COVID-19 coronavirus pandemic has a very significant negative
         short-term impact on global financial markets, and at the same time calls for effective
         measures. Specifically, members of the Visegrad Group noted a significant correlation
         between the growth in the number of the infected and the depreciation of national currencies
         [2-3]. In this context, Aslam, Mohti and Ferreira [4] call for a clear comprehensive response
         from the policy makers. The media had a negative impact on market developments during
         the peak of the epidemic. Based on the information they published, the principle of rational
         expectation prevailed among investors [5]. A bitter advantage of COVID-19 is the predictive
         potential that reduces the exchange rate volatility associated with the occurrence of local
         outbreaks [6]. Habib and Stracca [7] examine the stability of national currencies. They find
         that the most stable are the currencies of large states, which are less open to the inflow of
         foreign capital. A positive current account, which is a part of the balance of payments, tends
         to increase the pressure on the domestic currency [8]. The effect of the savings of migrants
         on the exchange rate is also interesting. Based on the examined data in the years 1966-2014
         in Canada, remarkable results were achieved - we can talk about a long-term relationship
         between migration and currency appreciation [9].
             Antonyova et al. [10] classify the benefits of measuring the gross domestic product
         (GDP). They state that GDP reflects the economic development of the country. Marilos,
         Rodousakis and Soklis [11] evaluate the aforementioned COVID-19 epidemic impact on the
         overall development of Greece's GDP. With the decrease in tourism revenues in the range
         between EUR 3.5 and 10.5 billion, there would be an overall decline in GDP of 2.1% to 6%.
         That is a perceptible deficit. The GDP growth is currently influenced significantly by the
         capital growth and the mobility of human capital. Such situation is caused by globalization.
         A very bad environmental impact remains its downside [12]. Song et al. [13] also confirm
         the negative impact of the economic development on the environment. Damborsky [14]
         brings an interesting finding. He examines the impact of foreign direct investment on the
         regions of the Czech Republic. He confirmed the hypothesis that the investment recipients
         are the more developed regions with a higher ratio of GDP to total GDP. This widens the gap
         between the developed and the less developed regions. Finally, Axelrad, Sabbath and
         Hawkins [15] also give interesting insights. From a sample of thirteen countries, including
         the Czech Republic, they are looking for links between body BMI, alcohol consumption,
         depression, overall health, and GDP. The results show an indirect relationship between the
         decline in GDP and the aforementioned health issues.
             Currently, neural networks are very popular as a quality prediction model. Their use is
         quite complex in all spheres. They use the principles of biological learning patterns, thus

                                                         2
SHS Web of Conferences 9 2, 08013 (2021) https://doi.org/10.1051/shsconf/20219208013
Globalization and its Socio-Economic Consequences 2020
achieving very positive results [16]. Vochozka, Horak and Suler [17] also talk about a
relevant output of the neural network prediction model in economic sectors. Vochozka et al.
[18] classify positively a neural network prediction model for its ability to give excellent
statistical performance compared to conventional models. Specifically, self-learning skills,
independence, adaptation, and fault tolerance make neural networks the first choice in
predicting complicated economic phenomena. These include, for example, economic growth,
the development of exchange rates, the development of GDP, the development of stock
indices and commodities, etc. [19-21]. Neural networks can even predict the potential
viability of a company [22]. In conclusion, the application of neural networks can provide
important guidance in implementing effective monetary and fiscal policies.
2 Data and methods
The paper´s main objective is to analyze a dependence of the Czech koruna (CZK) to Euro
(EUR) exchange rate development on gross domestic product of the Czech Republic between
the 1st quarter of 1999 and the 1st quarter of 2020. The partial objectives are as follows:
1. To determine the dependence of the CZK to EUR exchange rate (hereinafter
referred to as “EUR/CZK”) on development of the Czech Republic´s gross
domestic product (hereinafter referred to as “GDP”) in the period under review.
2. To forecast development of the EUR/CZK in individual quarters until the end of
2021 based on the relation to GDP.
Regarding the basic economic theory courses, students learn that there is a mutual
relationship between GDP and a currency value. It is yet apparent that the value is not only
determined by the amount of GDP realized. The following research question may therefore
be formulated: Is it possible to quantify the effect of the Czech Republic´s GDP on the CZK
currency value?
2.1 Data
A specific analysis will include data on the EUR/CZ exchange rate development related each
time to the last day of a quarter in the given period (the first quarter of 1999 – the first quarter
of 2020). The data are publicly available on the Czech Statistical Office website. The second
time series will involve GDP in the same period with the data also being publicly available
on the website.
As may be seen from the figure, the exchange rate of the target variable, i.e. EUR/CZK,
decreases over time. At the beginning of the period under review, it amounts to almost 39
CZK per Euro, then reaches its lowest value in mid-2008, i.e. approximately 24 CZK per
EUR. At the end of 2019, the rate stands at around 25 CZK, whilst rising to more than 27
CZK in the first quarter of 2020. On the contrary, the GDP development has a growing trend
throughout the period. In the first quarter of 1999, it reached almost 600,000 million CZK
with its highest value being realized in 2019. Not only the overall trend of the time series,
but also its seasonal fluctuations are certainly interesting. The curve indicates that each
season (or each quarter) is characterized by a specific increase or decrease in the GDP.
2.2 Methods
In order to examine the aforementioned dependence, it will be necessary to take into account
other variables as well (besides the target EUR/CZK exchange rate and the GDP input
variable). When specifying the main objective, it may be found out how EUR/CZK develops
over time and also how the result affects GDP. Thus, the interdependence between time
3SHS Web of Conferences 9 2, 08013 (2021) https://doi.org/10.1051/shsconf/20219208013
Globalization and its Socio-Economic Consequences 2020
(expressed by a certain year and quarter) and GDP on the one hand and EUR/CZK on the
other will be observed. First, a regression model is to be developed. Subsequently, shares of
individual variables in the resulting forecast will be examined through sensitivity analysis.
Furthermore, there will be regression performed using neural structures in the TIBCO
Statistica software version 13. Multilayer perceptron networks (MLP) and radial basis
function neural networks (RBF) will be generated with EUR/CZK being the dependent
variable. To be able to come to a conclusion and fulfill the main objective, it is necessary to
work with two sets of independent variables:
1. The first set will include Year and Month (representing time) and GDP. All are
continuous variables.
2. The second set will only include GDP.
The datasets are to be randomly divided into three sub-data sets – training, testing and
validation. The first group will contain 70% of the input data. Based on the training set, neural
structures will be generated. The two remaining sets shall always be left with 15% of the
input information. Both groups will be used to verify reliability of the found neural structures.
Basic statistics of the sub-data sets are given in Table 1.
Table 1. Basic statistics of monitored time series EUR/CZK, GDP.
Basic statistics by samples Input: GDP (mil. CZK) Target: EUR/CZK
Minimum (Train) 563,117 24.34500
Maximum (Train) 1,488,148 36.64000
Mean (Train) 945,826 28.53377
Standard deviation (Train) 230,626 3.42110
Minimum (Test) 573,883 23.89500
Maximum (Test) 1,412,299 35.65000
Mean (Test) 1,078,367 27.05500
Standard deviation (Test) 266,461 3.27450
Minimum (Validation) 503,674 24.66500
Maximum (Validation) 1,410,427 38.42000
Mean (Validation) 905,583 29.38917
Standard deviation (Validation) 324,270 6.33640
Minimum (Overall) 503,674 23.89500
Maximum (Overall) 1,488,148 38.42000
Mean (Overall) 958,856 28.44576
Standard deviation (Overall) 243,318 3.52624
There will be 100,000 neural networks generated, and 5 artificial neural networks
showing the best characteristics will be retained. In the hidden MLP layer, the first set of
independent variables will involve 2 to 12 neurons in the hidden layer. As for the RBF, there
will always be at least 21 (and always up to 30) neurons in the hidden layer. In relation to a
single multilayer perceptron network, the following distribution functions in the hidden layer
and in the output layer shall be considered: Linear, Logistics, Atanh, Exponential, Sinus.
Other settings will remain default (according to an ANS tool - automated neural network).
If necessary, weights of individual neurons will be iterated using a VNS tool (own neural
network). However, it should be noted that any improvement of ANS is uncertain, as it is
rather an iteration. Subsequently, sensitivity analysis will be conducted. That will answer the
question of how substantial the potential effect of GDP is on the amount of EUR/CZK.
The second part of the task is to forecast possible future development of the EUR/CZK
exchange rate. However, that requires a forecast of the GDP development, which will be
done using Wolfram's Mathematica software version 12. Artificial neural networks will also
be used together with the "Predict" tool. The tool uses neural networks as one of the possible
4SHS Web of Conferences 9 2, 08013 (2021) https://doi.org/10.1051/shsconf/20219208013
Globalization and its Socio-Economic Consequences 2020
methods. In addition, a neural network consists of stacked layers, each performing a simple
computation. Information is processed layer by layer from the input layer to the output layer.
The neural network is trained to minimize a loss function on the training set using gradient
descent. Finally, there will be a comparison of the results obtained using the first set and the
second set of independent variables.
3. Results
3.1 Balanced time series
An overview of the most successful, and hence preserved, neural networks is given in Table
2.
Table 2. Overview of preserved neural networks.
Training Test Validation Training Test Validation Training Error Hidden Output
Index Net. name
perf. perf. perf. error error error algorithm function activation activation
MLP BFGS
1 0,984135 0,953106 0,969580 0,181806 0,750054 0,589743 SOS Logistic Identity
3-7-1 105
MLP BFGS
2 0,984331 0,965149 0,971680 0,179223 0,525956 0,499160 SOS Tanh Exponent.
3-6-1 252
MLP BFGS
3 0,981684 0,945346 0,969435 0,209306 0,605815 0,490468 SOS Logistic Logistic
3-7-1 142
MLP BFGS
4 0,988177 0,981906 0,973761 0,135330 0,281696 0,433730 SOS Logistic Tanh
3-9-1 262
MLP BFGS
5 0,986210 0,976763 0,971113 0,161002 0,431364 0,474225 SOS Tanh Identity
3-5-1 211
The above table indicates excellent results of neural networks. The performance of all
sub-data sets expressed by a correlation coefficient is very high reading a value of almost
0.95 and higher in all cases. In general, the search is for a network whose correlation
coefficient is approximately the same and simultaneously as high as possible in all three sets.
All preserved neural networks show almost identical performance characteristics and errors
in all sub-data sets. The Broyden–Fletcher–Goldfarb–Shanno algorithm was used for the
calculations, whilst the least squares method was used as an error function. To activate the
inner layer of neurons, neural networks use a logistics function or a hyperbolic tangent
function. Furthermore, identical, exponential, logistics and hyperbolic tangent functions are
used for the output neuron activation. To be able to state which of the preserved neural
networks will suit the forecast the most, basic statistical characteristics of balanced
EUR/CZK time series will be assessed (for more details, see Table 3).
Table 3. Basic statistical characteristics of balanced time series according to individual sub-data sets.
1.MLP 2.MLP 3.MLP 4.MLP 5.MLP
Statistics
3-7-1 3-6-1 3-7-1 3-9-1 3-5-1
Minimum prediction (Train) 24.96991 25.13507 25.10512 24.78663 24.71323
Maximum prediction (Train) 37.03565 36.64403 36.52705 36.17819 36.87655
Minimum prediction (Test) 25.05532 25.34296 25.35904 23.92133 24.96902
Maximum prediction (Test) 36.97057 36.21590 36.49892 36.24443 36.67780
Minimum prediction (Validation) 26.31489 26.15978 25.74334 24.43127 26.08419
Maximum prediction (Validation) 38.67207 38.01590 36.63447 36.30061 37.72994
Minimum residual (Train) -1.69429 -1.43364 -1.35126 -1.17859 -1.36072
Maximum residual (Train) 1.45776 1.68938 1.77356 1.44208 1.56219
Minimum residual (Test) -2.93733 -2.65568 -2.64923 -1.43717 -2.39320
Maximum residual (Test) 0.83201 0.80529 1.32172 0.53111 0.14178
Minimum residual (Validation) -2.29521 -2.27290 -1.53119 -1.59862 -2.26408
Maximum residual (Validation) 1.01376 0.79007 1.78553 2.11939 0.98859
5SHS Web of Conferences 9 2, 08013 (2021) https://doi.org/10.1051/shsconf/20219208013
Globalization and its Socio-Economic Consequences 2020
Minimum standard residual (Train) -3.97359 -3.38644 -2.95357 -3.20382 -3.39120
Maximum standard residual (Train) 3.41887 3.99053 3.87664 3.92007 3.89330
Minimum standard residual (Test) -3.39161 -3.66185 -3.40369 -2.70781 -3.64382
Maximum standard residual (Test) 0.96069 1.11040 1.69812 1.00068 0.21588
Minimum standard residual (Validation) -2.98876 -3.21706 -2.18637 -2.42737 -3.28776
Maximum standard residual (Validation) 1.32009 1.11826 2.54954 3.21812 1.43556
It is obvious from the table that the characteristics of balanced time series according to
the preserved neural networks and individual sub-data sets differ to a minimum extent. More
noticeable deviations can be observed in relation to the residues. Nevertheless, it is
appropriate to include all preserved neural networks in further calculations.
In order to determine whether EUR/CZK is dependent on GDP and to what extent,
sensitivity analysis was carried out (Table 4).
Table 4. Sensitivity analysis of EUR/CZK on GDP.
Networks GDP (mil. CZK) Year Quarter Share of GDP on generating (EUR/CZK)
1.MLP 3-7-1 9.990928E+00 20.6442 1.212224 31%
2.MLP 3-6-1 1.733305E+09 47.5038 8.208120 100%
3.MLP 3-7-1 3.239170E+01 21.0863 1.740924 59%
4.MLP 3-9-1 3.216034E+02 120.5903 3.606025 72%
5.MLP 3-5-1 9.810282E+00 17.9809 1.122955 34%
Average 3.466611E+08 45.5611 3.178050 31%
The table clearly shows that the effect of GDP on the EUR/CZK exchange rate
development is relatively significant. However, the interval depends on a particular neural
network model used ranging from 31% to 100%. Thus, in view of the conclusions to be
beneficial, it is essential to determine (validate) which neural network model is the most
appropriate.
3.2 Validation of neural network models
To perform validation, it was necessary to forecast future GDP developments. That was done
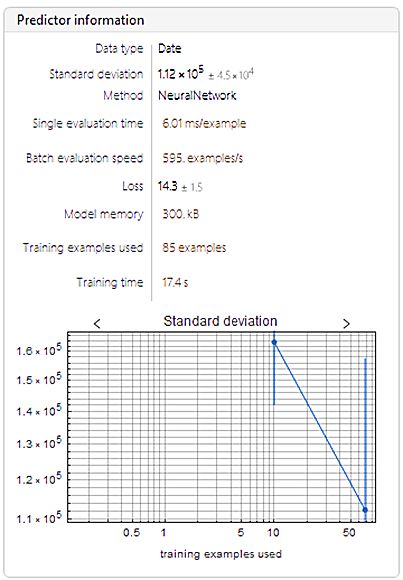
in accordance with the Mathematica software methodology. Forecast characteristics are
shown in Figure 1.
Fig. 1. GDP forecast characteristics.
6SHS Web of Conferences 9 2, 08013 (2021) https://doi.org/10.1051/shsconf/20219208013
Globalization and its Socio-Economic Consequences 2020
The above figure illustrates the basic characteristics of a model and its training (creation)
process. As already mentioned in the Methods section, neural networks were used. Moreover,
standard deviation, number of examples, dose size, loss and training time are also given.
Particular values of the GDP forecast are stated in Table 5.
Table 5. GDP forecasts until the end of 2021.
Date GDP in mil. CZK
30.06.2020 1,261,875
30.09.2020 1,171,936
31.12.2020 1,239,259
31.03.2020 1,227,217
30.06.2021 1,328,879
30.09.2021 1,282,118
31.12.2021 1,305,633
In relation to the entire GDP time series development to be evident, including the values
forecasted until the end of 2021, a graph representing the period under review was created
(Figure 2).
2 000 000
GDP in mil. CZK
1 500 000
1 000 000
500 000
0
Date
Fig. 2. GDP development including forecasts until the end of 2021.
As captured in the graph, there is a significant GDP decline in the second quarter of 2020
(as opposed to the expected seasonal growth). That may be the result of measures against
COVID-19.
Consequently, all data are now available to forecast the future development of EUR/CZK.
It may therefore be proceeded to forecasts according to individual preserved neural networks.
Based on the result, it will be determined which set of the independent data helped to create
a higher quality model (Figure 3).
Fig. 3. Forecasts of future EUR/CZK development until the end of 2021.
7SHS Web of Conferences 9 2, 08013 (2021) https://doi.org/10.1051/shsconf/20219208013
Globalization and its Socio-Economic Consequences 2020
The solid lines represent forecasts in which GDP plays a significant role, whereas the
dashed lines represent forecasts based only on GDP. Hence the above figure validates the
previously mentioned partial conclusion, i.e. the EUR/CZK exchange rate development
depends to some extent on GDP. Correspondingly, what may be excluded are forecasts using
models developed on the basis of the second set of independent variables and simultaneously
using the neural network 2. MLP 3-6-1. In the following part, the main focus will therefore
only be on neural networks developed on the basis of the first set of independent variables
(yet to be complete, 2. MLP 3-6-1 shall also be included).
3.3 Neural networks of the first set of independent variables
Balanced time series using artificial neural networks and their forecasts were illustrated
graphically. The success of individual models in balancing the time series as well as the future
forecasts until the end of 2021 is registered. The dependence, or forecasted dependence, of
EUR/CZK on GDP, or GDP forecast were also illustrated graphically.
There appears to be probable development according to networks 1. MLP 1-7-1, 3. MLP
1-7-1 and 4. MLP 1-9-1. A decline in GDP is expected, followed by an increase in EUR/CZK.
Rather an expert estimate may be used to state the most likely development according to 1.
MLP 1-7-1, which then implies that the above research question may be answered. Yes, the
EUR/CZK exchange rate is dependent on GDP development. The effect can be quantified
amounting to 31% in this case (or from the first quarter of 1999 to the first quarter of 2020).
4 Conclusion
The main objective was to analyze a dependence of the Czech koruna (CZK) to Euro (EUR)
exchange rate development on gross domestic product of the Czech Republic related to the
period from the 1st quarter of 1999 to the 1st quarter of 2020. The partial objectives were as
follows:
1. To determine the dependence of the CZK to EUR exchange rate (hereinafter referred to
as “EUR/CZK”) on development of the Czech Republic´s gross domestic product
(hereinafter referred to as “GDP”) in the period under review.
2. To forecast development of the EUR/CZK in individual quarters until the end of 2021
based on the relation to GDP.
The main objective was fulfilled as the experiment proved that the effect of EUR/CZK
on GDP can be quantified reaching around 31%. That was subsequently verified by
forecasting the future EUR/CZK development. It is assumed that the GDP will fall
significantly in 2020 with a certain growth only being possibly expected in 2021 (even more
significantly in the second quarter of 2021). Due to the GDP development, the development
of the EUR/CZK could then be forecasted as well. The results show that the CZK exchange
rate will weaken to more than 28 CZK per EUR in the observed period indicating that the
CZK exchange rate will therefore be more in favor of the Czech Republic's exports abroad.
The most favorable situation for exporters (yet the worst for importers) will then occur in the
third quarter of 2020.
To be able to determine the very exact value of the EUR/CZK dependence on the Czech
Republic´s GDP, all of the effects involved would have to be recognized, which is almost
impossible to do. In further research, other possible influences and their relationship to the
EUR/CZK will gradually be identified leading to a more accurate result of the relationship
between the GDP and the EUR/CZK.
8SHS Web of Conferences 9 2, 08013 (2021) https://doi.org/10.1051/shsconf/20219208013
Globalization and its Socio-Economic Consequences 2020
References
1. Mandel, M., Tran, Q. V. (2017). An Empirical Verification of Export Function Focused
on the Impact of EUR/CZK Exchange Rate. Politicka ekonomie, 65(6), 649-668.
2. Czech, K., Wielechovski, M., Kotyza, P., Benesova, I., Laputkova, A. (2020). Shaking
Stability: COVID-19 Impact on the Visegrad Group Countries' Financial Markets.
Sustainability, 12(5).
3. He, Q., Liu, J. Y., Wang, J. Y., Wang, S. Z., Yu, J. S. (2020). The impact of COVID-19
on stock markets. Economic and Political Studies, 8(3), 257-288.
4. Aslam, F., Mohti, W., Ferreira, P. (2020). Evidence of Intraday Multifractality in
European Stock Markets during the Recent Coronavirus (COVID-19) Outbreak.
International Journal of Financial Studies, 8(2), Article Number 31.
5. Engelhardt, N., Krause, M., Neukirchen, D., Posch, P. (2020). What Drives Stocks
during the Corona-Crash? News Attention vs. Rational Expectation. Sustainability,
12(12).
6. Iyke, B. N. (2020). The Disease Outbreak Channel of Exchange Rate Return
Predictability: Evidence from COVID-19. Emerging Markets Finance and Trade,
56(10), 2277-2297.
7. Habib, M. M., Stracca, L. (2012). Getting beyond carry trade: What makes a safe haven
currency? Journal of International Economics, 87(1).
8. Hashimoto, O., Ono, Y. (2020). A simple aggregate demand analysis with dynamic
optimization in a small open economy. Economic Modelling, 91, 89-99.
9. Aziz, N., Cooray, A., Teo, W. L. (2020). Do immigrants' funds affect the exchange rate?
The World Economy.
10. Antonyova, A., Antony, P., Soewito, B., Bin Abdullah, A., Nagapan, S. (2018).
Reflection of Gross Domestic Product into the Income Values According to the Attained
Level of Education in Europe. Advanced Science Letters, 24(12), 9261-9265.
11. Mariolis, T., Rodousakis, N., Soklis, G. (2020). The COVID-19 multiplier effects of
tourism on the Greek economy. Tourism Economics, Article Number
1354816620946547.
12. De Pascale, G., Sardaro, R., Faccilongo, N., Conto, F. (2020). What is the influence of
FDI and international people flows on environment and growth in OECD countries? A
panel study. Environmental Impact Assessment Review, 84.
13. Song, W. Z., Wang, C., Chen, W. Q., Zhang, X. L., Li, H. R., Li, J. (2020). Unlocking
the spatial heterogeneous relationship between Per Capita GDP and nearby air quality
using bivariate local indicator of spatial association. Resources, Conservation and
Recycling, 160, Article Number 104880.
14. Damborsky, M. (2019). Regional distribution of the foreign direct investments in the
context of the economic level of the regions of the Czech Republic. Geographia
Cassoviensis, 13(2), 161-179.
15. Axelrad, H., Sabbath, E. L., Hawkins, S. S. (2017). The impact of the 2008 recession on
the health of older workers: data from 13 European countries. The European Journal of
Public Health, 27(4), 647-652.
16. Vrbka, J., Rowland, Z. (2017). Stock price development forecasting using neural
networks. In Váchal, J., Vochozka, M., Horak, J. (Eds.), SHS Web of Conferences:
Innovative Economic Symposium 2017 – Strategic Partnership in International Trade.
Les Ulis, France: EDP Sciences.
9SHS Web of Conferences 9 2, 08013 (2021) https://doi.org/10.1051/shsconf/20219208013
Globalization and its Socio-Economic Consequences 2020
17. Vochozka, M., Horak, J., Suler, P. (2019). Equalizing Seasonal Time Series Using
Artificial Neural Networks in Predicting the Euro-Yuan Exchange Rate. Journal of Risk
and Financial Management, 12(2).
18. Vochozka, M., Rowland, Z., Suler, P., Marousek, J. (2020). The influence of the
international price of oil on the value of the EUR/USD exchange rate. Journal of
Competitiveness, 12(2), 167-190.
19. Feng, L. H., Zhang, J. Z. (2020). Application of artificial neural networks in tendency
forecasting of economic growth. Economic Modelling, 40, 76-80.
20. Stehel, V., Horak, J., Vochozka, M. (2019). Prediction of institutional sector
development and analysis of enterprises active in agriculture. E+M Ekonomie a
Management, 22(4), 103-118.
21. Vrbka, J., Nica, E., Podhorska, I. (2019). The application of Kohonen networks for
identification of leaders in the trade sector in Czechia. Equilibrium- Quarterly Journal
of Economics and Economic Policy, 14(4).
22. Horak, J., Vrbka, J., Suler, P. (2020). Support Vector Machine Methods and Artificial
Neural Networks Used for the Development of Bankruptcy Prediction Models and their
Comparison. Journal of Risk and Financial Management, 13(3).
10You can also read


