Telefónica Deutschland - Investor presentation September 2020 - Telefónica Deutschland

Page created by Felix Reeves
 
CONTINUE READING
Telefónica Deutschland - Investor presentation September 2020 - Telefónica Deutschland
Telefónica Deutschland
Investor presentation

September 2020
Telefónica Deutschland - Investor presentation September 2020 - Telefónica Deutschland
Disclaimer

   This document contains statements that constitute forward-looking statements and expectations about Telefónica Deutschland Holding AG (in the following “the Company” or
   “Telefónica Deutschland”) that reflect the current views and assumptions of Telefónica Deutschland's management with respect to future events, including financial projections
   and estimates and their underlying assumptions, statements regarding plans, objectives and expectations which may refer, among others, to the intent, belief or current
   prospects of the customer base, estimates regarding, among others, future growth in the different business lines and the global business, market share, financial results and
   other aspects of the activity and situation relating to the Company. Forward-looking statements are based on current plans, estimates and projections. The forward-looking
   statements in this document can be identified, in some instances, by the use of words such as "expects", "anticipates", "intends", "believes", and similar language or the
   negative thereof or by forward-looking nature of discussions of strategy, plans or intentions. Such forward-looking statements, by their nature, are not guarantees of future
   performance and are subject to risks and uncertainties, most of which are difficult to predict and generally beyond Telefónica Deutschland's control, and other important
   factors that could cause actual developments or results to materially differ from those expressed in or implied by the Company's forward-looking statements. These risks and
   uncertainties include those discussed or identified in fuller disclosure documents filed by Telefónica Deutschland with the relevant Securities Markets Regulators, and in
   particular, with the German Federal Financial Supervisory Authority (Bundesanstalt für Finanzdienstleistungsaufsicht – BaFin). The Company offers no assurance that its
   expectations or targets will be achieved. Analysts and investors, and any other person or entity that may need to take decisions, or prepare or release opinions about the
   shares / securities issued by the Company, are cautioned not to place undue reliance on those forward-looking statements, which speak only as of the date of this document.
   Past performance cannot be relied upon as a guide to future performance. Except as required by applicable law, Telefónica Deutschland undertakes no obligation to revise
   these forward-looking statements to reflect events and circumstances after the date of this presentation, including, without limitation, changes in Telefónica Deutschland’s
   business or strategy or to reflect the occurrence of unanticipated events. The financial information and opinions contained in this document are unaudited and are subject to
   change without notice. This document contains summarised information or information that has not been audited. In this sense, this information is subject to, and must be
   read in conjunction with, all other publicly available information, including if it is necessary, any fuller disclosure document published by Telefónica Deutschland. None of the
   Company, its subsidiaries or affiliates or by any of its officers, directors, employees, advisors, representatives or agents shall be liable whatsoever for any loss however arising,
   directly or indirectly, from any use of this document its content or otherwise arising in connection with this document. This document or any of the information contained
   herein do not constitute, form part of or shall be construed as an offer or invitation to purchase, subscribe, sale or exchange, nor a request for an offer of purchase,
   subscription, sale or exchange of shares / securities of the Company, or any advice or recommendation with respect to such shares / securities. This document or a part of it
   shall not form the basis of or relied upon in connection with any contract or commitment whatsoever. These written materials are especially not an offer of securities for sale
   or a solicitation of an offer to purchase securities in the United States, Canada, Australia, South Africa and Japan. Securities may not be offered or sold in the United States
   absent registration under the US Securities Act of 1933, as amended, or an exemption there from. No money, securities or other consideration from any person inside the
   United States is being solicited and, if sent in response to the information contained in these written materials, will not be accepted.

                                                                                                                                                                                           2
Telefónica Deutschland - Investor presentation September 2020 - Telefónica Deutschland
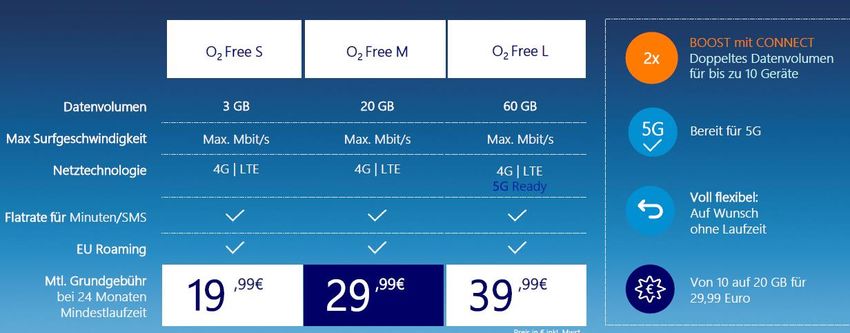
The Telefónica Deutschland Equity Story: Why should you invest?

             Germany                 An established player         Operational excellence              Value proposition
     An attractive and dynamic   Leveraging economies of scale   Digital transformation drives   Attractive shareholder return
         telecoms market                                                     growth                 on strong fundamentals

         Excellent macro                Largest owned                 All-infrastructure              Clear growth path
                                        customer base                       set-up
         Rational market                                                                                  Strong FCF
                                         Multi-brand                      Successful                      trajectory
           Data growth
                                                                       integration track
                                        Multi-channel                                                 High pay-out ratio
         Soft convergent                                                    record
                                                                                                          to FCF aL
          environment                  Customer-centric
                                                                       Transformation
                                       convergence play                                                  Conservative
       3 integrated players                                                  with
                                                                                                       financial profile
                                        Fixed-mobile-                  Digital4Growth:
                                         substitution                      SIMPLER
                                                                            FASTER
                                                                            BETTER

                                                                                                                                 3
Telefónica Deutschland - Investor presentation September 2020 - Telefónica Deutschland
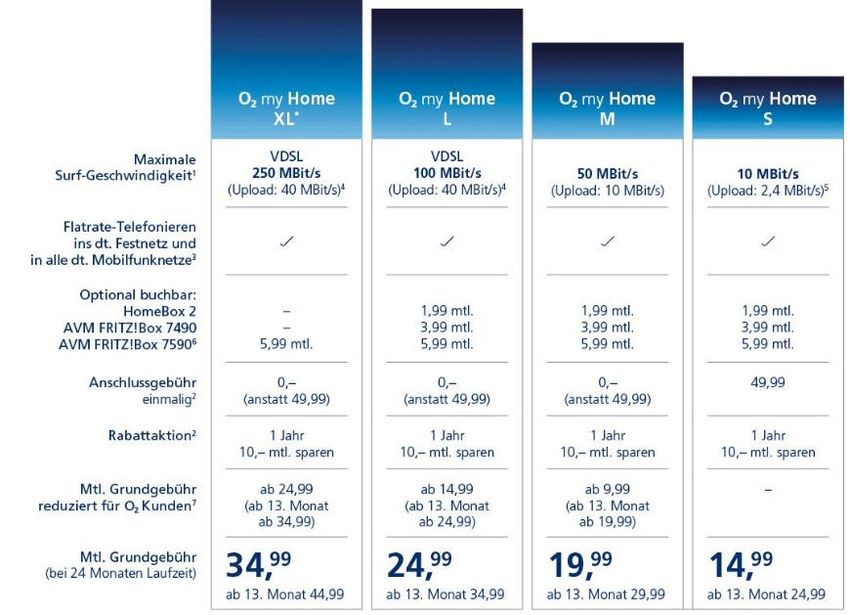
We steer our sustainability commitments with our Responsible Business Plan 2020

                  Managing responsibly        Strengthening digital life       Protecting environment

               Consistently good to very    People are benefitting from     Ambition to reduce direct &
              good results and ratings by   our products in their digital    indirect CO2 emissions by
                 external assessments                lifestyle                     -11% vs 2017

                                                                                                          4
Telefónica Deutschland - Investor presentation September 2020 - Telefónica Deutschland
Telefónica Deutschland’s way forward

       1       1998 - 2008          2      2009 - 2019                 3     2020 and beyond

       BUILD                        SCALE                               GROW

       • Business set-up            • Acquisition & integration of      • Mobile growth in rural &
       • Introduction of O2 brand     HanseNet & E-Plus                   reinforcement in urban
       • Start of 4th network       • Consumer mobile leadership        • Smart bundling
                                    • Established fixed player          • B2B push

           Market entrance          Integration                 Benefits from scale & transformation

                                                                                                       5
Telefónica Deutschland - Investor presentation September 2020 - Telefónica Deutschland
Reiterating key priorities of strategic plan for the ‘new 20s’

    Accelerating growth trajectory
                                                      
    Boost rural coverage, accelerate urban capacity

                                                             Commitment to deliver attractive
    Smart bundling to improve loyalty
                                                                shareholder remuneration

    Technology-agnostic internet solutions;
    FMS to improve profitability

    Leverage B2B strategy to gain fair market share
    in SME

                                                                                                6
Germany a safe harbour;
5G and exclusive cable access as game changers for Telefónica Deutschland

   Stable macro-environment                            Current trends                       Future trends

    Unemployment rate1
               5.7%                                    Dynamic yet rational mobile market   5G use cases & demand to accelerate
                                        5.2%   5.0%

               2017                    2018    2019                                         Fixed-Mobile-Substitution (FMS)
                                                       Data growth continued CAGR of >50%
                                                                                            becoming increasingly relevant

    Consumer spend2
    in EUR bn                                          Soft convergent market environment   Potential 4th urban MNO
               1,697                   1,744   1,794

               2017                    2018    2019    3 strong mobile networks             3 integrated (mobile + fixed) players

      1 Source:   Federal Employment Agency
      2   Source: Destatis                                                                                                          7
Competitive environment

Rational and balanced market structure1                                                                         Market development in past years2
                                                                                                                Mobile market: Service revenues
                                                                                                                EUR bn

                                                                                                                                                     +3%                       +2%

                                                                                                                                     17.1                          17.7                18.0
                                         32%
                                                                           38%

                                                                                                                                     2017                      2018                    2019
                                                                                                                Fixed broadband retail revenues
                                                      31%                                                       EUR bn
                                                                                                                                               +4%                             +3%

                                                                                                                                         8.3                       8.7                     8.9
                                                                                                                                               0.1                       0.2                     0.3
                                                                                                                                   1.5                       1.7                     1.8

                                                                                                                                         6.7                       6.8                     6.8
 •   Rational market following 4 to 3 consolidation
 •   Tiered mobile data portfolios enabling data monetisation                                                                        2017                      2018                    2019
                                                                                                                                                           Fibre           Cable      DSL

       1 Market   share of MSR (IFRS 15) based on reported financials by MNOs for Q2 2020
       2   Source: Analysys Mason “Western Europe telecoms market trends and forecasts 2019–2024”, 28.02.2020                                                                                          8
The right time to invest to accelerate future growth for Telefónica Deutschland

              Competitive spectrum position                         Largest infrastructure footprint with exclusive
                                                                                cable wholesale access
             5%
                                >300MHz                   >90% with                                        >30
       32%                                                German households Mbit/s
                        31%
                                                                                                                                                       DSL                       fibre

                  32%
                                                                                                                                                                   cable

            3x ‘GOOD’                                                                                             Customer experience
                                                Deutschland
         in all network tests
                                                             WINNER                    WINNER               VERY GOOD               VERY GOOD                VERY GOOD             4.5/5
                                                                Stores                Partner-Stores            Fixed Net             Fixed Net               Service App           O2 TV
                                                        National store operators     Franchise operators    Fixed Net big players   Fixed Net offers             Telcos     Computer Bild User Test

       Significantly improved network performance                                  Premium customer service & access to
                   for ~44m mobile accesses                                                 all sales channels
                                                                                                                                                                                                      9
Future-proof spectrum set-up to enable best customer experience

  Balanced position in coverage and capacity spectrum until 2025
                                                                                        5G         5G           4G            5G            5G          5G           5G             5G              5G
    Potential future utilisation
                                                                                        4G         4G           2G            4G            4G          4G           4G             4G

    Utilisation today                                                                   4G         4G          2G/4G                      2G/4G        3G/4G         4G            pLTE

     Total availability                                                              2x 30 MHz   2x 30 MHz    2x 35 MHz     1x 40 MHz    2x 75 MHz    2x 60 MHz    2x 70 MHz     1x 50 MHz       1x 300 MHz

                                                                                                                                                                                                    50

   Total Spectrum holding
                                                                                                                                                                                                    70

                5%

                           31%                                                                                                             2x10
                                                                                                                                                                    2x10                            90
   32%                                                     1&1 Drillisch                                                                   2x10
                                                                                                                                                       2x20         2x20
                                                                                                                                           2x25
                                                           Telefónica Deutschland                                                                      2x5
                                                                                                               2x10                                                 2x20
                                                                                       2x10       2x10                                                 2x15
                                                           Vodafone                                                                                                                                 90
                     32%                                                                                       2x10                        2x15                                   1x20
                                                                                       2x10       2x10                       1x20                      2x10
                                                                                                                                                                    2x20           1x25
                                                           Deutsche Telekom            2x10       2x10         2x15          1x20          2x15        2x10                         1x5
                                                                                     700 Mhz     800 MHz      900 MHz     1500 MHz SDL   1,800 MHz   2,100 MHz1   2,600 MHz    2,600 MHz TDD   3,500 MHz TDD
      TEF       VF    DT     DRI                           Frequencies

                                                           Maturity                 2019-2033    2010-2025   2017-2033    2015-2033      2010-2025   2010-2025    2010-2025     2010-2025        2019-2040
                                                                                                                                         2017-2033   2021-2040

         1 In
            addition: 24.2 MHz @2.1 GHz TDD, ab 2021 19.2 mHZ
          As of 1 January 2026: DRI: 2x10 MHZ; TEF D: 2x10 MHz; Vod: 2x20 MHz; DT: 2x20 MHz                                                                                                                    10
The expansion of our mobile network allows Telefónica Deutschland to accelerate
our growth trajectory

   Opportunity: Mobile      Step change in network quality    Boost revenues to outperform
   customer distribution    from accelerated 4G/5G roll-out   market

                                                                      Mobile growth in rural –
                                                                      reinforcement in urban
                                      Boost rural
                                      coverage via 4G

                                                                      Smart bundling
                                                                      to capture value and
                                                                      reduce churn

       >50%                           Accelerate
                                      urban capacity via              Attack in B2B
Revenue growth driven by a step-up in 4G network quality and 5G boost

  Mobile customer share                  Sustained focus on owned customer base                      MSR

                                                                                                             Rural market share

                                                                                                                     Fair share

                                                                                                                2019         2022

                                                                                                            Urban market share
                                                                                                                 Maintain share

                                                                                                                2019         2022
      >50%
                                                                                                        Gradual transition of
                       80%
                                   service providers & MVNO                   owned customers

      1 Not   exhaustive                                                                        Slide updated 16 June 2020
                                                                                                                                    12
All-infrastructure play as unique positioning

   MOBILE
   INFRASTRUCTURE
             Fixed-
             Mobile-
             Substitution
                                        Smart bundling to capture value and reduce churn
             (FMS)

                                        Technology-agnostic Internet@Home solutions with focus on
   FIXED NET                            customer experience
   INFRASTRUCTURE
                                        Fixed-mobile-substitution increases profitability
            FttX incl. VDSL

            Cable

                                                                                                    13
Improve loyalty and convergence positioning by pushing smart bundling approach

                                                                  Impact on churn reduction

  !   Fixed-mobile
      bundling
                                          Mobile-mobile
                                          bundling        ~-50%              ~-30%            ~-50%

                     Mobile customers
                     with >1 O2 product                            Share of wallet increase
                                                                          Household
                     ~60%         ~70%                               €    bill size

                     2019          2022
                                                              Household penetration higher

      Bundling                            Mobile
      with TV                             Connect

                                                                                                      14
B2B strategy drives growth by positioning Telefónica Deutschland
as price/value leader for SMEs

                                                  B2B revenue &
                                                  market share
                                             2019 / 2020
                                                                                              2021
                                     PULL                              PUSH

                Go-to-Market                Personalised          Improved sales        Portfolio for
                  strategy                   customer               approach            digitalisation
                                              service

                                             Unique service                              IoT, cloud, cyber
                Price/value leader
                                            proposition with      Push via Tele-sales   security, private 5G
                      for SME
                                            dedicated contact                                 network

                                                                                                               15
Driving intact business dynamics despite COVID-19

                                                                             H1 20

                 GROWTH                                                           +2.0%            +3.8%1       -1.9%          +2.4%1,2             13.1%
                     &                                                                  REVENUE y-o-y                 OIBDA2 y-o-y                   CAPEX/SALES
               PROFITABILITY

    CUSTOMER EXPERIENCE
             &
                                                                                        +347k                         14.3%                         Stable
                                                                                      Postpaid net adds       Own brand annualised churn Own brand postpaid ARPU
       DIGITALISATION                                                                  (ex 116k M2M)              rate at historic low      (ex roaming) y-o-y

                                                                                  •    Resilient network coping well with COVID-19 driven traffic increase
               FOUNDATION                                                         •    Steady progress with LTE rollout – on track to achieve FY20 coverage target
                                                                                  •    ESG – accelerated ambition to be 'climate neutral' latest by 2030

     1 Excl. combined COVID-19 impacts and other non-recurrent special factors.
     2   Adjusted for exceptional effects.
                                                                                                                                                                     16
Seeing encouraging signs of operational recovery with phased easing of COVID-19 restrictions

   O2 gross adds – recovery to pre COVID-19 level         Prepaid top up bookings – fully recovered

   JAN       FEB       MAR       APR       MAY      JUN   JAN       FEB       MAR        APR       MAY          JUN

   O2 churners – reduced to lower levels                  Roaming revenue – initial signs of gradual recovery

   JAN       FEB       MAR       APR       MAY      JUN   JAN       FEB       MAR        APR       MAY          JUN

                                                                                                                      17
Resilient network – foundation for future growth

    Network roll-out strategy                        Steady progess with network roll-out strategy
                            2020    2021      2022
                                                     • On track to achieve FY20 coverage
                                                       target of 7.6k LTE sites
                      4G coverage 50 Mbit/s
                                99%                       • >90% pop coverage

                                                          • 100% household coverage in
        Boost rural   4G/5G coverage 100 Mbit/s             Berlin, Hamburg, Bremen
         coverage                              98%
                                                          • 97% household coverage in NRW

                      4G capacity                         • 40% of FY20 LTE target achieved

                           Re-farm 2.1 GHz to 4G     • Ericson to build 5G core network

        Accelerate    5G roll-out in cities          • Ramp up of 5G rollout into top
          urban                                        5 German cities
         capacity           Top 5 Top 30
                            cities cities

                                                                                                     18
Revenue – operational trends intact

 Revenue slightly up despite reduced roaming contribution                                          Operational MSR trend intact despite tougher comps
 (EUR m)                                                    MSR          Handset   Fixed   Other   (EUR m)                                                   -3.3%

                                                                                                                                              Operational1   +1.3%
                                                                          +0.3%

                                                          Operational1    +3.8%                          1,319     1,361    1,341      1,311                 1,275

                                                                                                         Q2’19     Q3’19    Q4’19      Q1 ’20                Q2 ’20
                        1,785                                              1,790
                                                 +8
                         185                                               193
                                                 +41                                               Continued demand for high-value devices
                         281                                               322                     (EUR m)                                                   +14.4%
                                                 -43
                                                                                                                   318       432        339                   322
                                                                                                             281

                                                                                                         Q2’19     Q3’19    Q4’19      Q1 ’20                Q2 ’20

                        1,319                                              1,275
                                                                                                   Fixed revenue growth driven by improved customer mix
                                                                                                   (EUR m)
                                                                                                                                                             +4.3%

                                                                                                             185   185       189        193                   193

                        Q2 ’19                                            Q2 ’20                         Q2’19     Q3’19    Q4’19      Q1 ’20                Q2 ’20

           1 Excl.   combined COVID-19 impacts and other non-recurrent special factors                                                                                19
Gradual trading recovery & early signs of ARPU rebound post lockdown

 Focus in mobile on profitable growth                                                                             Sustained demand for VDSL drives growth
 Net adds (k)                               Postpaid (ex M2M)          M2M                                        Net adds (k)                                       Retail

       1.2%       1.4%      1.2%             1.3%             1.1%         O2 PO churn
                                                                                                                                                            2.2m
                             456
                   392                                                                                                                                    DSL base
       301
                                             227               236
                   367       443
       357                                                     158                                                         38
                                             188                                                                                  31
                                                                                                                                                   25
                   25        13               39                78                                                                        13                  13
       -56
      Q2’19       Q3’19     Q4’19           Q1 ’20           Q2 ’20                      APR ’20        JUN ’20          Q2’19   Q3’19   Q4’19   Q1 ’20     Q2 ’20

   O2 Free partly offsets reduced roaming contribution to ARPU                                                      Fixed ARPU reflects higher VDSL share
 ARPU (EUR)               ARPU postpaid (ex M2M)        Own brand ARPU                                            ARPU (EUR)                                         Retail
                                    Q2 own brand postpaid                          Own brand                                                                +1.7%
                                      ARPU (ex roaming)            -2.3%         postpaid ARPU     +0.7%
                                        broadly stable                            (ex. roaming)

                                                                                                                         23.4    23.2    23.1     23.7       23.8
    14.4        14.4      14.0            13.7              13.3

      Q2’19       Q3’19     Q4’19           Q1 ’20           Q2 ’20                                JUN ’20              Q2’19    Q3’19   Q4’19   Q1 ’20     Q2 ’20

                                                                                                                                                                              20
Operational OIBDA1,2 continues to grow in H1 20

 H1 20 revenue impacted by special factors with flow-through to OIBDA
 (EUR m)

                                                      56

                                                                                                                                                      Operational1,2   +2.4%      -1.9%
                                                                                          -1,171                                                                                  y-o-y

                                                                                                                                                                       31.2%
                                                                                                                                                                       margin

                                                                                                              -292
                3,636
                                                                                                                              -1,150

                                                                                                                                                 -6

                                                                                                                                                                                1,085

               Revenue                         Other Income                              Supplies       Personnel expenses     Other     Exceptional effects               OIBDA adj.
                                                                                                                             expenses3                                   for exceptional
                                                                                                                                                                             effects2

           1 Excl.combined COVID-19 impacts and other non-recurrent special factors
           2 Adjusted for exceptional effects                                                                                                                                              21
           3 Includes exceptional effects, Group fees and impairment losses in accordance with IFRS 9
Free Cash Flow dynamics reflect usual seasonal movements

 Evolution of H1 20 FCF
 (EUR m)

                                                                               WC movements & adjustments: EUR -264 m
                                        -475
            1.079
                                                                    -73                         -10                         -11
                                                                                                                                                      -170                        -25                        316                -336
                                                                                                                                                                                                                                                  -21
            OIBDA                 CapEx ex spectrum1        CapEx payables1               Prepayments                Restructuring             Other working                    Others             FCF pre dividends &     Lease payments        FCF aL
                                                                                                                                             capital movements                                     spectrum payments2

 Net debt3 – leverage well in-line with target
 (EUR m)

                  1.7x                                                                                                                                                                                                                         1.9x
           Leverage      ratio4                                                                                                                                                                                          506
                                                                                                                        3                                336                                52

                                                  -316                               -2
                  3.860                                                                                                                                                                                                                       4.438

             Net Debt                   FCF pre dividend &                   Lease liabilities                     Net Invest                    Lease payments                           other                     Dividend                 Net Debt
             31.12.19                   spectrum payments                                                                                                                                                                                   30.06.2020

              1 Excluding additions from capitalised right-of-use assets and investments in spectrum
              2 FCF pre dividends & spectrum payments is defined as the sum of cash flow from operating activities & cash flow from investing activities                                                                                                  22
              3 Net financial debt includes current and non-current interest-bearing financial assets and interest-bearing liabilities as well as cash and cash equivalents and excludes payables for spectrum
              4 Leverage ratio is defined as net financial debt divided by the OIBDA for the last twelve months adjusted for exceptional effects
Strong liquidity position - smooth debt maturity profile and well diversified financing mix

 Maturity profile1                                                                                                               Financing and interest mix2
 (EUR m)                                                                                                                                                  Money Market
                                                                                                                                                           EUR 118,5m
                                                                                                                                             Synd. Loan
                                                                                                                                                                  3%        Bilateral RCFs
                                                            837                                                                              EUR 750m
                                                                                                                                                                              EUR 660m
                                                                                                                                                            16%     14%
                                                   704                                                                                                                                                 28%
     614     575
                                                                                                                                           SSD        16%
                                                                                                                                                                        24%      Bonds                         72%
                                          338                                                                                           EUR 722,5m
                                                                                                                                                                               EUR 1.1 bn
                                 214                                                                                                                       18%
                                                                                                                                                                  10%
                         75                                                                                        92                            EIB
                                                                      3       19       10          33                     5
                                                                                                          0                                   EUR 825m
    2020     2021       2022     2023     2024    2025     2026     2027     2028     2029     2030     2031   2032     2033                                      Telfisa                               Fix     Float
           SSD        EIB 2016          SynLoan       Money Market           Bonds         Telfisa drawn       Telfisa undrawn                                   EUR 450m

 Liquidity position                                                                                                              Comments
 (EUR m)                                                                                                                         • Ample liquidity of c. EUR 2.3bn provides significant financial stamina. This includes a
                                                                                                           2,300
                                                                                                                                   EUR450m undrawn EIB Loan

                                                                                                                                 • Well balanced and diversified maturity profile
                                                              2,195
                   105
                                                                                                                                 • Low exposure to changes in interest rates due to a high percentage of debt at fixed
                                                                                                                                   rates

    Cash and Cash Equivalents                       Undrawn RCF’s/Loans,                                Liquidity                • EUR 118.5m Money Market Facilities outstanding
                                                       Ext. Overdraft

             1   Maturity profile excludes bilateral facilities and undrawn EIB loan of EUR 450m
             2   Interest mix excludes undrawn facilities                                                                                                                                                                    23
Strong confidence in mid-term FCF generation ability and remain committed to attractive
shareholder remuneration

                                               • Temporary investment programme to drive future growth & profitability
                                               • Strong confidence in mid-term FCF generation ability
               FCF
                                               • No material cash tax during investment period; minimum taxation of 12-13% thereafter (due to tax losses carried forward of
                                                 EUR 14.7 billion for corporate income tax and EUR 14.3 billion for trade tax)

                                                •   Maintaining Fitch BBB investment grade rating
                                                •   Strong B/S with low indebtedness; leverage a 1.9x (IFRS 16) as of 30.06.2020
               Leverage1
                                                •   IFRS 16 leverage target: At or below 2.5x; solid headroom under current rating
                                                •   Deferred spectrum payments lead to increased financial flexibility

                                                    • Continuity since the IPO
                 Dividend
                 policy                             • High pay-out ratio to FCF aL
                                                    • Dividend of EUR 0.17/share, which will be a floor during our investment programme in 2020/21

     1   Leverage ratio is defined as net financial debt divided by the OIBDA for the last twelve months adjusted for exceptional effects
                                                                                                                                                                              24
Confirming FY20 revenue & OIBDA outlook while anticipating C/S below 17-18%;
continuously monitoring COVID-19 developments

                                                Outlook FY20                          Mid-term guidance 2020/22                       H1 20

                                                                                                                                     +2.0%           +3.8%1
                                          Flat to slightly positive                                                                          3,636
   Revenue                            (incl. reg. impacts of ~EUR 20-30m)
                                                                                                                             3,564
                                                                                   TEF D with cumulated growth of min. 5%
                                                                                                                            H1’19            H1’20

                                                                                                                                     -1.9%           +2.4%1,2
                                 Broadly stable to slightly positive
    OIBDA2                        (incl. reg. impacts of less than ~EUR 10m)
                                                                                       Ongoing margin improvement            1,106
                                                                                                                                             1,085

                                                                                                                            H1’19            H1’20

                                                                                  2-year investment programme to generate   13.9%            13.1%
     C/S                                             < 17-18%                         growth with C/S (incl. 5G RAN) of
                                                                                               < 17-18% in 2020,
                                                                                                                             496
                                                                                        peaking b/w 17-18% in 2021 &                          475
                                                                                              normalising in 2022
                                                                                                                            H1’19            H1’20

     1 Excl. combined COVID-19 impacts and other non-recurrent special factors.
     2   Adjusted for exceptional effects.
                                                                                                                                                                25
O2D factsheet

  Share price development as of 18 August 2020                                                                         Telefónica Deutschland at a glance1
          O2D             DAX           Sector
                                                                                                                       Market segment                 Prime Standard
    3.0

    2.8                                                                                                                Industry                       Telecommunications
                                                                                                  EUR 2.36    -8.2%
    2.6

    2.4                                                                                                                Shares outstanding             2,974,554,993 shares
                                                                                                              -16.0%
    2.2
                                                                                                                       Share capital                  EUR 2,974.6 m
    2.0
                                                                                                              -2.8%
    1.8                                                                                                                Market cap                     EUR 8,156.2 m
    1.6
     01/20         02/20        03/20      04/20        05/20        06/20       07/20        08/20                    Share price                    EUR 2.742

  Shareholder structure1                                                                                               Regional split of shareholder structure3
          Telefónica Germany Holdings Ltd 2                                                                              UK & Ireland
                                                                                                                                                   6.1%   17.8%
          Freefloat                                                                                                      North America
                                                                                                                                                6.9% 4.5%
                                                                  30.8%                                                  France
                                                                                                                         Germany
                                                                                                                         Continental Europe   17.3%

                                                                                        69.2%                            Scandinavia                               33.0%
                                                                                                                         Rest of World            14.3%

           1 Status: 30 June 2020
           2 Telefónica  Germany Holdings Limited is an indirect wholly owned subsidiary of Telefónica S.A.                                                                  26
           3 Source: NASDAQ; Shareholder ID as of March 2020
Any further questions? Please reach out to us!

           Christian Kern                        Marion Polzer, CIRO
           Director Investor Relations           Head of Investor Relations

           +44 7517 999 208                      +49 176 7290 1221
           christian.kern@telefonica.com         marion.polzer@telefonica.com

       +49 89 2442 1010                          Eugen Albrecht
                                                 Senior Investor Relations Officer
   @   IR-Deutschland@telefonica.com
                                                 +49 176 3147 5260
                                                 eugen.albrecht@telefonica.com

                                                                                     27
Appendix

           28
P&L

Revenue structure (EUR m)                                                                      Underlying OIBDA1 (EUR m)
   Fixed          Handset            MSR           Other revenues                                 OIBDA adj. for exceptional effects   OIBDA-Marge

                                1,865                       1,970            1,846
     1,785                                                                             1,790
                                    185                      189                 193
         185                                                                            193
   281                        318                            432           339          322

                                                                                                     582                  590              619        532     552
    1,319                        1,361                      1,341           1,311      1,275

       1                            1                          8              3         0           32.6%                31.7%            31.4%      28.8%   30.9%
    Q2 19                        Q3 19                      Q4 19           Q1 20      Q2 20        Q2 19                Q3 19            Q4 19      Q1 20   Q2 20

OpEx split2 (EUR m)                                                                            CapEx3 (EUR m)
   Supplies           Personnel expenses                Other
                                                           1,413             1,348
      1,286                      1,317                                                 1,266

                                                                                                                          286              263
                                                                                                     243                                              224     251

      Q2 19                      Q3 19                      Q4 19           Q1 20      Q2 20        Q2 19                Q3 19            Q4 19      Q1 20   Q2 20

              1 Adjusted for exceptional effects
              2 Includes impairment losses in accordance with IFRS 9                                                                                                 29
              3 Excluding additions from capitalised right-of-use assets
Mobile KPIs

 Postpay net adds1 (k)                                                    Prepay net adds (k)
                                                                              3
                                                                                        -3

                                                                                                  -236

                                                443
     357                        367

                                                         188      158                                             -366
                                                                                                          -407
    Q2 19                      Q3 19           Q4 19    Q1 20    Q2 20      Q2 19      Q3 19      Q4 19   Q1 20   Q2 20

 Mobile customer base (k)                                                 LTE customer base (m)
   Postpay ex M2M               Prepay   M2M

   43,218                      43,607          43,827   43,647   43,517

   21,729                      22,096          22,539   22,727   22,885
                                                                                                   24.6    25.2    25.3
                                                                             20.2       20.9
   20,335                      20,332          20,096   19,689   19,323

    1,154                      1,179           1,192    1,230    1,308
    Q2 19                      Q3 19           Q4 19    Q1 20    Q2 20      Q2 19      Q3 19      Q4 19   Q1 20   Q2 20

           1   excluding M2M
                                                                                                                          30
Mobile KPIs

  Postpay ARPU (EUR)                                                                                                                          Prepay ARPU (EUR)

     14.4                          14.4                      14.0                      13.7                       13.3                               5.9                        6.2                        6.1                    5.9                 5.8

    Q2 19                         Q3 19                     Q4 19                     Q1 20                      Q2 20                             Q2 19                      Q3 19                      Q4 19               Q1 20               Q2 20

  Churn rate (%)                                                                                                                              Smartphone penetration (%)1
   O2 postpaid               Total postpaid (ex M2M)                                                                                             O2 consumer postpay               O2 consumer prepay

                                                                                                                 -1.1%                          82.9                       84.1                      87.9                  89.6                90.8
    -1.3%                                                   -1.2%                      -1.3%
                                  -1.4%
                                                                                                                                                           38.6                       39.0                       39.4                   39.5                38.8
                                  -1.5%                     -1.5%                      -1.5%                     -1.4%
    -1.6%
    Q2 19                         Q3 19                     Q4 19                     Q1 20                      Q2 20                              Q2 19                     Q3 19                      Q4 19               Q1 20               Q2 20

            1   Smartphone penetration is based on the number of customers with a smallscreen tariff (e.g., for smartphones) divided by the total mobile customer base less M2M, less customers with a big screen tariff
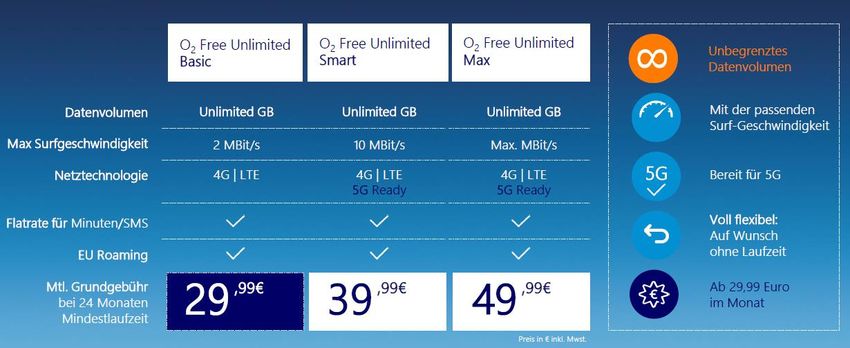
                                                                                                                                                                                                                                                                   31
O2 Free mobile portfolio

                           32
Fixed KPIs

 Retail broadband net adds (‘000)                     Fixed accesses (‘000)
   Therof DSL   Therof VDSL                            Retail DSL     thereof VDSL

      59               53
                               33      36      41
                                                      2,162              2,193           2,207           2,232           2,245
                                                              1,566              1,619           1,652           1,688           1,729
      -21              -22     -20     -11
                                               -28

     Q2 19           Q3 19    Q4 19   Q1 20   Q2 20      Q2 19              Q3 19           Q4 19           Q1 20           Q2 20

 Fixed retail ARPU (EUR)
                              +1.7%

     23.4             23.2    23.1    23.7    23.8

     Q2 19           Q3 19    Q4 19   Q1 20   Q2 20

                                                                                                                                         33
O2 Free fixed portfolio

                          34
You can also read