Investor presentation Telefónica Deutschland - Telefónica Deutschland, Investor Relations Q2 2018

Page created by Ann Griffith
 
CONTINUE READING
Investor presentation Telefónica Deutschland - Telefónica Deutschland, Investor Relations Q2 2018
Investor presentation Telefónica
Deutschland

Telefónica Deutschland, Investor Relations
Q2 2018

Public – Nicht vertraulich
Investor presentation Telefónica Deutschland - Telefónica Deutschland, Investor Relations Q2 2018
Disclaimer
This document contains statements that constitute forward-looking statements and expectations about Telefónica Deutschland Holding AG (in the following
“the Company” or “Telefónica Deutschland”) that reflect the current views and assumptions of Telefónica Deutschland's management with respect to future
events, including financial projections and estimates and their underlying assumptions, statements regarding plans, objectives and expectations which may
refer, among others, to the intent, belief or current prospects of the customer base, estimates regarding, among others, future growth in the different business
lines and the global business, market share, financial results and other aspects of the activity and situation relating to the Company. Forward-looking
statements are based on current plans, estimates and projections. The forward-looking statements in this document can be identified, in some instances, by the
use of words such as "expects", "anticipates", "intends", "believes", and similar language or the negative thereof or by forward-looking nature of discussions of
strategy, plans or intentions. Such forward-looking statements, by their nature, are not guarantees of future performance and are subject to risks and
uncertainties, most of which are difficult to predict and generally beyond Telefónica Deutschland's control, and other important factors that could cause actual
developments or results to materially differ from those expressed in or implied by the Company's forward-looking statements. These risks and uncertainties
include those discussed or identified in fuller disclosure documents filed by Telefónica Deutschland with the relevant Securities Markets Regulators, and in
particular, with the German Federal Financial Supervisory Authority (Bundesanstalt für Finanzdienstleistungsaufsicht – BaFin). The Company offers no assurance
that its expectations or targets will be achieved. Analysts and investors, and any other person or entity that may need to take decisions, or prepare or release
opinions about the shares / securities issued by the Company, are cautioned not to place undue reliance on those forward-looking statements, which speak only
as of the date of this document. Past performance cannot be relied upon as a guide to future performance. Except as required by applicable law, Telefónica
Deutschland undertakes no obligation to revise these forward-looking statements to reflect events and circumstances after the date of this presentation,
including, without limitation, changes in Telefónica Deutschland’s business or strategy or to reflect the occurrence of unanticipated events. The financial
information and opinions contained in this document are unaudited and are subject to change without notice. This document contains summarised information
or information that has not been audited. In this sense, this information is subject to, and must be read in conjunction with, all other publicly available
information, including if it is necessary, any fuller disclosure document published by Telefónica Deutschland. None of the Company, its subsidiaries or affiliates
or by any of its officers, directors, employees, advisors, representatives or agents shall be liable whatsoever for any loss however arising, directly or indirectly,
from any use of this document its content or otherwise arising in connection with this document. This document or any of the information contained herein do
not constitute, form part of or shall be construed as an offer or invitation to purchase, subscribe, sale or exchange, nor a request for an offer of purchase,
subscription, sale or exchange of shares / securities of the Company, or any advice or recommendation with respect to such shares / securities. This document
or a part of it shall not form the basis of or relied upon in connection with any contract or commitment whatsoever. These written materials are especially not
an offer of securities for sale or a solicitation of an offer to purchase securities in the United States, Canada, Australia, South Africa and Japan. Securities may
not be offered or sold in the United States absent registration under the US Securities Act of 1933, as amended, or an exemption there from. No money,
securities or other consideration from any person inside the United States is being solicited and, if sent in response to the information contained in these
written materials, will not be accepted.

                                                                      Public – Nicht vertraulich                                                                   2
Investor presentation Telefónica Deutschland - Telefónica Deutschland, Investor Relations Q2 2018
The Telefónica Deutschland Equity Story:
Becoming the Mobile Customer & Digital Champion

                 Germany           An established player                      Operational excellence                 Value proposition
    An attractive and dynamic      Leveraging economies of scale               Digital transformation drives     Attractive shareholder return on
        telecoms market                                                                    growth                      strong fundamentals

         Excellent macro                Largest owned                         Largest & most modern                 Strong FCF trajectory
                                        customer base                                 network
              Data & device                                                                                       High payout ratio to FCF
                explosion                Multi-brand                            Excellent integration
                                                                                    track record                   Conservative financial
     Dynamic but rational               Multi-channel                                                                     profile
          market                                                                   Digital4Growth:
                                          ADA & IoT                                    SIMPLER
                                       as opportunities                                 FASTER
                                                                                        BETTER

                                                    Consumer                                    Digital4Growth

                                             New Business, Business &                             Network
                                                   Partnering

1 Excluding   regulatory effects

                                                                   Public – Nicht vertraulich                                                       3
Investor presentation Telefónica Deutschland - Telefónica Deutschland, Investor Relations Q2 2018
Strategic priorities of Telefónica Deutschland

                                                                                     We will generate
          SUPERIOR                                                             Superior Shareholder Return
     SHAREHOLDER RETURN                                                  including a strong dividend commitment

               Growth & Value

           MOBILE
     CUSTOMER and DIGITAL                                                     We will become Germany’s
                                                                         Mobile Customer and Digital Champion
          CHAMPION                                                                  by focussing on
       Big Data & Artificial Intelligence                                         CEX & digitalisation
             Products & services

           FOUNDATION                                                          We have strong foundations:
                                                                     Integration success, customer base, outstanding
             Systems Technology                                              connectivity & lean organisation
            Network Technology

                                            Public – Nicht vertraulich                                                 4
Investor presentation Telefónica Deutschland - Telefónica Deutschland, Investor Relations Q2 2018
The German market thesis

                                                                                                                                   6%
                                                                                                        +1.7%
                                                                                                                  83m           Unemployment1
                                                                                                                  Population1
                                                                                                        GDP1

                       Environment
                       Largest 4 to 3 merger in Europe, rational and dynamic market; mobile data usage increase
                       and IoT drive market opportunity with focus on retention and fair market share

                                                                                                         Data & sensors
                                     Device & sensor opportunity: Consumer will mainly buy IoT from an existing relationship

                       Convergence
                       Soft convergence: Limited consumer demand for quadruple play due to large FTA offering;
                       wholesale access to incumbent broadband network

                                                                                        New regulatory environment
                                 Europe needs a common regulatory framework on spectrum, as well as deregulation and a
                                                  consistent framework for OTT & net neutrality to encourage investments
1 FocusEconomics   Consensus Forecast Euro Area (2017)

                                                                           Public – Nicht vertraulich                                           5
Investor presentation Telefónica Deutschland - Telefónica Deutschland, Investor Relations Q2 2018
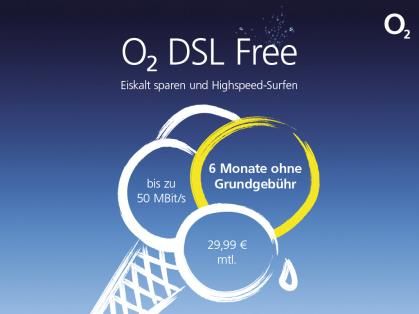
The data & device opportunity:
  Expecting explosive growth
                                                       MARKET TRENDS – German market with significant further growth potential

        Mobile data usage in Europe1                                                               Mobile data traffic in Germany2                                ADA and IoT growth opportunity3
                                                                                                                                                              More than EUR                         More than EUR
                         GB per month                                                                Annual volume of mobile data                             700 million                              5.5 billion
                                                                                                     traffic in million GB                                    Smart Media market                  Digital Advertising
         Finland                             10.95                                                                                                            in Germany                                       spend
                                                                                                                     CAGR
                                                                                                                                                    3,580     by 2020                                    in Germany
          Austria                    6.28                                                                           2016-20
                                                                                                                                                                                    Explosive                by 2021
        Sweden                    4.38
                                                                                                                     +40%                                                            growth
          Poland                3.55                                                                                                                                               of data and
   Switzerland                2.71                                                                                                                                                 connected
          Turkey              2.71                                                                                                                                                    things
                UK          1.84
                                                                                                                                                              More than                                  More than
          France            1.62                                                                      100                                                     500 million                               6 devices
      Germany              1.21                                                                                                                               devices in Germany                          connected
                                                                                                      11 12 13 14 15 16 17 18 19 20                           by 2022                            per person by 2020

1 Forbes/OECD(2017): ‘Mobile Data Subscriptions: Which Countries Use The Most Gigabytes?’
2 Bundesnetzagentur(2017): ‘Jahresbericht 2016’; Analysis Mason (2017): ‘Western Europe telecoms market: interim forecast update 2016-2021’
3 Company Research / Simon-Kucher & Partners analysis (2017) / Cisco VNI Global forecast (2017) / Please note: Devices including cellular, wifi & bluetooth

                                                                                                                 Public – Nicht vertraulich                                                                             6
Investor presentation Telefónica Deutschland - Telefónica Deutschland, Investor Relations Q2 2018
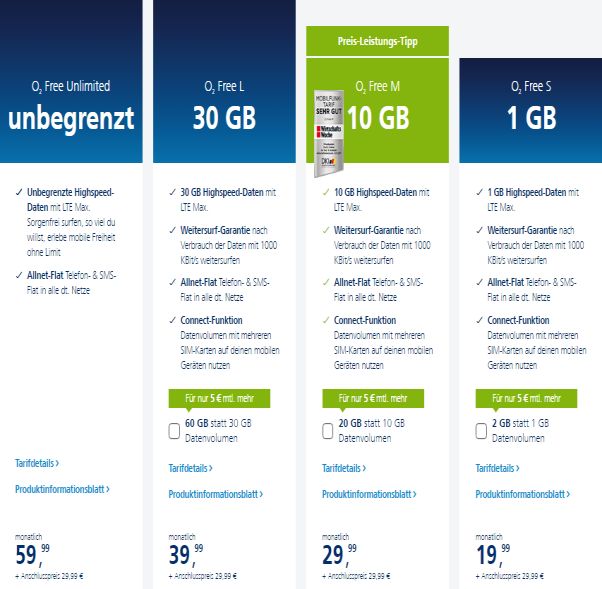
Competitive environment Germany
             Rational and balanced market structure1                                                       Market development in past years
                                                                                                  Mobile market: Service revenues2
                                                                                                  EUR bn

                                                                                                           18.5                                  18.7                                  18.8

                       29%
                                                                    38%

                                                                                                          2015                                  2016                                   2017

                                                                                                  Fixed market: Service revenues3
                                    33%                                                           EUR bn

                                                                                                           27.2                                  27.2                                  27.1

        • Rational market following 4 to 3 consolidation
        • Tiered mobile data portfolios enabling data
          monetisation                                                                                    2015                                  2016                                   2017

1   Market share of MSR based on reported financials by MNOs for Q2 2017                      2 Mobile service revenues (external revenues) excl. hardware revenues; Source: Bundesnetzagentur (German
                                                                                                  national regulator) “Jahresbericht 2017”
                                                                                              3 Fixed service revenues (external revenues) in telecommunications and hybrid fixed coax (HFC) networks excl.

                                                                                                  hardware revenues; Source: Bundesnetzagentur (German national regulator) “Jahresbericht 2017”

                                                                           Public – Nicht vertraulich                                                                                                         7
Investor presentation Telefónica Deutschland - Telefónica Deutschland, Investor Relations Q2 2018
The new Telefónica Deutschland:
Largest and fastest mobile merger in the West

    2 companies
                                                                                           >9,000 Employees
       3 years

 >25%             ~1,600           600                         >25             >14k                  O2
                     FTE
                                                                m                                   Free
 OIBDA growth     Organisation   Shop reduction                Customers       Network sites          First 3G
   in 3 years     harmonised       in 3 years               migrated to one       to be              unlimited
                   in 3 years                               IT stack in 2016   consolidated         First 4G big
                                                                                 by 2019          bucket portfolio

                                       Public – Nicht vertraulich                                               8
Investor presentation Telefónica Deutschland - Telefónica Deutschland, Investor Relations Q2 2018
Core asset: Largest owned customer base of ~35 million

                     BUSINESS                 CONSUMER              Premium

                                                                                                  Service Provider & MVNO1

                                  > 80%                             Non Premium

                                                                                         < 20%
                                                                                          other
                                owned customers
                                                                    Reseller & Ethnic1

1   Not exhaustive

                                                  Public – Nicht vertraulich                                                 9
Investor presentation Telefónica Deutschland - Telefónica Deutschland, Investor Relations Q2 2018
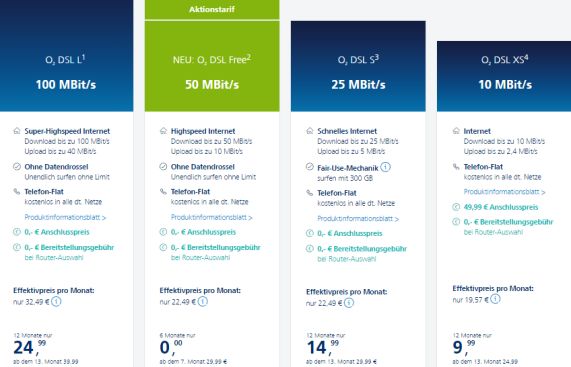
Future-proof portfolios across all segments

                                                      BUSINESS                CONSUMER

                             O2 Free Business/Unite
                                                                                                  Premium
                                  O2 All-IP/VPN

              Service Provider & MVNO1                  MARKET                ARPU
                                                        SHARE
                                                                             CHURN

                                                                                         Non-Premium
                                Reseller & Ethnic1

1 Not   exhaustive

                                                           Public – Nicht vertraulich                       10
On track to achieve FY 2018 outlook with solid trends
                                           Q1 ‘17                              Q2 ‘17                             Q3 ‘17                             Q4 ‘17                             Q1 ’18                             Q2 ’18
                                                                                                                                                                                       (IFRS15)                           (IFRS15)

                                                                                                                    +1.6%                               +0.1%                              +0.4%                             +0.1%
                                             -2.3%                              -1.2%
     REVENUE1                                                                                                                                                                                                                                         -0.3%
                                                                                                                    -1.3%                               -1.6%                               -0.2%                               -0.7%
                                             -4.7%                              -3.4%                                                                                                                                                             IAS 18, excl.
                                                                                                                                                                                                                                                   regulatory
                                                                                                                                                                                                                                                     effects

                                                                                                                                                        +0.8%                              +0.4%                                +0.6%
                                             -0.6%                              -0.4%                               -0.1%
                                                                                                                                                                                                                                                     +0.2%
          MSR1                                                                                                                                                                              -0.4%                               -0.5%
                                                                                                                                                        -1.2%
                                                                                -3.0%                                                                                                                                                            IAS 18, excl.
                                             -3.3%                                                                  -3.6%                                                                                                                         regulatory
                                                                                                                                                                                                                                                    effects

                                                                                +6.5%                               +8.2%                                                                                                      +6.8%
                                            +3.8%                                                                                                       +3.4%                              +5.4%
        OIBDA2                                                                                                                                                                                                                                       +3.7%
                                                                                +5.0%
                                            +2.1%                                                                   +2.1%                               +1.4%                              +1.8%                                +3.2%
                                                                                                                                                                                                                                                  IAS 18, excl.
                                                                                                                                                                                                                                                   regulatory
                                                                                                                                                                                                                                                     effects

                                                                                           Reported                     Revenue                      MSR                          OIBDA

1 Excluding  the negative impact from regulatory changes and y-o-y comparison based on IAS18 accounting standards for 2017 and IFRS15 for 2018.
2   Adjusted for exceptional effects, excl. the negative impact from regulatory changes and y-o-y comparison based on IAS18 accounting standards for 2017 and IFRS15 for 2018. For details please refer to additional materials of the Q2 2018 results release.

                                                                                                                Public – Nicht vertraulich                                                                                                                        11
Building the Mobile Customer & Digital Champion:
Focus on product & service innovation

    Launch of O2 Free Unlimited                                           Launch O2 my All in One
    Launch new O2 Free boost & connect
    Evolution to unique proposition “app-                                 Connect test for fixed product: “good”
     based device management” in the market                                Connect fixed hotline test: “good”
    Boost upsell
    Managing all SIMs (max 10) via my O2 app
    Relaunch Blau postpaid & prepaid

                                           Public – Nicht vertraulich                                                12
O2 Free & DSL portfolio
        2018 O2 Free                                2018 O2 Free connect + boost

                                                   S/M/L tariffs with              feature
        2017 O2 DSL
                                                   Including up to 9 SIMs for devices

                       Public – Nicht vertraulich                                             13
New O2 Free portfolio driving average usage

                             Data growing steadily                                                   Large data buckets fuelling usage growth
Traffic (TB/Q)                                                                        Average data usage for O2 LTE customers (GB/month)                  O2 Free M tariff

                                     +54%
                                                                                                                                                           ~6
                                                                                                                       +69%
                                                                                                                                                                     ~70%
                                                                                                                                                    3.4
                                                                                                                        2.8                2.8
                                                        152                                               2.4
                                      122       126                                      2.0
       99               111

     Q2’17             Q3’17         Q4’17      Q1’18   Q2’18                                Q2’17         Q3’17          Q4’17             Q1’18    Q2’18

  LTE customers (in million)
                  LTE customer base still increasing
LTE customers (in million)
                                                                                        • Music & video streaming driving steady data growth of
                                                                                          >50% y-o-y
                                     +15%
                                                                                        • LTE customer base up 15% y-o-y to 16.6 million

                                                                                        • Average usage of O2 LTE customers up >20% q-o-q
                        15.7          15.8       16.1   16.6
      14.4
                                                                                        • O2 Free M tariff customers use almost 6GB of data

     Q2’17             Q3’17         Q4’17      Q1’18   Q2’18

                                                                Public – Nicht vertraulich                                                                            14
Network consolidation on track:
~75% finalised with major quality improvements

Released cities: Potsdam, Braunschweig, Stuttgart, Münster, Munich and many more

                                               >10k
        >3000 new LTE sites                                         Improved LTE speed
                                                                    (Download up to 225 Mbps
                                            Sites already           and Upload up to 75 Mbps)
                                            switched off

        Improved customer experience                                  Improved voice quality
                                       Refarmed LTE-Bands
                                       800, 1.800 & 2.600 MHz         (VoLTE/ Full HD voice)

The future of our network: Highly competitive and well prepared for future customer demand

                                       Public – Nicht vertraulich                               15
Future-proof spectrum setup to enable best
customer experience
                          Balanced coverage position                      Leadership in capacity spectrum

Potential future            5G          4G          4G                      4G              5G          4G            5G
utilisation
                                                    2G                                      4G

Utilisation today                       4G          2G                      2G              3G          4G

                                                                           2x10

                                                                           2x10

                                                                                            2x20
                                                                                                       2x30
                                                                                            2x15
                                                                           2x25
                                                   2x10

                                                                                                                   1x42
                                                                                                                          1x42
Telefónica Deutschland     2x10        2x10                                2x15                        2x20
                                                   2x10                                     2x10
Vodafone                   2x10        2x10                                                 2x5

Deutsche Telekom           2x10        2x10        2x15                    2x15             2x10       2x20         2x21

Frequencies              700 MHz     800 MHz     900 MHz                 1,800MHz         2,100MHz   2,600MHz     3,500 MHz
Maturity                 2017-2033   2010-2025   2015-2033              2010-2025     2000-2020      2010-2025   2006-2021/22
                                                                        2015-2033     2010-2025

                                                             Public – Nicht vertraulich                                          16
Fixed infrastructure model to complement our mobile
     network for best high-speed experience

                     Access to best available fixed NGA network1                                                                                           Fixed
NGA coverage targets                                                       Maximum speed
(% of covered households)                                                  (Up- & Download, Mbps)

                                                                                Download         Upload
                                                                                                                                    • Access to best available fixed NGA network1

                                                                                           250                                      • Fixed: Access to >31 million VDSL households
                                                                                                       Super
                                                                                                      Vectoring

                          80%                                                              100
                                                                                                                                    • Full convergence capabilities
        74%                               +6pp
        50
       Mbps

                                                                       50                                                                         Mobile fibre backhaul
       100                                                                                       40
       Mbps
                                                                               10
                                                                                                                                    • Fiber backhaul plan as a key enabler for 5G
     H1 2018           2018                                              VDSL              VDSL
                      ambition                                                           Vectoring                                  • Target: >90% fibre in sub-/urban areas
     • Nationwide access to DT NGA network
                                                                                                                                    • Target: >25% fibre in rural areas
     • DT is currently upgrading larger cities to VDSL
       vectoring and 100 Mbps
                                                                                                                                    • Differentiated sourcing model
     • In H2 2018, introduction of Super Vectoring
       with download speed of up to 250 Mbps.
       Available in >30% of households until 2018 YE
 1   NGA: Next Generation Access including VDSL, Vectoring and future FTTX deployments

                                                                                                       Public – Nicht vertraulich                                                    17
MBA MVNO contract economics:
    Four levers for revenue growth

EU-approved capacity glide path
                                                                                                                 >130%
                                   30%                                                                           Data traffic
                                                                                                                since FY20151
Commitment utilised capacity

                                  20%                                                                    Exponential data growth
                                                                                DATA
                                                                                                       Capacity upgrade up to 30%

                                                                                VOICE                  Price tiering based on speed

                                                                                 SMS                 Price tiering based on technology

                                   2015                          2020

         1       Telefónica Deutschland mobile network traffic

                                                                        Public – Nicht vertraulich                                       18
Rational environment in partner business, solid growth
  with performance reflecting retail momentum
 Partner gross add share reflects improving retail trends                                            Partner revenue growth in line with expectations
Postpaid gross adds share             GA retail brands   GA partner brands                    Postpaid partner MSR / Share over postpaid revenue (in %)

                                                                                                      ~22%           ~22%             ~23%                ~23%     ~24%

                                                                                                                                      +5%

      55%              53%    58%          61%               58%

     Q2’17            Q3’17   Q4’17       Q1’18             Q2’18                                    Q2’17          Q3’17            Q4’17            Q1’18        Q2’18
                                                                                                                                                    (IFRS 15)    (IFRS 15)

  • Rational competitive environment in discount segment; focus on fair market share

  • Partner momentum solid; partner gross add share reflects strong retail momentum in Q2

  • Partner revenue growing q-o-q and y-o-y in line with expectations

                                                                        Public – Nicht vertraulich                                                                           19
Transformation programme Digital4Growth, 2019-22

                                 Digital4Growth

                Total case:
                OIBDA benefit by 2022                ~EUR 600m
                       Omnichannel

      SIMPLER       Reduced complexity                      ~25%   Growth-centric case:
                                                                    >60% gross margin
                  Refreshed IT architecture
                                                                          gains

                  Digital speed & processes
      FASTER                                                ~35%
                       Smart growth

                                                                       Building on the
                         ADA & IoT                                 efficiency gains of the
      BETTER
                     Care of the future
                                                            ~40%         integration
                       Shop strategy

                               Public – Nicht vertraulich                                    20
Digital4Growth targets

                 O2 app penetration:                   Tariff detox:         Total IT spend/          Postpaid churn:
       SIMPLER   >80% (vs. 20% 2017)                     ~40%              subscriber: -15%             -2% pts

                 Lead time product                 Manual back-office      Sales in self-assisted    Gross adds market
                     changes:                       interventions:               channels:             share in SME:
       FASTER
                 Within hours                            -80%              >25% (vs. 15% 2017)           ~30%

                 Connected devices/                                                                 IoT revenue upside:
                                                  Share of eCare events:     Shop reduction:
                     customer:
       BETTER                                                                                       ~EUR 200-300m
                   #4 (vs. #1.5 2017)              ~80% (vs. 65% 2017)           >10%                   cumulative

                                        Public – Nicht vertraulich                                                        21
Financial expectations

                                                       2018                                  2019                                   2020                                  2021           2022

                 FY 2018 outlook1                                                                                                     Transformation case
            Revenue: Broadly stable yoy                                                            ~EUR 600m positive gross OIBDA effect by 2022
             excluding a regulatory drag of
                                                                                                    Growth-centric case
             EUR 30-50m
            OIBDA: Flat to slightly positive yoy
             excluding a regulatory drag of                                                                                       Mid-term expectations1
             EUR 40-60m                                                                             Revenue growing in line with German market, capturing market
            Capex/Sales: Approx. 12-13%                                                             share in IoT
            Dividend: Growth over 3 years                                                          Ongoing margin improvement
             (2016-2018)                                                                            Keeping Capex stable
                                                                                                    Dividend: High payout ratio to FCF

1   Telefónica The effects from the implementation of IFRS15 as of 1 January 2018 and IFRS16 as of 1 January 2019 are not reflected in the financial outlook. More information will be
    provided with the quarterly reporting during the period

                                                                                                              Public – Nicht vertraulich                                                        22
Full-year 2018 outlook1
                                                  Actual 2017                                                                 Outlook 2018                                                                            H1 2018

                                                                                                                                                                                                          EUR 3,540 / -0.0%
     Revenue                                                                                                                                                                                         Excl. regulatory effects of EUR 26m
                                                                                                                      Broadly stable y-o-y                                                                  and ex impact of IFRS15
                                             EUR 7,296 million                                               (excl. negative regulatory effects of EUR 30-
                                                                                                                               50 million)                                                               EUR 3,551 / +0.3%
                                                                                                                                                                                                    Based on implementation of IFRS 15
                                                                                                                                                                                                            as 1 January 2018

                                                                                                                                                                                                            EUR 909 / +4.1%
       OIBDA2                                                                                                                                                                                        Excl. regulatory effects of EUR 31m
                                                                                                            Flat to slightly positive y-o-y                                                                 and ex impact of IFRS15
                                              EUR 1,840 million                                                     (excl. negative regulatory effects of
                                                                                                                             EUR 40-60 million
                                                                                                                                                                                                            EUR 927 / +6.1%
                                                                                                                                                                                                    Based on implementation of IFRS 15
                                                                                                                                                                                                            as 1 January 2018

           C/S                                               13%                                                           Approx. 12-13%                                                                              12.0%

                                                      EUR 0.26                                                     Annual dividend growth
                                                   per share
     Dividend                              Proposal for FY 2017 to the                                             for 3 consecutive years                                                                               N/A
                                             AGM on 17 May 2018                                                                       (2016-2018)

1   The effects from the implementation of IFRS15 as of 1 January 2018 and IFRS16 as of 1 January 2019 are not reflected in the financial outlook. For more information, please refer to the materials of the quarterly reporting during the period
2   Exceptional effects such as restructuring costs or the sale of assets are excluded

                                                                                                               Public – Nicht vertraulich                                                                                                             23
Comfortable liquidity position as per 06/2018

                                                    Smooth maturity profile and diversified financing mix (in EURm)
                                                                                                                      EIB
       800
                                                                                                                      SSD                                                Telfisa
                             575                                                                                     Bonds                                              EUR 500m              Bilateral RCFs
                                                                                                                                                                                                EUR 710m
                                                                                                                      Telfisa
                                                                                                                                                     Syndicated loan
                                                                                                                                                                                12%         17%
                   187                                                                                                                              facility EUR 750m
                                              214                                                                                                                                                                      Floating
           117                                                 104                                                                                                      18%                                              33%
                                        75               75                                                               92
                                                                                  3       19              33                        5              Other short term                               27%                                Fixed
                                                                                                                                                                        1%
                                                                                                                                                  Overdraft EUR 54m                                                                  67%
2018 2019 2020 2021 2022 2023 2024 2025 2026 2027 2028 2029 2030 2031 2032 2033                                                                                               13%                         Bonds
                                                                                                                                                                                      11%               EUR 1.1bn
                                                                                                                                                              SSD /NSV
                                                                                                                                                              EUR 550m             EIB
                                                                                                                                                                                EUR 450m

                           Comfortable liquidity position                                                                                                         Leverage ratio at 1.0x1
     (in EURm)                                                                                                                          (in EURm)                                                                      Leverage ratio1
                                                                                                                                                                                                                                   1.0x
                                                                                                     2,135                                      0.6x

                                                                                                                                                                                        +773                    +44
                                                           1,814                                                                                                                                                                  +1.797
                    321                                                                                                                        +1.064            -84

Cash and Cash Equivalents                           Undrawn RCF’s/                                 Liquidity                                Net debt           FCF2 pre               Dividend                 Other           Net debt
                                                     Ext. Overdraft                                                                        31.12.2017         dividends                                                       30.06.2018
                                                                                                                                                            and spectrum
                                                                                                                                                             payments &
 1
                                                                                                                                                              pre M&A
     For definition of net debt & leverage ratio please refer to Q2 2018 earnings release
 2   FCF pre dividend & spectrum payments is defined as the sum of cash flow from operating activities & cash flow from investing activities

                                                                                                               Public – Nicht vertraulich                                                                                                    24
Attractive shareholder remuneration policy

                                                                  Shareholder remuneration policy – Main guidelines1

        Maintain high payout in relation to FCF

        Consider expected future synergy generation in dividend proposals

    Keep leverage ratio at or below 1.0x over the medium term; target
    will be continually reviewed

        Annual dividend growth over 3 years, starting with of EUR 0.25 per
        share 2016; payout of EUR 0.26 for the financial year 2017

1   Refer to the Telefónica Deutschland website for full dividend policy (www.telefonica.de)

                                                                                               Public – Nicht vertraulich   25
O2D Factsheet
                                                                                                                                       Telefónica Deutschland at a glance
          Share price development until 24.08.2018                                                                                     Telefónica Deutschland at a glance
         O2D                 DAX               Euro telco                                                    YTD’18        Market segment                   Prime Standard

4.4                                                                                                                        Industry                         Telecommunications
4.2
                                                                                                             -4.0%         Shares outstanding               2,974,554,993 shares
4.0
3.8                                                                                                          -11.8%
                                                                                                                           Share capital                    EUR 2,974.6 m
3.6                                                                                                          -12.2%
                                                                                                  EUR 3.68
3.4                                                                                                                        Market cap (as of 30.06.2018)    EUR 10,042.1 m
3.2
                                                                                                                           Share price (as of 30.06.2018)   EUR 3.38

            Shareholder structure as of 30.06.20181                                                                              Regional split of shareholder structure4

        Telefónica Germany Holdings Ltd 2                                                                                     UK & Ireland                     4.9%
        Koninklijke KPN N.V.               3                                  24.5%                                           North America                   5.4% 7.3% 25.0%
        Freefloat                                                                                                             France                        5.5% 5.0%
                                                                           6.3%
                                                                                                                              Germany
                                                                                                  69.2%
                                                                                                                              Continental Europe
                                                                                                                                                                    46.9%
                                                                                                                              Scandinavia
                                                                                                                              Rest of World
 1 According to shareholders register as of 30 June 2018
 2 Telefónica Germany Holdings Limited is an indirect wholly owned subsidiary of Telefónica S.A
 3 According to press release of KPN as of 26.07.2018
 4 Source: NASDAQ; Shareholder ID as of October2017

                                                                                                          Public – Nicht vertraulich                                               26
The team: Telefónica Deutschland board members

Markus Haas                Markus Rolle                             Wolfgang Metze                            Alfons Lösing
Chief Executive Officer    Chief Financial Officer                  Chief Consumer Officer                    Chief Partner & Business Officer

Cayetano Carbajo Martín    Guido Eidmann                            Valentina Daiber                          Nicole Gerhardt
Chief Technology Officer   Chief Information Officer                Chief Officer Legal & Corporate Affairs   Chief Human Resources Officer

                                                       Public – Nicht vertraulich                                                                27
Quarterly detail of relevant financial and operating data
for Telefónica Deutschland
                                                                 2017                                   2018
 Financials
                                               Q1         Q2            Q3           Q4       FY       Q1         Q2

 Revenue (excl . regul a tory effects )      1,771     1,771        1,850          1,904    7,296    1,778      1,773

      Mobile service revenues (excl .
                                             1,292     1,318        1,344          1,332    5,287    1,298      1,326
      regul a tory effects )
 Revenue                                     1,771     1,771        1,850          1,904    7,296    1,767      1,758
 OIBDA (pos t Group fees ) adjusted for
                                              401        472         468            499     1,840     422        504
 exceptional & regulatory effects
 OIBDA (pos t Group fees ) adjusted for
                                              401        472         468            499     1,840     408        487
 exceptional effects
 CapEx excl . i nves tments i n s pectrum     208        226         254            262      950      197        228

 C/S Ratio (ba s ed on Revenue)             11.8%     12.8%        13.7%          13.8%    13.0%    11.1%      12.9%

 Revenue and Opex related Synergies           ~35        ~40         ~40            ~45     ~160      ~35        ~30

                                                                 2017                                   2018
 Accesses
                                               Q1         Q2            Q3           Q4       FY       Q1         Q2
 Total Accesses                             49,550    49,907       49,403         47,604   47,604   47,075     47,180
  o/w Mobile                                44,675    45,194       44,842         43,155   43,155   42,777     42,962
    Prepa y                                 23,967    24,289       23,754         21,881   21,881   21,346     21,198
    Pos tpa y                               20,708    20,905       21,088         21,274   21,274   21,431     21,764

                                                     Public – Nicht vertraulich                                         28
Investor Relations contact details

       Dr. Veronika Bunk-Sanderson, CFA                                  Marion Polzer, CIRO
       Director Communications & Investor Relations                      Head of Investor Relations

       +49 176 21028909                                                  +49 176 72901221
       veronika.bunk-sanderson@telefonica.com                            marion.polzer@telefonica.com

                                   Get in touch with us:
                                     +49 89 2442 1010
                              IR-Deutschland@telefonica.com

                                                    @TEFD_IR
                                                    $O2DGR

                                            Public – Nicht vertraulich                                  29
You can also read