GNAM Investment competition 2019-20 KOSPI : Shinhan Alpha REITs - Heewoon Lee Jeongun Shin Seongjae Lim Sangbeom Park Youngha Jang Hyunjung Kim
←
→
Page content transcription
If your browser does not render page correctly, please read the page content below
GNAM
Investment competition 2019-20
KOSPI : Shinhan Alpha REITs

 Heewoon Lee
 Jeongun Shin
 Seongjae Lim
 Sangbeom Park
 Youngha Jang
 Hyunjung Kim

 1
 * All current share price is based on Bloomberg data as of November 1st.
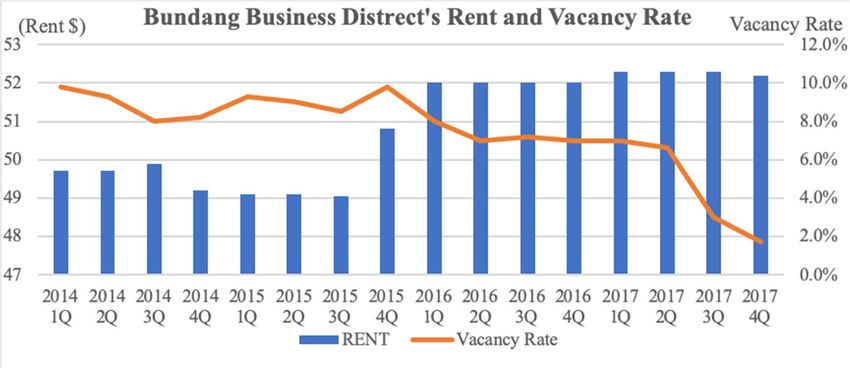
Table of Contents

Introduction…………………………………………………..1

Korea Economy & REITs…………..………………………..1

Company Overview…...……………………………………..1

Outlook…………..…………………………………………..2

Qualitative Valuation….……………………………………..4

Quantitative Valuation…...…………………………………..5

Risks………………...………………………………………..7

Peer Comparison…………………………………….….……8

Conclusion…….……………………………………………..9

Investment Idea Summaries………………………………...10

 EMART(139480:KS)....………………………………….10

 KOLMAR(161890:KS)…..………………………………11

 KSOE(005940:KS) ……………………………………...12

 KT(030200:KS)………………………………………….13

 0
Introduction
 This report consists of five parts. At the beginning, readers are introduced to the Korean
economy followed by a deep analysis of Shinhan Alpha REITs; overview of the company,
valuation analysis including governmental policy supports and potential net value increase,
reasoning for investment, and finally some potential risks that may occur from investment.
Additional discussions about peer REITs companies in the market are included.

Korean Economy & REITs
 The economy of South Korea is the fourth in Asia and eleventh in the world. Reviewing
history, South Korea had a massive rise from one of the poorest countries in the world into a
developed and high-income country. GNP per capital has increased from $87 in 1962 to
$36,612 in 2018. However, South Korea experienced a negative inflation of minus 0.038% for the
first time ever back in July 2019 and its central bank is set to cut its key rate to 1.25% after easing
in July 2019 for the first time in three years. Thus, many are concerned that the Korean economy
is sliding into an initial phase of deflation which brings in sluggish consumption and economic
contraction.

 The fear of Deflation is not the only element that drags down South Korea’s stock market
KOPSI’s performance compare to other countries. Geopolitical factors such as the North
Korean potential threat and South Korean Government’s Policy inconsistencies are recognized
as threats to foreign investors over the South Korean stock market, which is referred to as the
‘Korea Discount’. Nevertheless, narrowing the focus to a certain industry, Public REITs in
South Korea should be very attractive to investors. Public REITs market in Korea still has room
to get its valuation higher as the market has just begun and is in yet early period compared to
those in the U.S. and Japan, which have already saturated decades ago. Moreover, the South
Korean Government’s recent real estate policy plan announcement is solely targeted to
stimulate the growth of Public REITs would be a catalyst to the drastic growth of the Korean
Public REITs market.

Company Overview
 In August 2018, Shinhan Alpha REITs was the fifth Public REITs stock listed in KOSPI.
Shinhan Alpha REITs is derived from Shinhan Financial Group, which has performed a critical
role in developing era in the Korean economy since 1963 and this background implicitly creates
a significant reliability for Shinhan Alpha REITs. Shinhan Alpha REITs Real Estate Asset
portfolio mainly consisted of those owned by Shinhan Financial Group, and strictly focused on
functions ‘for office use’. In detail, “Office Buildings” in the Asset Portfolio show a
significantly lower vacancy rate of 2% (vs. avg. 14.5%), which directly leads to profitability.
In summary, Shinhan Alpha REITs has all the elements that investors expect from Public
REITs; Profitability, Stability, and Cashability. Thus, Shinhan Alpha REITs must be a perfect
pick for investors who intend to create a KOSPI stock portfolio even under the fear of Deflation.

 1
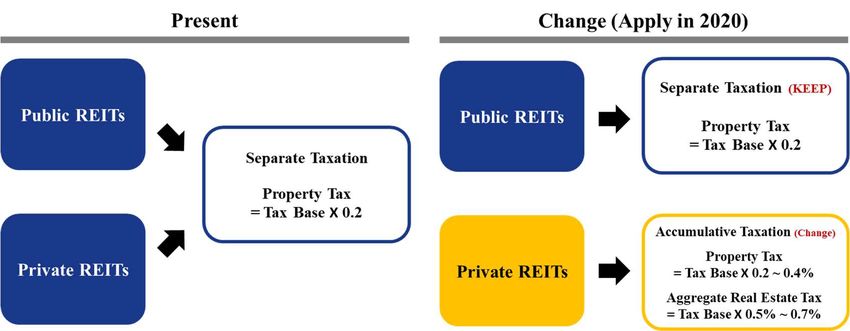
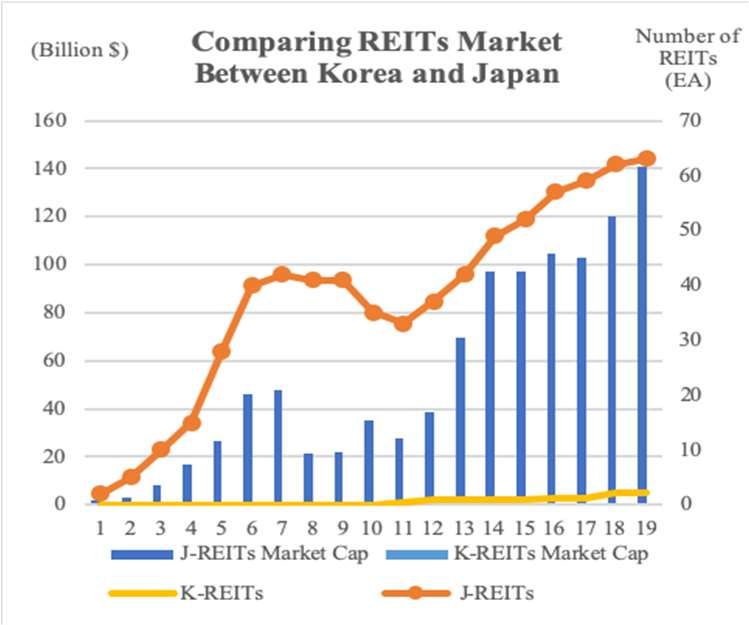
Outlook
1. Public REITs Market Outlook
1) Korea Public REITs market has recently shown extreme growth

 As of November 2019, only 5 public REITs are listed in Korea, including Shinhan Alpha
REITs and EREITs KOCREF with a market cap of approximately 860 billion KRW. Recently,
the Korean government has been emulating Japanese public REITs considering Japan’s similar
demographic and industrial structures. Given that the market cap of Korean public REITs
currently accounts for 0.06% of KOSPI whereas the market cap of Japanese public REITs
accounts for 2.6% of NIKKEI, the Korean public REITs can be expected to grow upwards to
2% within the next 10 years.

2) Governmental Policy Support expected to become a Catalyst for Growth

 In September 2019, the Korean Government announced the ‘Real Estate Indirect
Investment Acceleration’ Legislation Bill. Modeled after Japan’s Public REITs market, the Bill
was developed to create detailed support policies for Korea’s Public REITs market. Under this
new bill, market players will be incentivized with Taxation Benefits: Public REITs will apply
Separate Taxation only on Property Taxation while Private REITs will apply a system of
accumulative taxation through both Aggregate Real Estate Tax and Property tax. Furthermore,
Separate Taxation will be applied on investors’ dividend profits, while corporate tax will be
exempt if more than 90% of possible profits are allocated. In sum, receiving approximately 2%
of tax saving, Public REITs will benefit from not only Tax Savings, but also from priority
access to participate in Public Asset Developments. Overall, these special benefits will function
as huge incentives to encourage market players to participate in the Public REITs market,
resulting in massive growth of Public REITs market in Korea.
 2
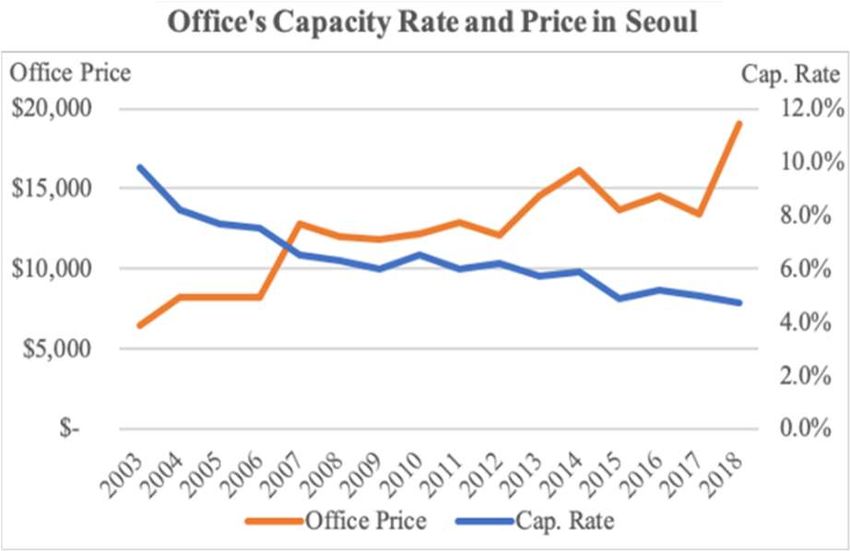
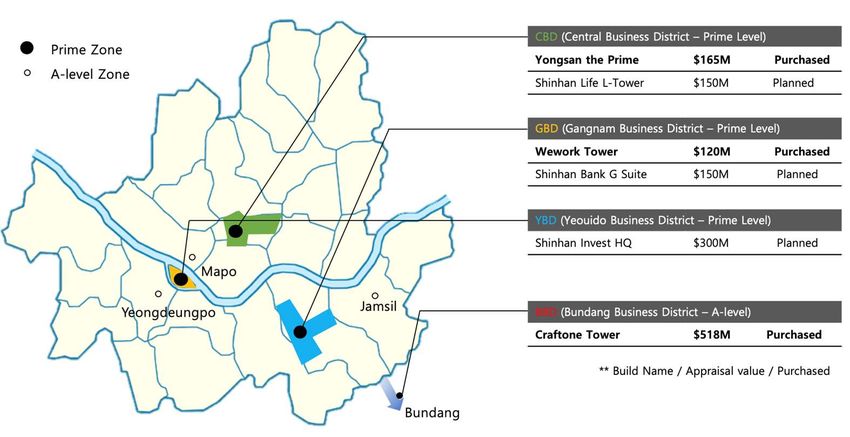
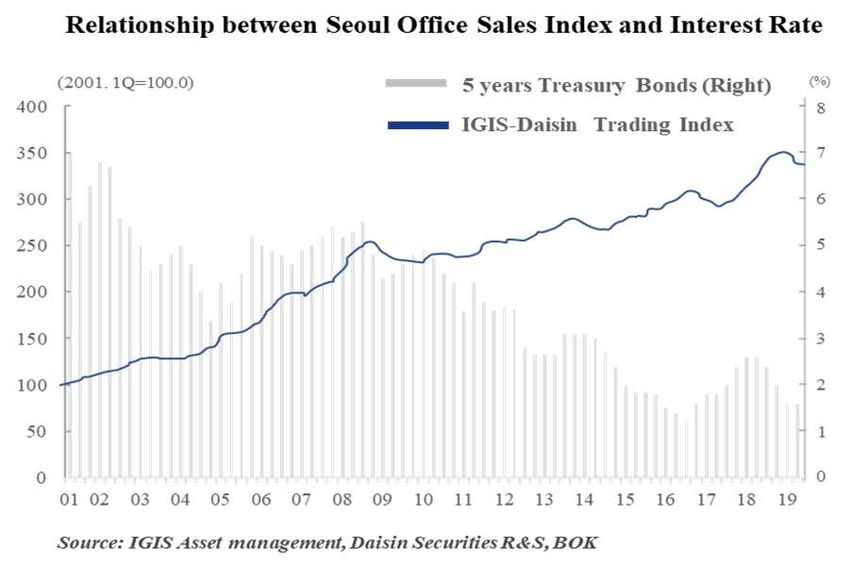
2. Company Outlook
 1) FFO Potential

 Shinhan Alpha REITs’ Asset Portfolio consists of 3 mega office buildings located in
major CBD (=Central Business District) areas inside and outside of Seoul, including Bundang,
Yonsan-gu, Gangnam-gu. While rent levels in these 3 areas are consistently rising, the average
vacancy rate has stayed under 2%. And with the majority of tenants being massive IT
companies with set 10 year contracts, landlords have complete and competitive advantage.
Furthermore, the annual rent rate is contractually set to hike up to 2.5%, no doubt increasing
the FFO consistently and affecting the stock price of Shinhan Alpha REITs positively.

 2) Net Asset Value Potential with Price Increase of Real Estate

 Taking into account Korean economy’s concern with deflation, there will no doubt be a
cut in interest rates. This trend will likely lead the economy to a higher liquidity and lower
lending burden, driving up office real estate prices. Office sales have risen 40.9 percent from
2010 to the first quarter of 2019, while the five-year KTB yield has fallen from 4.69 percent to
1.86 percent. Therefore, Shinhan Alpha REITs, which holds office buildings as its main
portfolio, is expected to see an increase in its real estate market value (=NAV).

 3
Qualitative Valuation 1. Evolution into Growth-type REITs with new assets Shinhan Alpha REITs stands for growth-type REITs, and Shinhan Alpha AMC plans to incorporate assets worth 800 billion KRW in major CBD, Gangnam BD, and Youido BD within the next three years. This incorporation will transform Shinhan Alpha REITs into a growth-type REIT, attracting new investors and thus raising the FFO level in addition to generating additional revenue sources. 2. Expect to concentrate investment funds due to large size of public REITs IPO Current Market Cap. Change IPO Schedule REITs Name Price Price (M$) (%) ($) ($) 2011 Jul A-REITs 2.4 5.5 6.48 18% 2012 Jan K-Top REITS 4.1 5.5 915 -83% 2016 Sept Modu Tour REITs 2.2 6.0 3,050 -49% Done 2018 Jun E-KOCREF 39.8 5.0 7,070 41% 2018 Aug Shihan Alpha REITS 38.1 5.0 8,350 67% 2019 Oct Lotte REITs 1,093.7 5.0 6,340 27% NH REITs 700 - - - Planned In 2019 Shinsegye REITs 700 - - - Igis Asset Management - - - - The increase in the number of publicly listed stocks in Korea’s public REITs market not only enables economies of scale for individual operators to operate REITs, but also raises awareness of Korea as an investment destination for individual investors. 4
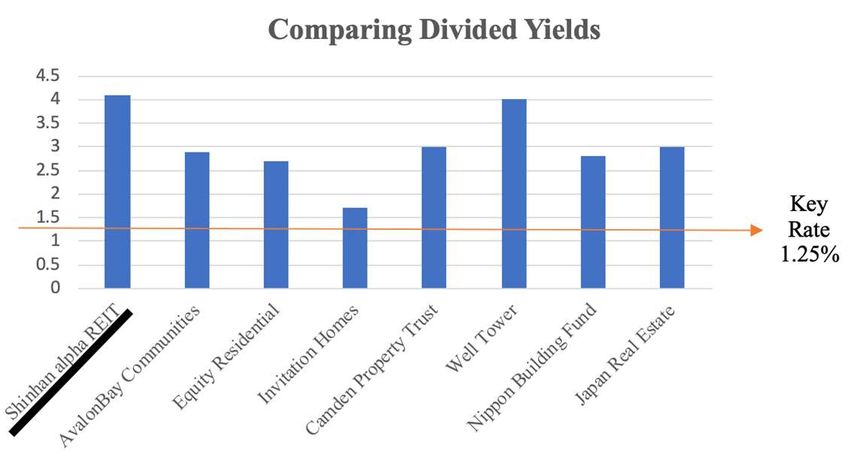
3. Interest in high-dividend products in the low growth phase

 Since Korea’s public REITs are still in their early stages, dividends are likely to increase
through higher rents and the inflow of new rental assets. In particular, Shinhan Alpha REITs
has promised a high dividend yield of 6%, making them more attractive to investors than other
domestic and overseas peers considering the average dividend yield of 5% in Korea and 4% in
both Japan and US.

 Taking into account the attractiveness of Shinhan Alpha REITs, the high dividend and
growth-type REITs, and the rise of the Korean public REITs, valuation can be expected to rise
slightly in the mid-term due to liquidity premium from new investors.

Quantitative Valuation
 Target share price of Shinhan Alpha REITs is calculated using Dividend Discount Model
(DDM). DDM is based on the theory that its stock is worth the sum of all of its future dividend
payments, discounted back to their present value. DDM which utilizes dividend growth rate is
used because REITs is required to pay out dividends; 90% or more of net income available for
dividends according to relevant law.

 Weighted Average Cost of Capital (WACC) of 2.7% is used as a discount rate and growth
rate of Funds From Operations (FFO) and dividend growth rate is 2.5% respectively. Our
model is based on the conservative assumptions listed below.

(Bn KRW, %) 2018A 2019F 2020F 2021F 2022F

Revenue 7.0 43.2 45.8 48.6 53.1
Revenue YoY change n/a 517% 6% 6% 9%
Operation Profit -1.4 24.2 25.3 26.5 28.2
Operation profit YoY change n/a 1829% 5% 5% 6%

 5
(Bn KRW, %) 2019F 2020F 2021F 2022F 2023F 2024F

*FFO(Bn) 16.5 16.9 17.3 17.8 18.2 18.7
No. of shares ('000) 47,630 47,630 47,630 47,630 47,630 47,630

FFO per share(KRW) 346 355 364 373 382 392

Dividend payout ratio as to FFO(%) 100% 100% 100% 100% 100% 100%

Dividend Per Share (KRW) 278 285 292 299 307 315

Discounted Dividend Per Share 278 277 277 276 276 275
Expected share price(KRW) 11,855
*FFO is Funds From Operations generally used as a measure of cash available for dividend pay from REITs. FFO=Net
Income+Depreciation expense-gain or loss on sales of real estate property

 Few of the relevant assumptions/calculations involved in DDM Analysis
 Assumption/Calculation Value Reasons
Rf (Risk Free Rate) 1.56% Based on KR 5year national bond
Rm (Market rate of return) 4.10% Based on the ongoing rate of return
(Beta) – Company share price in Assumption based on data from various
 0.09
comparison with the market financial stock market analysis
Re (Cost of Equity) 1.79% Re = Rf + β (Rm-Rf)
Dividend Yield 3.37% Based on 5-year forecasted data
 Based on growth rate of 5-year forecasted
Constant Dividend Growth Rate 2.5%
 FFO
Rd (Cost of Debt) 3.27% Rate a company pays on its debt
 Corporate Income Tax is exempted for REITs
Corporate Tax Rate (t) 0% company when dividend is paid more than
 90% out of net income available for dividends
WACC 2.70% WACC=(Re x E/V)+(Rd x (1-t) x D/V)

 Considering a WACC of 2.7% and constant dividend growth rate of 2.5% the model
provides a target share price of 11,855 KRW, upside return of 38.3%.

 6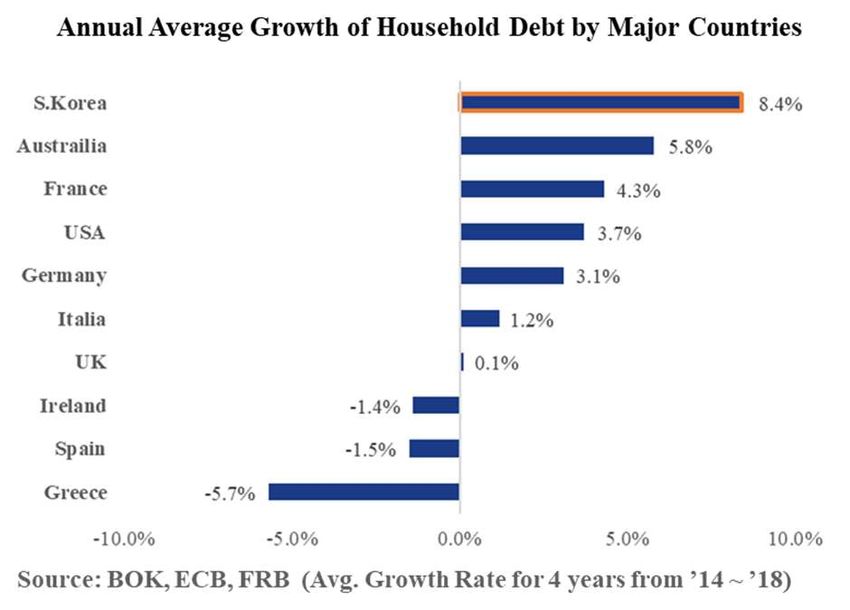
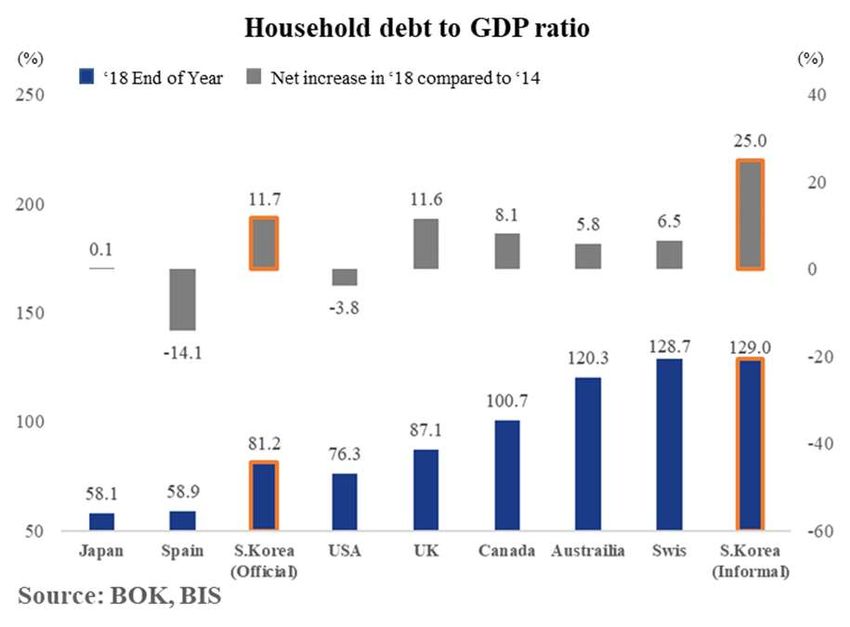
Risks
 As REITs is composed of real estate assets, the bubble in the Korean real estate market is
a risk to be noted. Looking back at the 2008 subprime mortgage crisis, one way to judge the
bubble in the real estate market is to look at household debt. This is because household debt is
an important entity that determines the direction of the real estate market beyond simply bank
insolvency.

 The government's current household debt statistics are based on the narrowest index of
household credit definition (Graph 1, Official). If they use the same criteria as developed
countries do, Korea's household debt is now significantly higher than the GDP (Graph 1,
Informal). In addition, Korea’s household debt is also growing rapidly, the highest level among
OECD countries. (Graph 2)

 Looking at the quality of household debt, the government announced that the share of
long-term loans for mortgage loans for more than 10 years improved to 64.7% at the end of
2017, up from 46% in 2012. For this reason, foreign credit rating agencies such as S&P also
positively evaluate Korea's household debt. However, this figure is also less than 20% when
the statistic criteria includes all kinds of household debt. In addition, a comparison of the rate
of increase in leased loans and the increase in apartment prices suggests that the likelihood of
debt was used to invest in the housing market, which means the Korean real estate market
might be in danger of a bubble.

 Based on these reasons and with a conservative approach, Korea’s household debt is at
the most dangerous level among OECD countries in terms of size and growth. In addition, the
high portion of debt is used for real estate investment, and the high portion of loans with short-
term interest is very dangerous as well. In conclusion, Korea's household debt is at higher risk
than the government's outward indicators, and the bubble in the real estate market is also in
danger. This could pose a potential risk to the Korea’s public REITs market.

 7
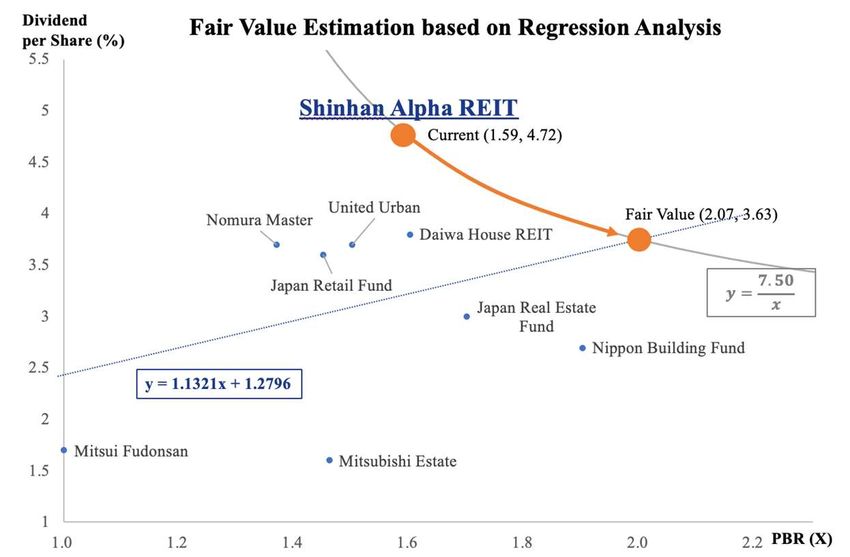
Peer Comparison

 The derivation of Japan’s Public REITs market’s ‘Dividend per Share – PBR relationship’
using the Regression Analysis Methodology is seen below. Since the Korean government
models Korea’s Public REITs market based on Japan’s Public REITs market that has matured
a decade ago, Japan’s Public REITs market is the best point of reference to fully understand
Shinhan Alpha REITs’ fair valuation system.

[Regression Analysis]
 ① Dividend per Share = 1.1321 × PBR + 1.2796

 Under the supposition that Shinhan Alpha REITs’ fundamental capability always be
consumed in marginal level, then Dividend per Share – PBR Combination with current
fundamental capacity would move along the ‘Dividend per Share – PBR Indifference Curve’
as below.

[Dividend per Share – PBR Indifference Curve] **Induce Order be shown in the foot note
 ② Dividend per Share = 7.50 ×

 Thus, the point of intersection between ① Regression Analysis Line and ② Indifference
Curve cross each other, forms Shinhan Alpha REITs’ Fair Value. And from these combinations,
the price range between Fair Current Price and Value Range can be calculated as below.

 Current Value Combination ( , ) = (1.59, 4.72)
 Fair Value Combination ( , / ) = (2.07, 3.63)

 Current Price = (PBR, Div/Share) = (1.59, 4.72) = 8,570 KRW
 Fair Value Price = (PBR, Div/Share) = (2.07, 3.63) = 11,157 KRW

 Current Price ~ Fair Value Price : 8,570 ~ 11,157 KRW (Upside 30.1%)

 Fair Value Price calculated above 11,157 KRW has only 5.7% of difference from the
Target Price of 11,855 KRW derived from DDM model in Quantitative Analysis.

 8
Conclusion
 We suggest BUY. Based on our Company outlook, Peer Comparison, Qualitative and
Quantitative (DDM analysis based on sustainable dividend growth model) analysis, we are
convinced Shinhan Alpha REITs is seriously undervalued at this moment. We expect a target
price of 11,855 KRW. This in an upside of 38.3% from the current share price of 8,570 KRW.

** Inducing ‘Dividend per Share – PBR Combination’ indifference Curve.

 =

 =

 = × ℎ

 If price is fixed, price equation would substitute to Dividend Yield equation.
 The equation will be as below.

 = ×

 Then, will be shown as slope.

 stands for PBR and shows Dividend Yield in the graph, so = ( )

 9
EMART [139480:KS] Recommendation
 BUY

 Target Price
 150,000
 Market Overview
 Bloomberg Consumer
 139480:KS Sector
[Overview] Code Staples
 E-mart is Korea's leading distribution company with 148 Upside Present
 32.15% 113,500
hypermarkets nationwide (M/S 26.2%). Started as a food Return Price
material mart, the company has been focusing on 30 Day
warehouse type discount stores with Costco's business MarketCap 3.164T 148,091
 Avg Volume
model since 2015.
 52wk 104,500 ~
 52wk Beta 0.88
 Price Range 213,000
[Financial Analysis]
 In 2019, revenue is estimated to be 19,092bn KRW from Peers P/E P/B EV / EBITDA
17,049bn KRW last year (+12% YoY), while operating
 Emart 7.03 0.39 9.18
income fell from 470bn KRW to 230bn KRW(-51.1% YoY)
due to higher expenses. In 2Q19, EBITDA shows a slight Lotte
 N/A 0.30 8.56
 Shopping
increase to 528bn KRW(+1.8% YoY), but overall
profitability declined due to lower sales at discount stores, Shinsegye 9.70 0.67 9.92
and temporary financial stability deteriorated due to BGF Retails 20.12 5.93 11.3
expenses for acquisition of Good Food Holding. (Net debt
-2.7% YoY)

[Recent Development]
 1) No.1 E-commerce Firm in Crisis: Coupang, which
benchmarked Amazon’s business model is currently the
top online retail company backed by SoftBank Vision
Fund's financial power. However, Coupang has seen
deficits of 1 trillion KRW and needs to increase its capital
with FSS’s recommendation. This will be the biggest
opportunity for E-Mart which has completed its e-
commerce system.
 2) Rebuilding Logistics Infrastructure to dominate E- (Bn KRW) 2018A 2019E 2020E
commerce Market: E-Mart has improved the delivery
 Revenue (bn KRW) 17,049 19,092 20,246
efficiency and SKUs with the launch of its online platform
SSG.com in 2017. Last year, it introduced an automated Operating Profit (bn KRW) 471 230 312
system and boosted its GPM by 1.5%. With slow growth of Net Income (bn KRW) 450 190 249
online-only platforms, E-Mart will generate profits in the
online fresh food market thanks to its unique advantage of EPS (KRW) 15,668 6,805 9,015
having both online and offline stores. EPS YoY Change(%) -27.5% -56.6% 32.5%
 PER(X) 7.03 N/A N/A
 [Valuation]
 As online retail market is expected to grow 17% YoY, we EV/EBITDA(X) 9.18 N/A N/A
suggest BUY and expect target price of 150,000 KRW, PBR(X) 0.39 N/A N/A
upside return of 32.15%.
 ROE(%) 5.32 N/A N/A
 Dividend Yield(%) 1.76% N/A N/A

 1
KOLMAR [161890:KS] Recommendation
 BUY

 Target Price
 64,250
 Market Overview
 Bloomberg Consumer
 161890:KS Sector
[Overview] Code Staples
 Kolmar Korea’s main business is R&D and Upside Present
 37.13% 46,850
manufacturing of cosmetics and pharmaceuticals, and it Return Price
generates revenues with general and functional cosmetics. 30 Day
It is the leading company in the cosmetics OEM/ODM Market Cap 1.072T 216,136
 Avg Volume
industry.
 52wk 39,100 ~
 52wk Beta 0.92
 Price Range 83,500
[Financial Analysis]
 Revenue in 2019 will be increased to 1,587bn KRW from Peers P/E P/B EV / EBITDA
1,358bn KRW last year (+16.9% YoY), and operating
 Kolmar 23.98 2.39 21.94
income will also be up to 137bn KRW from 90bn KRW
(+52.1% YoY). In 2Q19, ROE has been increased to 16.3% Amore Pacific 40.72 3.06 17.85
from 14.7% in 2Q18, showing an improvement in
 LG Health Care 32.65 6.22 15.65
profitability.
 Cosmax 24.00 2.95 22.58
[Recent Development]
 1) Resolving boycotts: The domestic cosmetics business
sales fell to 1,457bn KRW (-17.7%), and the domestic
cosmetics industry slowed down. The company's high base
effect and a boycott issued last August. The company's
sales are expected to decline in the next quarter due to the
impact on the company.
 2) Growth recovery in China, US and Canada market:
Some of the Beijing plant's shipments to the Wuxi plant,
which was completed last year, have been mostly
completed, and new customer orders are expected to
increase 87.8% QoQ to 9.2bn KRW. As a result, China's
combined sales should also turn to positive growth (+9.8% (Bn KRW) 2018A 2019E 2020E
YoY). The US and Canada markets are also expected to
 Revenue (bn KRW) 1,358 19,092 20,246
maintain steady earnings with sales of 22.2bn KRW(+4.3%
YoY). Operating Profit (bn KRW) 90 137 158
 Net Income (bn KRW) 42 57 73
[Valuation]
 Sales growth has deteriorated sharply due to multiple bad EPS (KRW) 1,921 2,520 3,144
news reports, but the share price is expected to rebound on EPS YoY Change(%) -12.7% 31.2% 24.8%
a gradual recovery by the end of the year. The target price
 PER(X) 23.98 N/A N/A
is estimated at 64,250 KRW, with an upside return of
37.13%. We suggest BUY. EV/EBITDA(X) 21.94 N/A N/A
 PBR(X) 2.39 N/A N/A
 ROE(%) 11.38 N/A N/A
 Dividend Yield(%) 0.70% N/A N/A

 2
KSOE [009540:KS] Recommendation
 BUY

 Target Price
 170,000
 Market Overview
 Shipbuilding/
 Bloomberg
 009540:KS Sector Transportation
[Overview] Code Equipment
 KSOE is an intermediate holding company of Hyundai Upside Present
 36.5% 118,000
Heavy Industries Group. Hyundai Heavy Industries, Return Price
Hyundai Mipo Dockyard, and Hyundai Samho Heavy 30 Day
Industries, which are affiliated with KSOE, maintained Market Cap 8.351T 177,976
 Avg Volume
global No.1 position for more than 40 years.
 52wk 93,800 ~
 52wk Beta 0.97
 Price Range 146,000
[Financial Analysis]
 At the end of 2018, KSOE maintained a robust balance Peers P/E P/B EV / EBITDA
sheet with cash and cash equivalent of 4,287bn KRW, and
 KSOE N/A 0.79 N/A
net asset value per share of 185.4. It is expected that
revenue will increase to 14,853bn KRW in 2019 from Samsung
 N/A 0.61 N/A
 Heavy Industry
13,120bn KRW last year (+13.2% YoY), and operating
income will be 1,081bn KRW from 357bn KRW (+203% DSME 10.61 0.95 5.53
YoY).

[Recent Development]
 1) Clear Earnings Momentum: As order backlogs are
showing a turnaround, the company's allowance in
construction contract ratio continues to fall from 6%
(2Q18) to 0.7% (2Q19). In 4Q19, Korean shipbuilders
have recently recorded high-quality orders for LNG-
operated crude oil carriers, which are estimated at $1.1bn,
15% higher than existing crude oil carriers' price of $96M.
Therefore, the overall profit level is expected to be high
with no allowance.
 2) Increasing demand for LNG carriers: IMO2020, a new
regulation for a 0.5% global sulfur cap for marine fuels, is (Bn KRW) 2018A 2019E 2020E
expected to drive up the LNG carrier market. LNG carriers
 Revenue (bn KRW) 13,112 14,853 16,757
can be a long-term alternative because they are free from
scrubber problems. In addition, CO2 emission regulations Operating Profit (bn KRW) -523 149 367
in 2025 cannot be matched with scrubbers. Thus, Net Income (bn KRW) -489.1 247.6 286.1
continuous environmental regulations are the reason for
choosing LNG carriers. With a unique competitive edge on EPS (KRW) -7,855 2,934 3,406
LNG carriers, Korean shipbuilders won 73% of the world's EPS YoY Change(%) -118% -137% 16%
LNG orders. As the market grows, KSOE will benefit
 PER(X) N/A N/A N/A
greatly.
 EV/EBITDA(X) N/A 10.6 11.5
[Valuation] PBR(X) 0.76 0.72 N/A
 In terms of fundamentals, KSOE is expected to turn to
 ROE(%) -4% N/A N/A
surplus year-over-year in 2019 (+12.7% YoY) and sound
order flow. We suggest BUY with the target price of Dividend Yield(%) N/A N/A N/A
170,000 and an upside return of 36.5%.
 3
KT [030200:KS] Recommendation
 BUY

 Target Price
 38,000
 Market Overview
 Bloomberg Telecommun-
 030200:KS Sector
[Overview] Code ications
 KT provides telecommunications and media services such Upside Present
 42.9% 26,600
as landline, wireless, high-speed internet, and IPTV. Its Return Price
market share is 80.7% for local calls, 31.7% for mobile 30 Day
phones, 40.9% for high-speed Internet, and 46.8% for Market Cap 6.946T 452,118
 Avg Volume
IPTV.
 52wk 26,500 ~
 52wk Beta 0.06
 Price Range 31,250
[Financial Analysis]
 KT’s sales in 2019 will grow up to 24,221bn KRW from Peers P/E P/B EV / EBITDA
23,460bn KRW in 2018 (+3.2% YoY), however, its
 KT 11.3 0.55 2.65
operating income will decrease to 1,166bn KRW from
1,262bn KRW (-7.6% YoY) due to higher SG&A expenses. SK Telecom 6.96 0.89 6.44

 LG Uplus 16.00 1.12 4.26
[Recent Development]
 1) Growth of 5G Subscribers: 5G service subscribers are
growing faster than expected. As of end-August, KT's 5G
subscribers accounted for 86.5mn, with 5G market share
with 31%. KT's 5G subscribers at end-3Q are estimated at
1.09mn, up 670,000 from 420,000 at end-2Q.
 2) Upward Trend in Wire/Wireless ARPU: With increase
of 5G subscribers, the wireless ARPU has rebounded from
2Q19. In addition, 5G service is expected to stabilize as
network coverage and indoor repeater investment will be
completed to some extent. Moreover, IPTV sales are
increasing every year with estimates of 2.2 trillion in 2019
(+13% YoY). Also the number of IPTV subscribers and
ARPU are on the rise (+6%, +20% YoY respectively).
 3) Share Prices Bottomed out due to High Dividend (Bn KRW) 2018A 2019E 2020E
Attraction: KT has the highest dividend payout ratio
 Revenue (bn KRW) 23,460 24,221 24,888
among the three telecom companies. The company is
expected to pay dividends of 1,100 KRW per share in Operating Profit (bn KRW) 1,262 1,166 1,296
February next year, and the dividend yield is estimated at Net Income (bn KRW) 689 665 781
more than 4%. Considering this, we believe KT stock has
bottomed out. EPS (KRW) 2,809 2,561 3,004
 EPS YoY Change(%) 44% -9% 17%
[Valuation]
 PER(X) 11.3 N/A N/A
 We suggest BUY with the target price of 38,000 KRW.
The target price was derived by applying EV/EBITDA of EV/EBITDA(X) 2.65 N/A N/A
2.6x. We forecast operating revenue of 23.99tr KRW(2.2% PBR(X) 0.55 0.52 N/A
YoY) and operating profit of 1.96tr KRW(-5% YoY). The
 ROE(%) 6% N/A N/A
wireless business is expected to grow, reaching 6.89tr
KRW (+1% YoY). Dividend Yield(%) N/A 4.14% N/A

 4
You can also read