GROWING IMPORTANCE OF THE CLOSING AUCTION IN SHARE TRADING VOLUMES - OCTOBER 2019
←
→
Page content transcription
If your browser does not render page correctly, please read the page content below
OCTOBER 2019

GROWING IMPORTANCE OF THE
CLOSING AUCTION IN SHARE TRADING
VOLUMES

FRANCK RAILLON

                      Risk and
                      Trend

                        Risk & Trend Mapping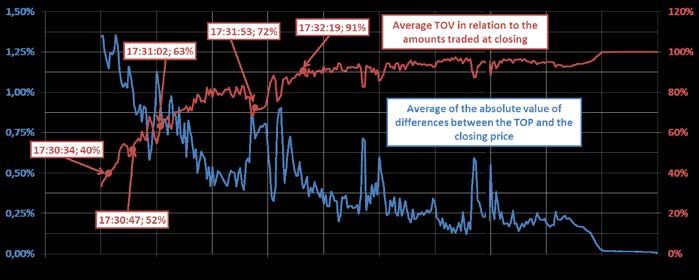
GROWING IMPORTANCE OF THE CLOSING AUCTION IN SHARE TRADING VOLUMES

The increasing concentration of share trading volumes at the end of the day is a phenomenon that can
be witnessed to varying degrees on all the main markets worldwide. However, France is one of the
markets on where this trend has reached the highest levels, with close to 41% of CAC 40 volumes traded
at the closing auction on Euronext Paris in June 2019. This rate is well above the 12%-14% level seen in
the United States.
Several factors could account for this phenomenon:
   • The rapid growth in passive management, for which unit creation and cancellation generally
        takes place at the end-of-day liquidation value and for which a precise replication entails trading
        at the closing price;
   • The obligation of “best execution” and especially reporting obligations of the “Trade & Cost
        Analysis” type to which fund managers have been subject since the application of MiFID II. By
        trading at the closing auction, this type of reporting becomes superfluous;
   • A move to avoid HFTs arbitrageurs, who rarely get involved in the closing auction phase;
   • Lastly, the role of execution algorithms, which have amplified the above factors, since liquidity
        attracts liquidity.

The study also describes the price formation process during the closing auction phase and shows that,
while volumes and prices converge rapidly towards their final level during the first half of the order
accumulation phase (90% of the volumes traded are already present in the order book with an average
price differential of 0.30%), final convergence takes place in the last 15 seconds of the auction.
Finally, this change in market structure is accompanied by the emergence of certain risks, in particular
an increased exposure to operational incidents, which could occur during this very brief phase, and lower
levels of liquidity in the rest of the session.

                                                                                                     -2-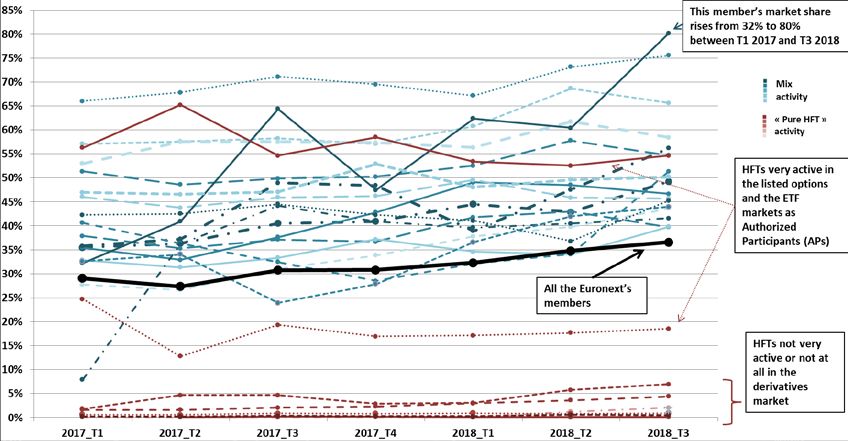
1. HIGHER CONCENTRATION OF VOLUMES AT THE END OF THE DAY

The increasing share of the closing auction in trading volumes of lit platforms 1 is a phenomenon that can be
observed on all European and American markets.

1.1. IN FRANCE

The proportion of Euronext volumes traded at the closing auction has grown spectacularly since 2016: after ranging
between 20% and 28% for a long time until 2015, this proportion started growing from 2016 and reached around
41% in June 2019 for CAC 40 shares.

This phenomenon can be witnessed for all Deferred Settlement Service (SRD) shares (i.e. big and mid caps), but is
less apparent for small caps, whose share of the closing auction varies without an apparent trend between 10%
and 15%.

For CAC 40 shares, main focus of this note, the share of the opening auction is on average about 1% and roughly
constant over time. Most of the observed increase is therefore due to the closing auction.

                   Percentage of the auctions in the trading volumes on CAC 40 shares on Euronext Paris
                                                   (from 2013 to Q2 2019)

                                                    Source: AMF statistics

In a given quarter, the auction share for end-of-quarter months (March, June, September and December) is about
4% to 6% higher than that observed for the other months. This is mainly due to the fact that these months
correspond to the expiry of so-called "quarterly" derivatives, i.e. those for which the open interest positions are
largest 2. This difference is most pronounced in the fourth quarters.

1
  Lit platforms commonly refer to markets where the order book is displayed to the market participants (i.e. pre-trade
transparent) as opposed to dark pools.
2
  Option hedging transactions by market makers are most significant as the expiry date approaches. The extra volume can be
seen at the auction because market makers traditionally hedge their option positions at this time (for liquidity and to be in line
with historical volatility calculations). For equity futures, the extra volume can be seen mainly at the auction on the day of

                                                                                                                           -3-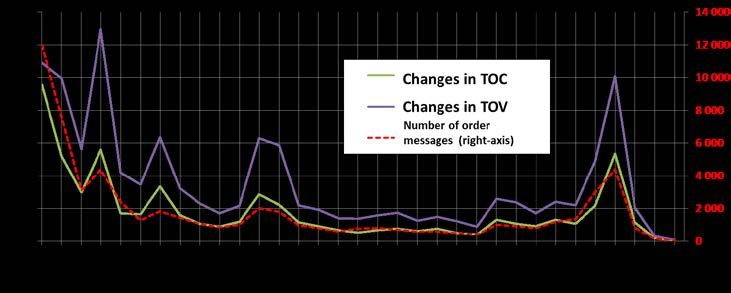
The chart below shows the daily market share of the closing auction as a function of trading volumes. We note
that:
• The days on which quarterly derivatives expire are not only amongst the most active days, they are also
the days on which the share of the closing auction reaches its highest level (see red dots).
• The MSCI indices rebalancing days, which occur on the last trading day of the months of February, May,
August and November, are also amongst the most active days in terms of volumes traded (to a lesser
extent than for the quarterly expiry dates), and are the days on which the share of the closing auction
reaches its highest level (since the passive funds replicating these indices perform their rebalancing
precisely at the closing auction) (purple dots).
• In the other end-of-month sessions, the share of volumes at the closing auction is still at its highest level
compared with the sessions in the past month (see appended chart), but in volumes which are not always
larger than on the other days.
• In contrast, on days of high volatility and large volumes (e.g. start of February 2018 and around the first
round of the French presidential elections), the share of the closing auction is generally lower than the
average on the other days.
Auction share on CAC 40 shares as a function of the amounts traded during the day 3
€Bios
Source: AMF statistics, for all CAC 40 shares in 2017 and 2018.
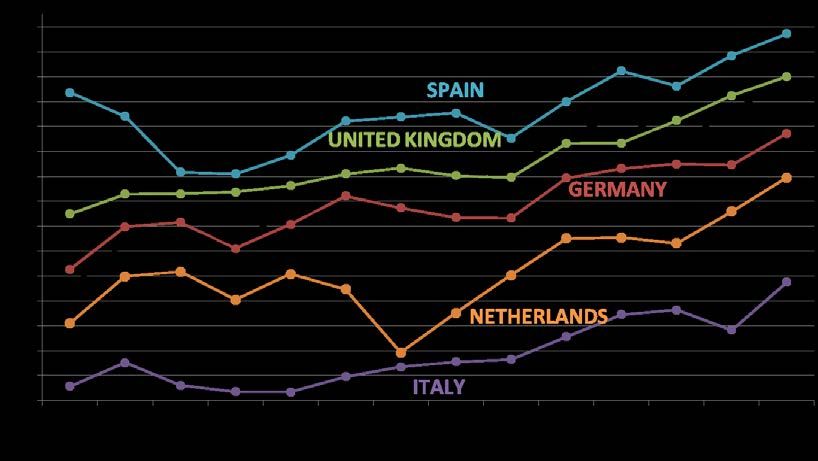
1.2. A PHENOMENON AFFECTING ALL EUROPEAN MARKETS
The constantly increasing share of volumes traded at the closing auction is a mainstream trend that can be seen
on all the main European markets, as shown by the chart below. Note, however, that the market share of auctions
in Spain is structurally high (44% in Q2 2019), whereas for the Italian market, it is structurally lower (24%), but
increasing sharply. Historically, the French market lay within or around the European average, but, over the past
two years, the closing auction share on this market has posted particularly strongly increases.
expiry, because futures hedging is unwound in such a way as to replicate the final clearing price. However, the settlement price
of index futures is calculated during the continuous phase (e.g. between 15h40 and 16h00 for CAC 40, between 11h50 and
12h00 for Euro Stoxx 50) and the transactions that aim at replicating the settlement price increase the volumes of the
continuous phase but to a lesser extent.
3 Another representation is given in the appendix, but for 2017 only.
-4-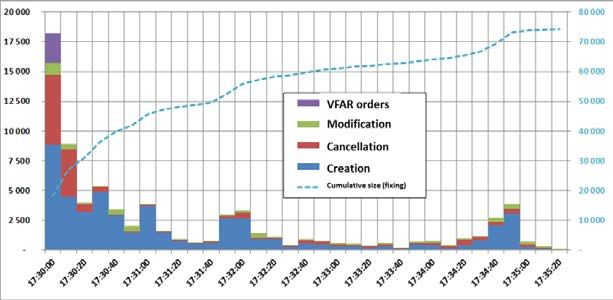
Auction share on equities 4 in the main European markets
                                          (on the historical stock exchanges only 5)

                                                      Source: Refinitiv

One factor explaining the differences observed from one country to another could be related to the weight of the
major indices on domestic markets. In particular, the Euro Stoxx 50 Index is the most frequently replicated index
in Europe by passive management, whose impact is particularly important at the closing auction (cf. section 2.1).
Accordingly, the smallest closing auction market shares are found in those countries where domestic stocks
included in the Euro Stoxx 50 have the smallest weight relative to their domestic market (they account for less than
33% of the Italian and Dutch indices), whereas in Germany, France and Spain, their weight ranges between 54%
and 59%.

However, we are not aware of any factor that could explain the more pronounced upward trend on the French
market when compared with other European markets.

1.3. COMPARISON WITH THE US MARKET

On the US market, the volumes traded at the close have also been constantly rising since 2010: after reaching 8%
in 2017 as shown in the chart below, this share is estimated between 12% and 14% of the daily volumes in 2019.
However, those figures are not necessarily comparable to those provided by the European markets mentioned
above, although the trend is, in theory, reliable 6.

4
  All the equities traded on the platform are included here. Earlier, only the CAC 40 shares traded on Euronext Paris were taken
into account.
5 Euronext Paris for French securities, Xetra for the German market, etc.
6 This figure of 8% is taken from a study conducted by Crédit Suisse and mentioned in the Financial Times. Its methodology is

not described in detail and possibly includes the volumes traded on all the platforms, thus diluting the share of the closing
auction relative to the volumes for the incumbent NYSE and NASDAQ platforms alone. The estimated share of 12%-14% stems
from an analysis from Goldman Sachs quoted by Financial News.

                                                                                                                         -5-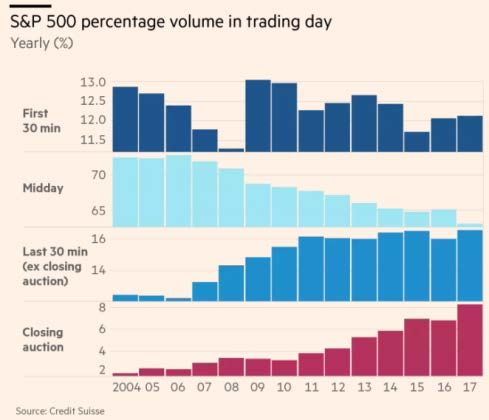
Share of trading volumes on S&P 500 shares according to the time of day

                                   Source: Crédit Suisse (via the Financial Times)

While the increase in the share of the closing auction in the United States has gone hand-in-hand with an increase
in the share of the last half-hour of the session, this relationship is not found in France. The following chart shows
that the increase in the share of the closing auction has taken place at the expense of the day as a whole, including
the last half-hour of trading 7. Paradoxically, the occurrence of these contrasting phenomena in these time slots
may be explained by a common cause: the rapid development of passive management (cf. Section 2.1).

                                Change in the share of volumes traded on CAC 40 shares
                                 according to the time of day (by 30-minute time slots)

    Opening                                                                                         Closing

                                                Source: AMF statistics

7
 Volumes traded outside the closing auction decreased by 75% to 60% between Q1-2016 and Q3-2018, corresponding to a
20% decline. Volumes in the last 30 minutes dropped by exactly the same proportion, from 8.15% to 6.45%. The phase
suffering the sharpest decline is between 2.30 pm and 3.00 pm (-33%), before the convergence of the EU and US markets
preceding the US opening increases the number of trades between 3.00 pm and 3.30 pm.

                                                                                                                  -6-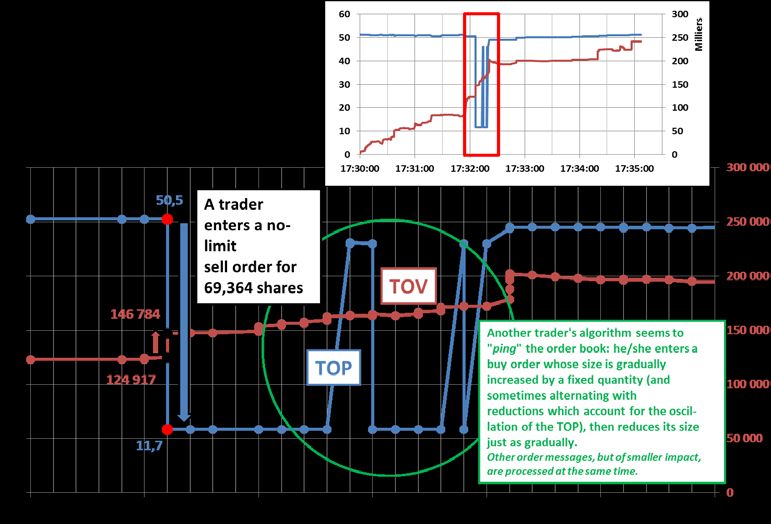
2.    CAUSES OF THE PHENOMENON

2.1. RAPID DEVELOPMENT OF PASSIVE MANAGEMENT

The increase in the closing auction share of trading volumes on European platforms is probably mainly due to the
rapid development of passive investing, notably the ETF. Unit creation/cancellation transactions are executed
when the NAV of funds is established at the end of the day. In Europe, since these transactions between issuers
and Authorized Participants ("APs") are carried out in the cash market, every participant must perform a hedging
transaction on the ETF's component basket at the closing auction in order to replicate the NAV precisely, thereby
increasing its volumes 8.

                                       Percentage ofpassive funds in equity funds assets

In contrast, unit creation/redemption transactions in the United States take place mainly in kind, i.e. as a swap for
the exact basket of securities. As a consequence, the APs are not obliged to unwind their hedge at the closing
auction, because they can transfer it to the issuer 9.

Therefore, the rapid development of passive management is likely to be a major reason why the auction market
share has increased substantially in Europe over the last two years, and to a lesser extent in the United States.

2.2. BEST EXECUTION

The entry into force of MiFID II in January 2018 increased fund managers' Trade & Cost Analysis 10 obligations
concerning the reports to which the client is entitled. Trading at the closing auction greatly facilitates these
regulatory matters and might lead certain fund managers (or any market participants subject to Best Execution
requirements) to trade accordingly, since the closing auction offers a single simple reference price.

8 The APs/market-makers do not hedge their exposure to an ETF with an exact replication of the basket of securities on an
intraday basis. They are more likely to use proxies such as futures, combinations of futures or otherwise a selection of securities
imperfectly replicating the performance of the ETF's underlying index.
9 APs are subject to the major constraint of having to replicate the basket of securities. However, since the intraday hedge is

probably generated on the basis of a proxy, its conversion into a perfect basket requires a precise adjustment of the position:
according to the Financial Times, the last half-hour of trading is apparently the period preferred by APs for carrying out these
arbitrage transactions with less recourse to the closing auction.
10 TCA: estimation of transaction costs and market impact in order to analyse execution quality and performance.

                                                                                                                            -7-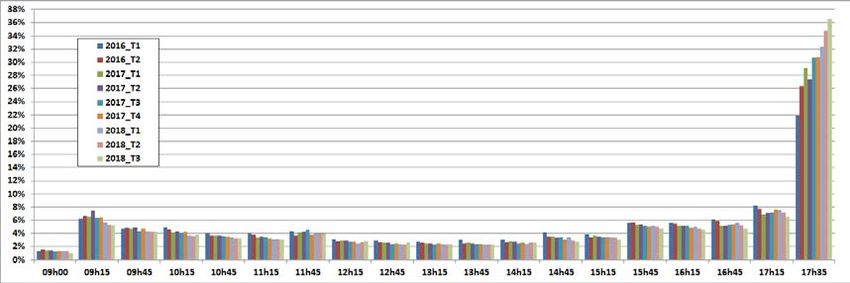
2.3. AVOIDING HFT

Certain participants, who are concerned with the risk of adverse selection, assert that they prefer trading at the
closing auction in order to limit their price impact and avoid HFTs arbitrage trades, whose presence has traditionally
been limited during this phase of the session (see below).

2.4. THE AMPLIFYING EFFECT OF EXECUTION ALGORITHMS

Finally, the increase in the closing auction market share of trading volumes can be explained by execution
algorithms, the most widespread being of the VWAP type, which adapt their execution volumes to that of the
market in general (in order to limit their own impact and be better benchmarked to the market from a TCA
perspective). The impact of the factors mentioned previously therefore appears to be amplified by these
algorithms, now used most extensively.

3.   ANALYSIS BY MEMBER

An increase in the closing auction market share of trading has been observed in recent months among most
members except for pure HFTs.

The chart below shows the change in the share of volumes traded at the closing auction by the most active
Euronext members.

                Share of transactions traded at the closing auction for each member (>0.5% market share)

                                                Source: AMF statistics

For all members, with varied activity and strategy profiles (participants classified as mixed, including the large
investment banks, in particular), the share of their volumes traded at the closing auction has increased (at least on
a trend basis). The two (mixed) members with the biggest market share on CAC 40 shares in Q3 2018 (19.3% for
the two of them) increased the proportion of their volumes traded at the closing auction by about 15% over the
period (versus 7% for the members as a whole). Certain mixed members posted a spectacular increase in the
proportion of their activity carried out at the closing auction (80% versus 32% in Q1 2017).

                                                                                                                -8-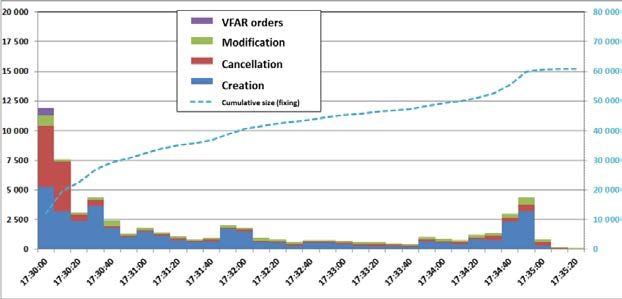
While pure HFT members collectively have a large market share during the continuous trading phase, this share
becomes almost insignificant at the closing auction. For example, the five largest pure HFT participants account for
a combined 38% market share during the continuous trading phase, compared with only 1.2% at the closing
auction. The two HFTs who are exceptions, and who perform a significant proportion of their trading activity at the
closing auction, are very active in market-making on ETFs and listed derivatives.

Finally, less than 3% of the volumes traded by retail clients (who use the RMO 11 functionality) on CAC 40 shares
are traded at the closing auction.

Case of expiry days

The same dichotomy between HFT participants and mixed participants is found during the expiry day, but the
market shares among the latter are extensively redistributed: the volumes at the closing auction increase in
different proportions according to the members. For example, on 21/09/2018, the market share of one market
participant was 14% at the closing auction on the expiry day, whereas it was 5% on average for the rest of the
month; the same applied to another participant whose market share doubled to 5.8%.

4.    PRICE FORMATION PROCESS AND ORDER BOOK ACTIVITY

4.1. CHANGES IN THE THEORETICAL OPENING PRICE (TOP) AND THEORETICAL OPENING VOLUME (TOV)

The TOP is the indicative closing price that would be fixed if the order accumulation phase stopped immediately.
The TOV is its equivalent for volumes. TOP and TOV refer to any accumulation phase i.e. for the opening or the
closing auction, even if

The two charts hereafter show the changes in these two values over the accumulation phase according to two
zoom levels 12. They are normalised as follows:
    • For the TOP, it is the average of the absolute value of differences between the TOP and the actual closing
        price. These differences are calculated per share and per day, and then averaged for each second of the
        auction.
    • The TOV shown is the ratio between the TOV calculated by Euronext, converted into an amount 13, and
        the sum of the amounts actually traded at the closing auction.

Those metrics are averaged over the month of September 2018. Unless otherwise specified, the securities studied
are those belonging to the CAC 40 Index and traded on Euronext Paris 14.

11 Euronext offers its members a type of order dedicated to retail clients only, who can obtain access to best prices offered by
certain liquidity providers. The share of transactions based on this system ranges between 3.4% and 4.5% according to Euronext.
12
   The first 30 seconds are not shown here because they are far too chaotic to be significant, due to the activation of VFA (Valid-
For-Auction) orders at the very start of the auction. An example is shown in appendix.
13 Since the TOV is expressed as a quantity of securities, conversion is performed by multiplying that quantity by the security's

closing price on the given day.
14 Corresponding to 38 securities, since Arcelor-Mittal and Unibail-Rodamco are traded on Euronext Amsterdam.

                                                                                                                            -9-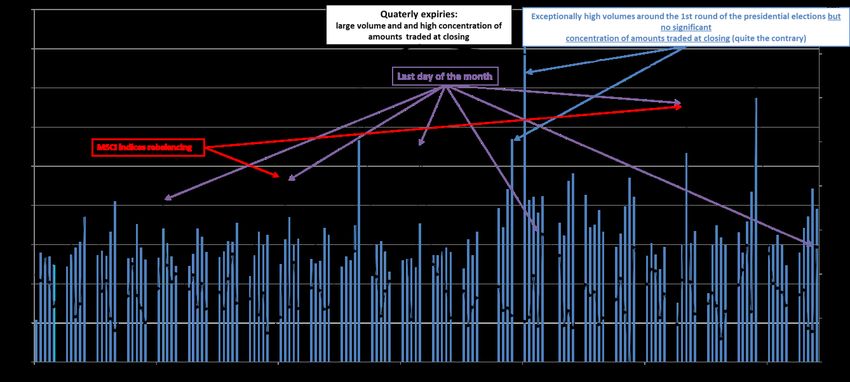
Aggregate average change in TOPs and TOVs between 17:30:30 and 17:35:30 15
                                   CAC 40 shares, September 2018 excluding the day of 21/09

                                                                                             Zoom

                            Same chart centred on the period between 17:34:00 and 17:35:30

The TOV increases rapidly in the first two minutes: after one minute, the TOV reaches 60% of the volumes that will
be traded in the auction. This rate rises to 90% after 2 minutes and stays roughly constant until 17:34:45 when it
reaches 94%. The remaining 6% are added in the last 15 seconds.

For the TOP, the convergence is also rapid, but more chaotic until 17:34:45 (see below). The average deviation of
the TOP relative to the closing price is then merely 0.25%, a level already reached at 17:32:35.

The numerous sharp fluctuations observed in the TOP until 17:34:00 are generally explained by the entry of large
orders on one or two securities, whose impact on the TOP is sufficient to impact the average TOP for all the CAC
40 shares over the month studied. In the example below, a market order of €3.5 M on Publicis entered at 17:32:06
caused the TOP to fall by around 80%; this order was maintained until the close. Following this impact, an algorithm
generated an order which was modified on 22 occasions apparently in order to test the market's depth; its
unexpected modifications then caused the TOP to fluctuate sharply for several seconds.

15As a reminder, the closing auction takes place randomly between 17:35:00 and 17:35:30. To be sure of being executed (or
not), the market members have generally finished placing their orders before this period begins. The end of the order
accumulation period can be situated at either of the time stamps without distinction.

                                                                                                                 - 10 -
Illustration of a hectic TOP fluctuation during the accumulation phase
Publicis on 25/09/2018
4.2. ORDER BOOK ACTIVITY
The order book activity is defined here as the number of messages processed by Euronext during the accumulation
phase. The TOP and TOV updates, which are recalculated by Euronext after each creation / modification /
cancellation of orders, are only taken into account in the following chart when one of the two values is modified.
Their changes show a pattern which includes activity peaks at the following times 16: 17:30:00, 17:30:30, 17:31:00,
17:31:50, 17:32:00 and after 17:34:40. This same pattern is found on expiry day.
Order book activity
(by 10-second tranches - on average in September 2018, excluding 21/09)
16 More precisely: "in the 10 seconds starting at this time".
- 11 -4.2.1. ANALYSIS BY TYPE OF MESSAGE RECEIVED
The number of order messages received by Euronext during the closing auction is about 60,000 per day. 30% of
these messages are concentrated in the first 20 seconds (mainly order cancellations and creations). A less
pronounced peak in activity also appears in the last 20 seconds.
Number of order messages processed by Euronext during the closing auction
(September 2018 excluding the day of 21/09/2018)
On expiry day, the number of order messages was 22% greater than the average noted in the rest of the month.
Almost half of the 13,000 additional messages are explained by the messages received during the first 10 seconds
following the start of the auction phase. This day is marked, in particular, by the more intense use of “Valid-For-
Closing-Auction” orders (hereinafter called "VFAR orders" 17), i.e. orders that are entered during the continuous
phase but which are only activated by the platform at the start of the auction phase. Around 95% of these orders
(by amount) were market orders 18. Excluding the day of 21/09/2018, the cumulative size of these orders was
€122m per day (651 orders). On 21/09/2018, they totalled €1.95bn worth of transactions (2,492 orders 19).
Order messages processed by Euronext on 21/09/2018
17 Terminology used in the technical standards supplementing MiFID II (RTS 24).
18 The amount considered for each of these orders is equal to the size of the order in number of securities multiplied by the
closing price.
19 However, the number of orders may be deceptive, because some members break their largest orders down into several
orders, probably in order to prevent their orders from being rejected by their internal control systems or by the stock exchange
itself. For example, on the expiry day of 21/09/2018, one member submitted 7 VFA buy orders for 42,360 shares each (296,520
in all) on LVMH for a total of €134m at the closing price, and two additional buy orders for a total of 15,625 shares. We find this
same pattern of breaking down VFA orders for other members.
- 12 -VFAR orders are generally used for hedging delta-one derivative products, for which the securities hedge must be
resold at the closing price to precisely replicate the clearing price irrespective of the level (hence the extremely
high proportion of market orders for these orders). Since positions may be very substantial on this type of products,
which are very low-risk when they are hedged, VFAR orders are used during the day for operational convenience
given the short 5-minute time window of the auction.
4.2.2. ANALYSIS BY MEMBER
The two charts below show that there is no strong correlation between a member's activity in terms of messages
sent to the market and its market share in terms of amounts traded. The member initiating the largest number of
orders, i.e. 23% of the total, executes only 0.17% of the amounts traded.
Amounts traded at the closing auction Messages sent during the closing auction
The chart below, which shows the breakdown of the number of orders per member during the auction phase,
identifies no dominant market share.
- 13 -5. ASSOCIATED RISKS
The growing proportion of volumes traded at the closing auction could generate or exacerbate a number of risks
concerning the orderly functioning of financial markets.
5.1. RISKS REGARDING THE QUALITY OF THE PRICE FORMATION PROCESS DURING THE DAY
The concentration of volumes at the end of the day at the expense of the rest of the session could have the effect
of undermining the price formation process for lack of sufficient liquidity, while increasing intraday volatility (as in
the "flash crash" of 06/05/2010 20), whether accidentally or due to manipulation.
5.2. OPERATIONAL RISKS DURING AUCTIONS
At first glance, the increase in volumes at the closing auction should, on the contrary, make the price formation
process more robust (since increased liquidity is likely to mitigate shocks). However, the volumes executed at the
closing auction are not all based on orders that contribute to determining the price: at the closing auction, market
orders in opposite directions neutralise one another without necessarily directly contributing to the establishment
of the closing price 21.
It is worth noting that this type of incident implies a greater risk for market participants than for infrastructure,
which will in any case proceed to closing auction, with a delay, in accordance with their obligations.
The volumes at the closing auction therefore remain exposed to potential incidents or occasional failures of the
infrastructure or of one of the members, possibly impacting a larger quantity of interests. As an example, an
operational error 22 by one member on 08/05/2018 resulted in a 9% rise at the closing auction of Suez
Environnement, which impacted numerous participants (rise corrected at the opening auction the next day, -8.3%).
5.3. IMPACTS FOR THE AMF
The risks identified above are monitored permanently by the AMF. In particular, the AMF's real-time supervision
tools can detect a potential major "flash crash" during the session. Since 2016, however, the AMF has not identified
an increase in the number of drastic fluctuations, which means that, at this stage, it is not possible to conclude that
there has been a definite deterioration of the price formation process.
*****
20 This episode is often described as having started accidentally: a $4.1bn sell order on the mini-S&P future executed via a
Percentage-Of-Volume type of algorithm apparently caused a spiralling drop in the markets.
21 Buy and sell market orders which can be matched do not contribute to price formation. The proportion of volumes traded at
the closing auction based on these market orders capable of being matched face-to-face amounts to 40%. Only the balance of
market orders and limit orders directly contributes to the closing price’s formation process.
22 The member wanted to execute a buy/sell-back transaction on 3.5 million shares, but the Euronext circuit breakers rejected
these excessively large orders. The member therefore wanted to reduce their size to 2 million, but only had time to enter the
buy order and not the sell order. The loss incurred was €2.2m.
- 14 -6. APPENDIX
6.1. VOLUME AND SHARE OF AUCTIONS ON CAC 40 SHARES IN 2017 (H1 AND H2 ARE SHOWN SEPARATELY)
Source: AMF statistics
- 15 -6.2. IMPACT OF VFA ORDERS ON THE TOP AT THE VERY START OF THE AUCTION
The chaotic changes in the TOP during the first 30 seconds can be explained by activation of the Valid-For-Auction
(VFAR) orders, whose sizes are sometimes completely disproportionate to the quantities available in the order
book. An illustration of this phenomenon is given below.
Total on 27/09/2018
In this example, the first TOPs reported by Euronext on Total were equal to €1,600 whereas the last price traded
was €55.91 and the share closed at €56.02.
The price of €1,600 corresponds to the highest price limit among the sell orders present in the order book at the
start of the auction phase. This TOP was reached at the start of the auction due to the activation of three VFAR At
Market buy orders for 200,000 shares, because the At Market buy orders far exceeded the quantities of sell orders
available in the order book, for all limits combined. Even taking account of all quantities offered for sale in the
order book, the TOV did not reach 500,000 shares.
TOP and TOV of TOTAL in the first minutes of the closing auction phase on 27/09/2018
- 16 -You can also read