Boost Room Service Sales at Your Hotel - WHITE PAPER Using Data-Driven Insights to Optimize Your Hotel's In-Room Dining Strategy - Hotel Suppliers
←
→
Page content transcription
If your browser does not render page correctly, please read the page content below

WHITE PAPER

Boost Room Service
Sales at Your Hotel
Using Data-Driven Insights to Optimize Your
Hotel’s In-Room Dining Strategy
Contents

1   Introduction                                       _03

2   Using data to optimize hotel in-room dining        _05

3   Results: The top 5 food orders                     _07

4   Results: The top 5 drinks orders                   _14

5   Promoting your new in-room dining sales strategy   _21

                                 -2-
1
Introduction
Room service has been a key feature of high-end         hardly surprising that modern guests are looking
hotel service since New York’s Waldorf Astoria          elsewhere to fill their bellies.
first opened its doors in 1931. This simple exten-
                                                        Local restaurants have now entered the frame,
sion of food service into the hotel room opened
                                                        expanding their service outside the confines of
up a world of opportunity for hotel businesses,
                                                        their establishment using apps such as Uber Eats,
changing the in-room experience for hotel guests
                                                        Deliveroo, and DoorDash to order food at hotels.
forever. Since then, room service has been an es-
                                                        Hotels now have a multitude of new competitors
tablished industry standard for high-end hotels
                                                        to contend with who already specialize in food
all over the world, embodying the quintessence
                                                        orders. Luxury resorts in remote locations may
of luxury, affluence, and convenience.
                                                        be more immune than city hotels as there is less
In its heyday, room service was epitomized as the       choice for eating out, but as more and more high-
ultimate extravagance – as captured in 1980s and        end restaurants enter the delivery market, this will
90s Hollywood movies such as Home Alone 2 and           also change.
Pretty Woman. But times have changed, and the
                                                        The hotel industry has been blindsided by these
caliber of room service as a definition of pres-
                                                        developments and is struggling to keep pace with
tige has been on somewhat of a downward trend
                                                        the rise of digital technology and the moderniza-
since the early 2000s. The rise of app-based deliv-
                                                        tion of in-room dining. For some, things have got
ery services and travelers’ demands for authentic
                                                        so bad that they are throwing in the towel—the
cuisine has normalized the luxury of eating what
                                                        iconic New York Hilton Midtown hotel, for exam-
you want, where you want, when you want. When
                                                        ple, decided to stop offering room service1 in any
you factor in the typically high prices and limit-
                                                        capacity in 2013.
ed menu offerings attached to in-room dining, it’s

                                                      -3-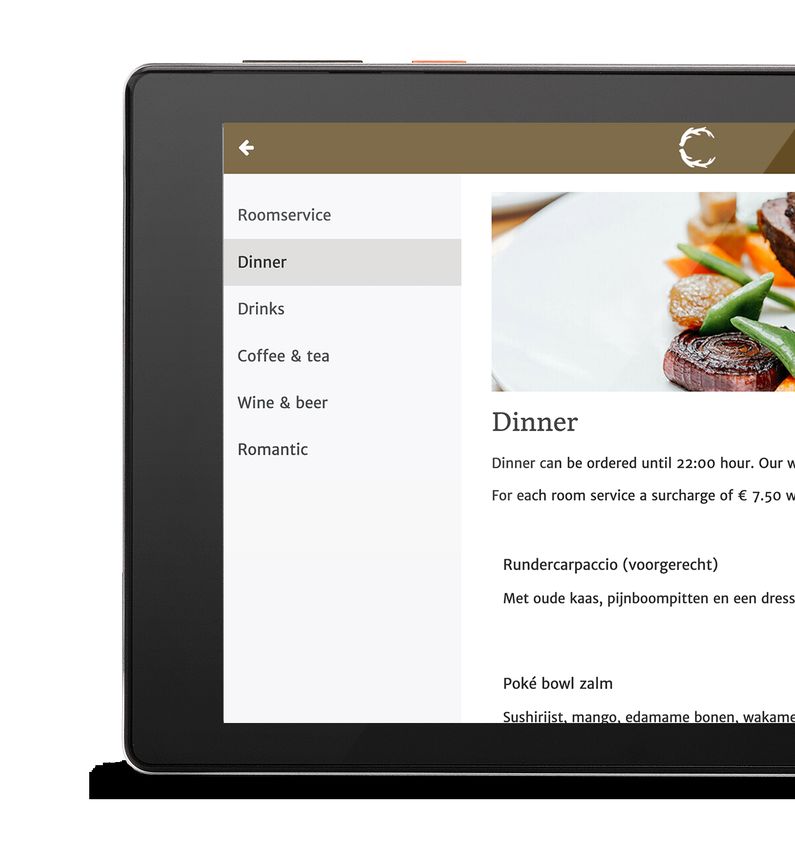
Others are adapting to the changes. As reported in       But, what about hotels that don’t want to out-
Forbes , Wyndham Hotels & Resorts announced
       2
                                                         source their in-room dining? What can they do
in 2019 that they signed a deal with DoorDash            to reinvigorate the stale reputation of room ser-
to provide free food delivery services to 3,700          vice at their hotel? At SuitePad, we’ve collected
properties across their 20 hotel brands. This move       a wealth of data on what guests look for when it
suggests that Wyndham foresees room service              comes to in-room dining at hotels through our in-
not being part of the standard hotel experience in       room tablets. Using this valuable data, we’re going
the near future and are taking steps to mitigate its     to offer you insight into how you can turn things
effect on the business.                                  around at your hotel—food and beverage manag-
                                                         ers, stay tuned!

                                                       -4-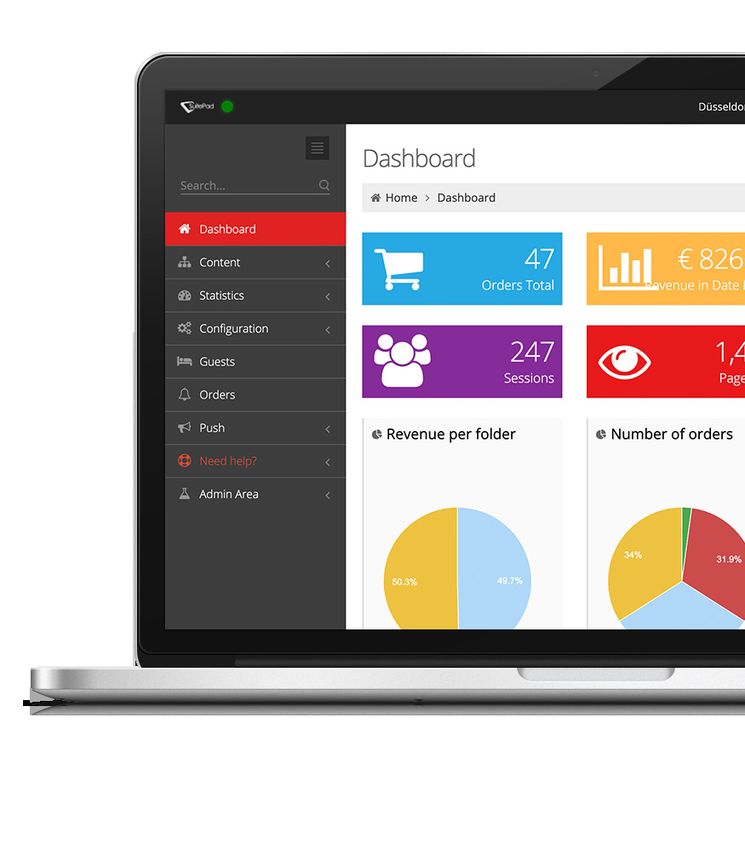
2
Using data to
optimize hotel
in-room dining
SuitePad’s Backend offers our customers an in-
sight into how guests use their SuitePad—it shows
usage statistics such as the number of orders in
a given time frame or the percentage of revenue
generated via different hotel services. This data
gives us an exclusive insight into guests’ ordering
patterns and practices that hoteliers may not be
aware of.

We took the top five food and drink orders across
our hotels, and then benchmarked the share of
these orders according to hotel type. If you are a
hotelier or hotel manager, this information is in-
valuable. With it at your disposal, you’ll be able
to build a room service guest profile to hone in
on guests’ ordering preferences at your specific
type of hotel, helping you to increase revenue and
please guests simultaneously.

                                                      -5-
THE DATA3
Our sample consisted of 30,349 room service “Burger” included cheeseburgers, signature burg-
food orders and 20,267 room service drinks or- ers, plain burgers, etc. The top 5 food categories
ders from a total of 670 hotels worldwide which and the number of times they were ordered were
were split into 4 categories: City Hotel (237), De- as follows: Burger (9,662), Club Sandwich (6330),
sign/Lifestyle Hotel (65), Leisure/Resort Hotel Pasta Dishes (5144), Caesar Salad (5136), and Fries
(293), and MICE Hotel (75). (4077) across all hotels in our sample. For drinks,
the categories and order totals were: Orange Juice
Food and beverage types were collated to encom- (5569), Coffee (4638), Cola (4261), Water (3509),
pass a single category—for example, the category and Beer (2290) for all hotels in our sample.
City Hotel
35%
55%
MICE Hotel
10%
Design Hotel
11%
The Top 5 Foods and Top 5 Drinks
equal 55% of all room service orders in Leisure Resort
the data set. 44%
THE FORMULA
(No. of items sold at hotel type ÷ No. hotels in that given category) 100
× %
Avg. total no. of items sold per hotel 1
Using this formula, we were able to benchmark the percentage share of each type of item at
each hotel type, offering a view into the room service ordering behaviors of guests at each hotel
type.
-6-3
Results:
The Top 5
Food Orders
OVERVIEW
Burgers
Fries
Club Sandwiches
Pastas
Caesar Salads
-7-ALL HOTEL TYPES
32.4%
Burgers were overall the
most ordered item at
20.5% 32.4%
17.2%
16.2%
13.7%
Pasta was on average
the least ordered of the
Top 5 at under 14%
If we start by looking at the overall percentage This suggests that this trend is also reflected in
share of the top 5 food orders across all hotel guests’ room service order preferences when we
types, we can see that burgers were significantly pull together all hotel types.
more popular than any other food type, and pas-
ta dishes were the least popular among the top The closeness in preference for the remaining four
5. Although fries, club sandwiches, pasta dishes, meal types suggests that there is still a demand
and caesar salads were significantly less popular across the board for each of these. The following
than burgers, the difference in popularity between section will offer a breakdown of the order per-
these four items was relatively small with only 6.9 centage share for each item by hotel type, offering
percentage points separating second and fifth po- a better view as to how these overall results com-
sition. pare between the different hotel categories.
It’s not surprising that burgers were the most pop-
ular choice—burgers have been rising in popularity
in the culinary world over the last decade or so.
-8-CITY HOTELS
31.0%
Burgers were the most
23.0% ordered food item
20.6% standing at 31%
19.4%
Fries were particularly
6.0%
low at 6% compared
with other hotel types
City hotels were the group with the second-high- However, the percentage share of orders for club
est number of entrants in our sample—a total of sandwiches, pasta dishes, and Ceasar salads was
237. After benchmarking for the percentage share still significant, indicating that these options could
of in-room orders, the results suggest that guests also be worth pushing as specials or signature
at city hotels generally favored burgers over other dish variations. The numbers do suggest that fries
food items for in-room dining. This isn’t surprising were not of much interest to city hotel guests, so
considering that burgers have become a bit of an it’s unlikely that trying to increase the number of
urban favorite in recent years—it’s quick, satisfy- orders of fries will have much impact.
ing, and can be customized to a guest’s liking with
relative ease. For this reason, city hotels may want
to push special offers, offer signature burgers, or
even have burger happy hours for in-room dining
orders to maximize the potential profit that can be
made from this interest from guests.
-9-MICE HOTELS
35.9%
Burgers were by far the
favored in-room item at
35.9%
19.6%
17.7%
15.1%
11.7%
Fries were the lowest at
just under 12%, but not
by a large margin
The benchmarked results show that burgers were This could be determined by regional cuisine—for
a more popular in-room order for guests at MICE example, Italian hotels might have greater success
hotels than at city hotels, but so too were fries— than British hotels at promoting authentic pasta
even if they still occupy fifth position overall. It dishes, but British hotels may have more success
therefore makes sense for MICE hoteliers to push when promoting club sandwiches.
specials and signature dishes for burgers but not
for fries as the percentage share of orders shows
that guests at MICE hotels weren’t very interested
in ordering them.
Pasta dishes, Ceasar salads, and club sandwiches
were borderline in the amount that was ordered,
so it would make sense for hoteliers to decide
whether they are worth promoting to increase or-
der rates on these items on a case-by-case basis.
- 10 -DESIGN AND LIFESTYLE HOTELS
30.8% 30.7%
Fries and burgers were
almost on par both at
20.7% nearly 31% each
13.1%
Pasta orders were the
4.7% lowest standing at just
under 5%
The results show that burgers were also the pre- As pasta dishes seemed to be in such low demand,
ferred item ordered through room service at MICE hoteliers at design and lifestyle hotels may want
hotels, but they were almost equaled by the order to consider whether they’re even worth offering
demand for fries. as part of the room service menu at all, or if they
can spice-up their pasta dishes to try and increase
For owners of design and lifestyle hotels, it’s the percentage share of this food item. Club sand-
worth promoting burgers through room service wiches and Caesar salads fared much as they did
menus, but it’s also very much worth promoting in other hotel types, suggesting that these were
fries. Unlike burgers, fries are a little more limited relatively “stable” dishes to offer—it’s unlikely that
with how they can be customized, but it might be guests will order them in great quantities, but they
worth considering a range of special fries options will almost certainly get a moderate number of or-
such as triple-cooked fries, chili cheese fries, and ders.
zucchini fries in order to capitalize on guests’ hun-
ger for the humble fried potato.
- 11 -LEISURE HOTELS
31.4%
Burgers were yet again
22.9% the top standing orders
20.7% at just over 31%
12.6% 12.5%
Salad and pasta orders
were the lowest at
around 12.5% each
As with all the other hotel types, burgers were the suggesting that these two do not do so well at
number one ordered item through room service leisure resorts. This may be a result of the popu-
within our sample of leisure resorts at 31.4% of the larity of burgers and fries that are more popular as
order share. In second place was club sandwiches, children’s orders, so it may be worth considering
closely followed by fries at 22.9% and 20.7% re- how to increase these and similar items to provide
spectively. This shows that fries were in relatively good alternatives for adult guests.
high demand when compared with city and MICE
hotels, but in lower demand when compared with
design and lifestyle hotels. This isn’t surprising as
fries are a popular snack for children—especially
when on vacation!
The order share of club sandwiches remained
around the 20% mark while pasta and Caesar sal-
ad orders were slightly lower than the average,
- 12 -SUMMARY
Burgers and club sandwiches were the two most
stable items across all hotel types with burgers
consistently selling at about 30% of the total in-
room food order share and club sandwiches at
about 20%. This suggests they are popular items
for all hotel types and are worth offering for all
hoteliers—it seems all guests are partial to a tasty
burger.
The remaining three items—fries, pasta dishes,
and Caesar salads—had a more complex distribu-
tion among the different hotel types. Orders of
fries were popular at design hotels and leisure re-
sorts, but performed significantly badly at city and
MICE hotels. Pasta dishes and Caesar salads only
hit above the 20% mark once each—this was at
city hotels. At all other hotel types, they failed to
reach ⅕ of the proportion of in-room orders with
pasta performing particularly poorly at design ho-
tels and Caesar salads performing quite poorly at
leisure resorts.
This disparity in order preferences by guests at
the different hotel types might be surprising to
some hoteliers—maybe owners of design hotels
assumed that pasta dishes sold this poorly across
the board. It shows that there is a clear link be-
tween the types of hotels that guests choose and
their in-room ordering preferences. We hope this
information can enable hoteliers to make an in-
formed decision when moving forward with a new
in-room dining sales strategy.
- 13 -4
Results:
The Top 5
Drink Orders
OVERVIEW
Cola
Water
Beer
Orange Juice
Coffee
- 14 -ALL HOTEL TYPES
27.0%
24.5%
21.2% Orange juice was the
most popular drink
17.4% order at 27%
10.0%
Beer was the least
ordered in-room drink
at 10%
When the 20,267 drinks orders from our sample Coffee and water both came in at 21.2% and
were benchmarked to find the proportion share of 17.4% respectively, occupying the “middle of the
each drink type across the board, we found that park” positions. As these are both items that are
the most popular drink ordered was orange juice usually ordered at any time of the day, it’s not sur-
at 27% of the total share of in-room drinks orders, prising to find their numbers each accounting for
followed closely by cola at 24.5%. It might be sur- close to ⅕ of the total share, but it will be interest-
prising to some that beer came in so low—only ing to see if this is consistent across all hotel types
10% of the total in-room order share for drinks in the individual analysis.
sold at hotels in our sample was beer. This may
be because guests tended to buy more beer at
bars and restaurants outside the hotel, directly at
the hotel bar, or make use of the hotel room mini
bar, whereas soft drinks were usually ordered with
food for in-room dining.
- 15 -CITY HOTELS
23.2%
21.8%
21.0%
17.6% Water was the most
16.5% popular drink by a
small margin at 23.2%
Although relatively
even, orange juice was
least ordered at 16.5%
The percentage difference between water (the juice are less likely to be as successful due to its
most ordered item) and Orange juice (the least or- low demand. This is significant as these results are
dered item) was only 6.8%, showing a relatively contrary to the numbers seen in the overall av-
even distribution. Beer performed well compared erage across all hotel types, showing that guests
with the overall standings, taking 17.6% of the at city hotels bucked the trend for the types of
order share—this suggests that city hotel guests drinks they ordered through room service.
were more likely to order beers as part of room
service than the average across all hotels. Signifi-
cantly, city hotel guests’ appetite for orange juice
was much lower than the average, hitting a mere
16.5%.
Food and beverage managers may find that pro-
motions for beer, cola, water, and coffee will have
some limited success, whereas offers for orange
- 16 -MICE HOTELS
44.4%
Cola was by far the
most popular drink at
just over 44%
20.8%
15.8%
12.9%
Beer remained the least
6.2% ordered drink at just
over 6%
Cola drinks were by far the most popular room water, so this may account for the relatively low
service order within our sample of 75 MICE ho- order rate. For hoteliers of MICE hotels, it seems
tels, attributing to 44.4% of rooms service drinks that it might be more beneficial to promote an ice
orders from our top 5 drinks. Comparatively, beer cold cola than a refreshing beer for guests to order
was way down at the other end of the scale, pro- from their room!
viding a very low 6.2% of the order share. Guests
at these hotels are likely to be there to attend
meetings and functions, so maybe it’s no surprise
that they wouldn’t be drinking alcoholic beverages
in their room.
Orange juice came in second place at nearly 21%,
followed by coffee at 15.8% and water at 12.9%.
Almost all MICE hotels offer complimentary
breakfast, in-room coffee making services, and
- 17 -DESIGN & LIFESTYLE HOTELS
32.5%
Orange juice stood
out as most popular at
21.4% 32.5%
19.4%
18.2%
8.5%
Beer orders were
particularly low at
8.5%
Design hotels are popular with guests that want The results suggest that design hotel owners could
more than just a convenient place to stay—they capitalize on guests’ appetite for orange juice by
want to feel like the place they’re staying at is part offering something a little special—maybe invest-
of the reason they’ve travelled. It also seems that ing in an orange juicing machine and advertising
they enjoy orange juice as it came in at over 32% “freshly squeezed orange juice” would maximize
of the order share. the potential for upselling this item. The appetite
for drinking beer in the room seems low among
Beer was the lowest ordered item of our 5 top design hotel guests, but hoteliers may want to
drinks at design hotels, comprising only 8.5% of offer deals such as happy hours or special “room
the total order share of drinks. Cola, water, and service offers” to help increase the profit margins
coffee were all within 2% of the 20% mark, show- from beer sales.
ing that design hotel guests have a roughly equal
distribution of desire for these drinks.
- 18 -LEISURE RESORTS
41.7%
Orange juice was again
particularly popular at
27.6%
just under 42%
13.8%
10.5%
Beer orders were
6.4% noticeably low at just
over 6%
Out of all of our hotel categories, leisure resorts erages for their children. This, however, doesn’t
sold the largest proportion of orange juice which seem to be the case. If hoteliers at leisure hotels
made up 41.7% of the total beverage sales from wish to increase the sales of cola soft drinks, they
our top 5 items. Coffee came in second place could try providing a pop-up advertisement on
with 27.6% which is also significantly higher than their digital in-room tablet to help drive sales in
in any other hotel type. This isn’t an unexpected this area.
trend as leisure resorts tend to be family-friendly
and therefore soft drinks and coffee are expected
to sell more than alcoholic beverages.
At 6.4% of the order share, beer was by far the
lowest sold item. Water came in at 10.5% and cola
at 13.8% which is quite surprising considering that
leisure resorts tend to cater to families and one
would think that parents would order cola bev-
- 19 -SUMMARY
While orange juice seemed to be a clear winner But, it’s significant that orders were lowest in city
in the overall results, the breakdown of the dif- hotels, where coffee shops are in abundance, and
ferent order shares by hotel type reveals that it highest at leisure resorts, which tend to be situ-
had major success at design hotels and leisure ated outside of cities so access to coffee shops
resorts, but was average and just below average is limited. This may account for the fluctuation in
at MICE and city hotels. Interestingly, this trend these results.
corresponds with the popularity of orders of fries
across the different hotel types—is it possible that Water was most popular at city hotels—maybe
OJ and fries is the next big thing? It’s unlikely, but guests needed to cool off after a long day of ex-
it may suggest that the type of guests at design ploring all the sights! It may be surprising, how-
hotels and leisure resorts are more likely to order ever, that in-room orders for water were so low
snacky comfort food and drinks than at other ho- at leisure resorts. Without more information it’s
tel types. difficult to explain this, but reasons could include
the fact that leisure resorts are more likely to offer
Beer performed poorly in all but the city hotel cat- complimentary water.
egory, where it still didn’t manage to reach ⅕ of
the total in-room order share for drinks. It’s likely
that guests prefer to either take their custom else-
where—such as local pubs and restaurants—or to
drink in the hotel bar or lobby which is a much
more sociable environment. Much of this may
have to do with the stigma that comes with drink-
ing alone in your hotel room.
Cola was so popular at MICE hotels that it made
up close to half of all in-room drinks orders at this
hotel type. This may have to do with the fact that
MICE hotels tend to cater to business people who
are likely to order room service after a long day
of conferences. It’s no coincidence that burgers
also had their highest order rate at MICE hotels,
suggesting that the classic pairing of a burger and
cola is a popular choice for guests staying for con-
ferences and other events.
Orders of coffee were relatively consistent across
the board, slightly under average at city hotels and
slightly over average at leisure resorts. The results
for coffee are difficult to analyze as many hotels
offer it for free in the room and with breakfast.
- 20 -5
Promoting your new
in-room dining sales
strategy
All this information isn’t worth much if you don’t
have the means to promote your in-room dining
services in an effective way. While leaflet menus
and card collateral offering special deals have
been popular for many years, modern guests are
used to modern amenities, and as a result, often
overlook paper-based in-room collateral.
This is why in-room tablets are more effective—
they’re interactive and can actively promote of-
fers through push notifications and more mod-
ern menu formats. They break down barriers that
once stood in the way of guests ordering room
service such as the need to call down to reception
to order and offer guests extensive information on
the menu items without the need to reach out to
hotel staff.
- 21 -At SuitePad, our customers frequently find their
room service orders increase significantly after
installing our tablets—mainly as a result of the “What we like most:
modern sales techniques that SuitePad’s services SuitePad boosts room
enable, including interactive menus and push no-
tifications. In addition, hoteliers can use the intui-
service and spa revenue
tive SuitePad backend to view customer ordering and allows guests to
data and patterns to help them build their own
order straight from the
tailor-made in-room dining sales strategy. These
kinds of insights simply weren’t available before menu in their hand. We
the introduction of digital technology to the hotel gain insight into guest
room.
interests through the
analytics in the backend.”
Mandala Hotel on
HotelTechReport.com4
THE FUTURE OF IN-ROOM DINING
In-room dining is far from being on its last legs. The insights provided in this report are only a
Although competition in the form of app-based taste of what SuitePad’s in-room tablets can of-
delivery services is on the increase, there’s no rea- fer. As data becomes a more valuable commodity,
son to think that hotels cannot provide the quality hoteliers will need to find ways to access and col-
of service they once did in the hotel room. All it lect it. SuitePads are the key to accessing this kind
shows is that hoteliers need to adapt their service of data and will become an essential item for any
to offer guests the same level of choice and con- successful hotel business in the future.
venience as the competition—a level of service
that only digital technology can provide.
Are you interested in using SuitePad at your hotel?
Feel free to contact us for more information and an obligation-free consultation.
marketing@suitepad.de +49 (0)30 319 850 000 www.suitepad.de
- 22 -Sources
1 Winnie Hu (2013), “Sorry, Eloise. No More Room Service” The New York Times. June 2nd.
https://www.nytimes.com/2013/06/03/nyregion/room-service-is-vanishing-from-a-big-
hotel.html
2 Suzanne Rowan Kelleher (2019), “Hungry? Here’s What Has Replaced Your Hotel Room
Service” Forbes Magazine. May 10th,
https://www.forbes.com/sites/suzannerowankelleher/2019/05/10/hungry-heres-what-
has-replaced-your-hotel-room-service/#29c2da3e27dc
3 All data sourced from SuitePad during the years 2017 and 2018
4 Quote from Management at The Mandala Hotel, Berlin taken from HotelTechReport.
https://hoteltechreport.com/guest-experience/guest-room-tablets/suitepad
- 23 -You can also read