Windeln.de SE - Investor Relations
←
→
Page content transcription
If your browser does not render page correctly, please read the page content below

windeln.de SE
Fall 2019

Disclaimer

This document and its related communication (“Presentation”) have been issued by windeln.de SE and its subsidiaries ( “Company”) and do not
constitute or form part of and should not be construed as any offer or invitation to sell or issue, or any solicitation of any offer to purchase or subscribe
for, any securities of the Company in the U.S.A. or in any other country, nor shall any part of it nor the fact of its distribution form part of or be relied on in
connection with any contract or investment decision relating thereto, nor does it constitute a recommendation regarding the securities of the Company.
Nothing in this Presentation constitutes tax, legal or accounting advice; investors and prospective investors should seek such advice from their own
advisors. Third parties whose data is cited herein are neither registered broker-dealers nor financial advisors and the use of any market research data
does not constitute financial advice or recommendations. Securities may not be offered or sold in the U.S.A. absent registration or an exemption from
registration under the U.S. Securities Act of 1933, as amended; neither this Presentation nor any copy of it may be taken or transmitted or distributed,
directly or indirectly, to the U.S.A., its territories or possessions or to any US person.

This Presentation has been carefully prepared. However, no reliance may be placed for any purposes whatsoever on the information contained herein or
on its completeness. No representation or warranty, express or implied, is given by or on behalf of the Company or its directors, officers or employees or
any other person as to the accuracy or completeness of the information or opinions contained in this Presentation and no liability whatsoever is accepted
by the Company or its directors, officers or employees nor any other person for any loss howsoever arising, directly or indirectly, from any use of such
information or opinions or otherwise arising in connection therewith. This Presentation is subject to amendment, revision and updating. Certain
statements and opinions in this Presentation are forward-looking, which reflect the Company’s or its management’s expectations about future events.
Forward-looking statements involve many risks, uncertainties and assumptions that could cause actual results or events to differ materially from those
expressed or implied herein or could adversely affect the outcome and financial effects of the plans and events described herein and may include
(without limitation): macroeconomic conditions; behavior of suppliers, competitors and other market participants; inadequate performance with regard to
integration of acquired businesses, anticipated cost savings and productivity gains, management of fulfillment centers, hazardous material/ conditions in
private label production or within the supply chain, data security or market knowledge; external fraud; actions of government regulators or administrators;
strike; or other factors described in the “risk” section of the Company’s annual report. Forward-looking statements regarding past trends or activities
should not be taken as a representation that such trends or activities will continue. The Company does not undertake any obligation to update or revise
any forward-looking statements, whether as a result of new information, future events or otherwise. You should not place undue reliance on forward-
looking statements.

This Presentation may include supplemental financial measures that are or may be non-GAAP financial measures. These supplemental financial
measures should not be viewed in isolation or as alternatives to measures of the Company’s net assets and financial positions or results of operations as
presented in accordance with IFRS in its consolidated financial statements. Other companies that report or describe similarly titled financial measures
may calculate them differently.

By attending, reviewing, accepting or consulting this Presentation you will be taken to have represented, warranted and undertaken that you have read
and agree to comply with the contents of this notice.
                                                                                                                                                                      2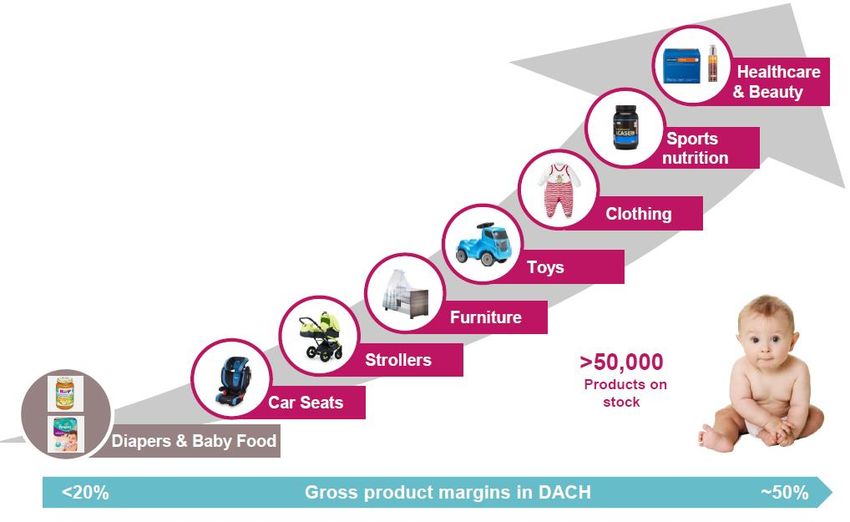
Company Overview

We are one of the leading online retailers for baby,
children and family products in Europe and China

   Presence in 6 European                             540,000+             50,000+
     countries and China                         Active Customers         Products

           1 million+                                12 million+        EUR 105 million
         Orders in 2018                          Site Visits in 2018   Revenues in 2018

                                                   Our offering

 ✓ Shopping with easy order process and quick,
   free & secure delivery
 ✓ Online magazine to educate and support
   parents
 ✓ Carefully selected products with detailed
   product descriptions and product advice
 ✓ Trusted customer service

                                                                                          4
We have a strong expertise selling products cross border
e-commerce (CBEC) to Chinese customers

                      windeln.de shop in Chinese                                 windeln.de Flagship store on Tmall Global
                         www.windeln.com.cn                                             https://windelnde.tmall.hk/

                                             Our China expertise…

          中国

      Web-Shop in         All important            Customer service      Bonded warehouse        Team China in
       Chinese          Chinese payment              in Vietnam                                 Munich (15 FTEs)
                            methods

     Direct Express      Present in social          Server in China         China App           Office in Shanghai
        Delivery             media                                                              with six employees

   …in the highly attractive Chinese CBEC market for European (esp. German) products

            EUR 576 billion                        USD 121.6 billion                    15.2 million
      Chinese e-commerce volume 2018          Chinese CBEC volume 2018              Births in China in 2018

                                                                                                                             5
Investment highlights

  1       Attractive market segment: ecommerce for baby and family products

      2                   Strong partnerships with European suppliers

          3       Good infrastructure to China and excellent expertise of Chinese market

              4                  Experienced management team and employees

                                                                                           6
Company strategy

Growth strategy in China to expand the online business
and build a hybrid business

                                                   Cross-
             ✓ China webshop                       Border
                                                E-Commerce
                                                  (CBEC)                                   Affiliate model

✓ Tmall
Flagship                                                                              Being
store                                                                                evaluated
                    Maximize                                     HYBRID/         Technology
                                   ONLINE                                                               Hybrid
                  presence and                                   OFFLINE        empowerment             platforms
                 sales channels                                                                         (online to
✓ App                                                                                                   offline)

           WeChat                                    General                               Shop in shop;
           mini program                               Trade                                franchise shop in
           and other sales                                                                 shopping malls
           platforms

                                           Online to Offline merge
                                                                       Serve platforms that also offer products
  Use of good supplier relationships in Europe and
                                                                     offline; broaden customer base in tier 2 & 3
   well-known brand name “windeln.de“ in China
                                                                                    cities in China                  8
Cooperation with Langtao supports distribution strategy,
improves marketing activities and increases efficiency

       Areas of
                                            Description                         Status
      cooperation
                         •   Online marketing & Social Media marketing
      China platforms    •   Brand strategy
       (e.g.. TMall)     •   Sale promotion measures
                         •   Communication with platforms

                         •   Online marketing &Social Media marketing
        China Shop       •   Brand strategy                                   Expected
     (windeln.com.cn)    •   Sale promotion measures                        December 2019
                         •   Visual design

     Customer service
                         • Customer service for all online sales channels       Q1 2020
        for China

      New distribution   •    Sale promotion measures
                                                                            In implementation
        channels         •    Logistics optimization

                                                                                                9
DACH and Rest of Europe strategy focused on developing
into the leading online retailer for familiy products

                             FAMILY

        #1: SELECTION       #2: MARKETING       #3: INNOVATION

       Family expansion      Social Media       Pregnancy app

           Curation             Focus            Cooperations

         Private lable        Synergies          Storchenbox

                                                                 10
Several projects to increase profitability and revenues
• New Head of Marketing starting Dec 1, 2019 • Focus on sales events in Q4 (Singles Day 11.11.,
Black Friday, etc.)
• Pricing tool Omnia to increase profitability
• Bonded warehouse II (Done)
• IT Shop outsourcing ongoing
• New distribution channels: WeChat Mini program
• Central warehouse move in H1 2020
• VAT refund
• Focus on sales events, e.g. Black Friday and
Cyber Week
11 11Recent financials
China Revenues

   China revenues weaker due to implementation of strategic
   cooperation and delayed opening of bonded warehouse

                                                              •   Bonded warehouse II delay
                              China
                                                                    •   Changed customs requirements that
                                                                        required technical implementation
     in EUR million
                                                                    •   Go-live 4th November 2019

                                                              •   Implementation of strategic cooperation with
                                                                  Langtao

                                                                    •   Contract signed in August
                                                                    •   TMall and Chinese webshop

                                                              •   Large sales event in Q4

                                                                    •   Singles’ Day (11.11.)
                                                                    •   Black Friday
                                                                    •   Pink week

     17.5      11.6   11.8    15.8    12.3    12.7    10.7

    Q1/18     Q2/18   Q3/18   Q4/18   Q1/19   Q2/19   Q3/19

                                                                                                                 13
DACH Revenues
DACH region back to growth again
• +5% revenue growth quarter over quarter (Q3
DACH 2019 compared to Q2 2019)
• Large sales events in Q4
in EUR million
• Black Friday, Cyber Monday, Pink Week
• Christmas
• Further clean up of inventory in advance of central
warehouse move in H1 2020
7.3 5.3 5.7 5.9 4.7 4.3 4.5
Q1/18 Q2/18 Q3/18 Q4/18 Q1/19 Q2/19 Q3/19
14Rest of Europe Revenues
Bebitus stabilized after focus on increasing product
margins at the expense of revenues for the past quarters
• +2% revenue growth quarter over quarter (Q3
Rest of Europe (Bebitus) 2019 compared to Q2 2019)
• Large sales events in Q4
in EUR million
• Black Friday, Cyber Monday, Pink week
• Christmas
8.1 6.6 4.7 4.5 3.8 3.2 3.3
Q1/17 Q2/18 Q3/18 Q4/18 Q1/19 Q2/19 Q3/19
15Quarter by quarter
Improvements regarding profitability, operating
contribution, costs and cash flow over time
Q1 Q2 Q3 Q4 Q1 Q2 Q3
9M 2018 9M 2019
2018 2018 2018 2018 2019 2019 2019
in EUR million
Operating 2.8
0.7
contribution 0.4 2.3 1.7
1.3 0.9 1.3
-0.1
-14.8
- -6.5 -5.8 -5.3 -4.8 -4.9 -4.6 -5.4
-17.7
Adj. Other SG&A
-2.5 -3.3
-4.0
= -5.2 -5.9
-4.9 -4.7
-16.0
-12.0
Adj. EBIT
2.7 4.4
-1.6 -3.4 -2.4
-4.1
-1.5
Change in cash -14.8 -16.2
16Group Profitability
Our 9M/Q3 2019 financials are improved in terms of gross
profit, cost structure and profitability
EUR million
Q3 2018 Q3 2019 9M 2018 9M 2019 Development
% of revenues
Revenues 22.2 18.5 78.6 59.4 Revenues in Q3 lower due to China
Q3 margin lower due to lower China
Gross profit1 22.2% 21.7% 23.8% 24.0% contribution
Higher share of orders fulfilled from
Fulfilment costs2 (15.8)% (13.7)% (17.0)% (14.5)% TMall through BWH
Marketing costs3 (4.8)% In line with expectation; Langtao
(4.4)% (4.7)% (4.7)%
cooperation started
Operating contr. 0.4 0.7 1.7 2.8
Contribution margin improved yoy
Operating contr. 1.8% 3.6% 2.1% 4.7%
Other SG&A4 (5.3) (5.4) (17.7) (14.8) Lower for 9 months in total; on avg.
below 5 million Euros per quarter
Other SG&A4 (24.0)% (29.1)% (22.7)% (25.0)%
Adj. EBIT5 (4.9) (4.7) (16.0) (12.0)
Adj. EBIT improved yoy
Adj. EBIT5 (22.2)% (25.5)% (20.5)% (20.2)%
Total Liquidity 12.8 9.7 12.8 9.7 Cash out in Q3 of EUR 2.4 million
Note: 1,2,3,4,5 see appendix for definitions
17Cash Flow
Inventory levels at similar level as previous quarters but
overall net working capital lower
Inventory (EUR million)
19.7
12.9
9.6
7.9 7.7 8.0
6.8
Mar-18 Jun-18 Sep-18 Dec-18 Mar-19 Jun-19 Sep-20
Days inventory (DIO) 71 65 51 33 45 46 51
Accrued advertising revenues +
vendors with credit balance 7.2 1.8 1.7 1.8 1.4 1.7 1.3
(EUR million)
Net Working Capital 19.1 9.2 6.8 5.9 7.2 8.1 6.3
(EUR million)
as % of LTM revenues 10.9% 6.1% 5.5% 5.6% 7.8% 9.1% 7.4%
Note: Net Working Capital (NWC) defined as inventories, prepayments, trade receivables, accrued advertising subsidies, vendors with credit balance, net VAT assets/liabilities minus trade payables and
deferred revenues.
Continuing operations presented (excl. Feedo Group). 18Liquidity
Net cash out of EUR 2.4 million in Q3 2019
In EUR million
Positive impact from EUR 1.8 million
reduction in net working capital Current level (Nov 11) EUR 7.6
million lower due to inventory build
up for upcoming sales events
12.1
-2.1 -0.3 9.7
-0.1
Total cash available Net cash flow from Net cash flow from Net cash flow from Total cash available
June 30, 2019 operating activities investing activities financing activities September 30, 2019
19Target to reach adj. EBIT break-even early 2020 but further
improvement in Q4 2019 necessary
Early
Q3 2019 2020
China
Adj. EBIT
break-
even
Europe
Adj. EBIT
EUR (4.9)
million
SG&A
Already lowered cost Increase revenues Increase revenues and profit
base: and profitability: contribution:
- New sourcing tool
Further organizational - Category selection - Category extension China
improvements - Warehouse move - New distribution channels growth
- 2nd bonded warehouse (done) strategy
- Company co-operations
- Potential VAT refund
20Capital increase in the high single-digit million Euro amount
planned to strengthen liquidity and finance growth in China
Steps Description Status/Timeline*
Resolutions at Reduction of share capital by way of reverse share split at ratio 10 : 3 EGM resolutions
passed but pending
Extraordinary
Capital increase shareholder actions
General Meeting that the company
(EGM) Creation of new Authorized Capital currently deals with
Capital decrease Registration of capital reduction in commercial register Not yet
and reverse
Technical implementation of consolidation of shares from 9,963,670 After registration in
share split commercial register
no-par value bearer shares to 2,989,101 shares
Subscription period (two weeks) After registration
Capital increase
Registration of the implementation of the Capital Increase with the Shortly after end of
commercial register and settlement subscription period
21Thank you
Appendix
Shareholder structure and supervisory board

Shareholder structure                                               Basic share data

                                                                     WKN                  WNDL19
                                                                     ISIN                 DE000WNDL193
                                                                     Market place         Frankfurt Stock
                                                                                          Exchange
                                                                     Type of share        No-par value bearer
                                                                                          shares
                                                                     Initial listing      May 6, 2015
                                                                     Designated Sponsor   Pareto Securities
                                                                     Number of shares     9,963,670
                                                                     as of August, 2019
                                                                     Share capital        EUR 9,963,670

Supervisory Board members
Willi Schwerdtle                 Xiao Jing Yu
(Chairman)                       (Russell Reynolds Associates)

Weijian Miao (Deputy Chairman)   Tomasz Czechowicz
(Summit Asset Management)        (MCI Capital)

Dr. Edgar Carlos Lange           Clemens Jakopitsch
(Lekkerland)                     (Behördenengineering Jakopitsch)                                             24
KPIs
Key performance indicators quarter over quarter
Q1 ’18 Q2 ’18 Q3 ’18 Q4’18 Q1‘ 19 Q2 ‘ 19 Q3’ 19
Excl. pannolini and Feedo
Site Visits
12,255 9,127 9,907 10,073 10.485 10,075 9,710
(in thousand) ¹
4
Mobile Visit Share
72.3% 71.8% 70.3% 75,3% 78.8% 73.6% 76.9%
(in % of Site Visits) 2
Mobile Orders
53.3% 55.2% 55.1% 58,7% 61.3% 60.4% 62.7%
(in % of Number of Orders) 3
Active Customers
742 681 615 544 493 455 438
(in thousand) 4
Number of Orders
330 283 244 258 201 179 187
(in thousand) 5
Average Orders per Active Customer
2.0 2.2 2.1 2,1 2.0 2.2 1.9
(in number of Orders) 6
Orders from Repeat Customers
302 233 192 195 145 131 133
(in thousand) 7
Share of Repeat Customer Orders
87.1% 74.9% 79.8% 82.6% 74.2% 73.0% 72.0%
(in % of Number of Orders) 7
Gross Order Intake
29,774 25,514 21,916 23,655 17.821 16.376 16,210
(in kEUR) 8
Average Order Value
90.17 90.01 89.96 91.84 88.81 91.69 86.72
(in EUR) 9
Returns (in % of Gross Revenues from orders) 10 3.4% 3.6% 4.3% 3.1% 3.4% 2.6% 2.9%
25Appendix
Income statement (continuing operations)
kEUR 9M 2018 9M 2019 Q3 2018 Q3 2019
Revenues 78,549 59,365 22,178 18,456
Cost of sales -60,167 -45,141 -17,255 -14,458
Gross profit 18,382 14,224 4,923 3,998
% margin 23.4% 24.0% 22.2% 21.7%
Selling and distribution expenses -29,573 -20,475 -7,936 -6,235
Administrative expenses -6,609 -6,289 -2,318 -2,220
Other operating income 773 573 294 260
Other operating expenses -639 -107 -183 -49
EBIT -17,666 -12,074 -5,220 -4,246
% margin -22.5% -20.3% -23.5% -23.0%
Financial result -15 -59 5 -17
EBT -17,681 -12,133 -5,215 -4,263
% margin -22.5% -20.4% -23.5% -23.1%
Income taxes -16 -7 -2 -4
Profit or loss from continuing operations -17,697 -12,140 -5,217 -4,267
% margin -22.5% -20.4% -23.5% -23.1%
Profit or loss from discontinued operations -10,575 49 -713 -
Profit or loss for the period -28,272 -12,091 -5,930 -4,267
EBIT -17,666 -12,074 -5,220 -4,246
Share-based compensation -323 27 64 -509
Acquisition, integration and expansion costs - 48 - 48
Reorganization 1,227 -14 169 -
Closure pannolini.it 771 - 57 -
Adjusted EBIT -15,991 -12,013 -4,930 -4,707
% margin -20.5% -20.2% -22.2% -25.5%
* Restated for presentation of discontinued operations in connection with the planned divestiture of Feedo Group, and restated for the effects of the first application of IFRS 9
. 26Appendix
Balance sheet and cash flow statement
Consolidated statement of financial position Consolidated statement of cash flows
September 30, December 31, 9M 9M Q3 Q3
kEUR 2019 2018 kEUR 2018 2019 2018 2019
Total non-current assets 4,578 5,345 Net cash flows from/used in
-17,261 -10,680 -3,477 -2,065
Inventories 8,014 6,820 operating activities
Prepayments 71 -
Net cash flows from/used in
1,371 357 -16 -76
Trade receivables 1,629 1,417 investing activities
Miscellaneous other current assets1 4,600 5,254
Net cash flows from/used in
Cash and cash equivalents 9,683 11,136 1,552 8,866 -38 -253
financing activities
Total current assets 23,997 24,627
Cash and cash equivalents at
Total assets 28,575 29,972 26,465 11,136 15,656 12,079
the beginning of the period
9,964 31,136 Net increase/decrease in
Issued capital -14,338 -1,457 -3,531 -2,394
cash and cash equivalents
Share premium 173,006 170,391
Accumulated loss -165,188 -181,119 Cash and cash equivalents
12,135 9,683 12,135 9,683
at the end of the period
Cumulated other comprehensive income 214 186
Total equity 17,996 20,594
Total non-current liabilities 86 38
Other provisions 139 235
Financial liabilities 621 39
Trade payables 4,064 4,573
Deferred revenue 2,233 1,581 1 Miscellaneous other current assets include income tax receivables, other current financial assets
and other current non-financial assets.
2
Miscellaneous current liabilities 3,436 2,912 2 Miscellaneous other current liabilities include income tax payables, other current financial liabilities
and other current non-financial liabilities.
Total current liabilities 10,493 9,340 3 Restated for the effects of the first application of IFRS 9
4 Restated for presentation of short-term time deposits
Total equity & liabilities 28,575 29,972
27Definitions of key performance indicators
1) We define site visits as the number of series of page requests from the same device and source in the measurement period and include visits to our online
magazine. A visit is considered ended when no requests have been recorded in more than 30 minutes. The number of site visits depends on a number of factors
including the availability of the offered products, the effectiveness of our marketing campaigns and the popularity of our online shops. Measured by Google
Analytics.
2) We define mobile visit share (as % of site visits) as the number of visits via mobile devices (smartphones and tablets) to our mobile optimized websites and
mobile apps divided by the total number of site visits in the measurement period. Site visits of our online magazine are excluded. Additionally, we excluded visits
from China until end of 2016, because the most common online translation services on which most of our customers who order for delivery to China rely to
translate our website content are not able to do so from their mobile devices. Therefore, only few Chinese customers ordered via their mobile devices. Due to the
launch of our website in Chinese language in December 2016, site visits from China are included since Q1 2017. Measured by Google Analytics.
3) We define mobile orders (as % of number of orders) as the number of orders via mobile devices to our mobile optimized websites and mobile apps divided by
the total number of orders in the measurement period. Since Q1 2017, orders from China are included. Measured by Google Analytics.
4) We define active customers as the number of unique customers placing at least one order in one of our shops in the 12 months preceding the end of the
measurement period, irrespective of returns..
5) We define number of orders as the number of customer orders placed in the measurement period irrespective of returns. An order is counted on the day the
customer places the order. Orders placed and orders delivered may differ due to orders that are in transit at the end of the measurement period or have been
cancelled. Every order which has been placed, but for which the products in the order have not been shipped (e. g., the products are not available or the
customer cancels the order), is considered ‘‘cancelled’’. Cancellations are deducted from the number of orders.
6) We define average orders per active customer as number of orders divided by the number of active customers in the last 12 months.
7) We define orders from repeat customers as the number of orders from customers who have placed at least one previous order, irrespective of returns. The share
of repeat customer orders represents the number of orders from repeat customers in the last twelve months divided by the number of orders in the last twelve
months.
8) We define gross order intake as the aggregate Euro amount of customer orders placed in the measurement period minus cancellations. The Euro amount
includes value added tax and excludes marketing rebates.
9) We define average order value as gross order intake divided by the number of orders in the measurement period..
10) We define returns (as % of gross revenues from orders) as the returned amount in Euro divided by gross revenues from orders in the measurement period.
Since Q2 2016 including Bebitus returns. Gross revenues from orders are defined as the total aggregated Euro amount spent by our customers minus
cancellations but irrespective of returns. The Euro amount does not include value added tax. Until Q1 2017 returns were calculated in relation to the net
merchandise value. As the gross revenues from orders do not exclude returns and include all marketing rebates/discounts, it is more reasonable to use this KPI
for the return rate calculation than the net merchandise value. The change of the calculation logic has no material impact on the reported return rate. The new
calculation method is applied from Q2 2017 onwards.
28Footnotes to page 17
Note: Adjusted continuing operations shown (i.e. excluding discontinued operation Feedo Group).
1 The adjustments of gross profit relate to income expenses of the shop pannolini.it until the shops closure, and expenses for share-based compensation.
2 Fulfilment costs consist of logistics and warehouse rental expenses which are recognized within selling and distribution expenses in the consolidated statement of profit
and loss. Fulfilment expenses incurred in the shop pannolini.it are adjusted until the shops closure. In 2017, costs related to the closure of the Swiss location and
income from the release of provisions for onerous contracts are adjusted.
3 Marketing costs mainly consist of advertising expenses, including search engine marketing, online display and other marketing channel expenses, as well as costs for
the marketing tools of the Group. Marketing expenses incurred in the shop pannolini.it are adjusted until the shops closure.
4 Other selling, general and administration expenses (other SG&A expenses) consist of selling and distribution expenses, excluding marketing costs and fulfilment costs,
and administrative expenses as well as other operating income and expenses. Adjusted SG&A expenses exclude expenses from share-based compensation,
reorganization measures, impairments of intangible assets and income and expenses incurred in the shop pannolini.it until the shops closure. Furthermore, expenses
for the integration of subsidiaries were adjusted in 2017.
5 Adjusted for expenses and income in connection with share-based compensation, reorganization measures, impairments of intangible assets and income and
expenses of the closed shop pannolini.it. In 2017, expenses for the integration of subsidiaries were adjusted.
29You can also read