Six-Year Trends on Prevalence of Myopia among School Children in Liuyang, Central South China: Screening Data from 2013 to 2018
←
→
Page content transcription
If your browser does not render page correctly, please read the page content below
Six-Year Trends on Prevalence of Myopia among School Children in Liuyang,
Central South China: Screening Data from 2013 to 2018
MengShi Chen
Central South University Xiangya School of Public Health
Xin Xu
Liuyang Center for Disease Control and Prevention
Julius Abesig
Central South University Xiangya School of Public Health
HuaJun Long
Liuyang Center for Disease Control and Prevention
Huan Wang
Central South University Xiangya School of Public Health
YanCong Chen
https://orcid.org/0000-0003-4960-0413
YuTing Xiong
Liuyang Center for Disease Control and Prevention
Hong Zhang
Liuyang Center for Disease Contral and Prevention
Tiao Li
Liuyang Center for Disease Control and Prevention
Irene XY Wu ( irenexywu@csu.edu.cn )
Central South University Xiangya School of Public Health
Research article
Keywords: Myopia, Prevalence, School children, China
Posted Date: June 1st, 2020
DOI: https://doi.org/10.21203/rs.3.rs-29869/v1
License: This work is licensed under a Creative Commons Attribution 4.0 International License. Read Full License
Page 1/10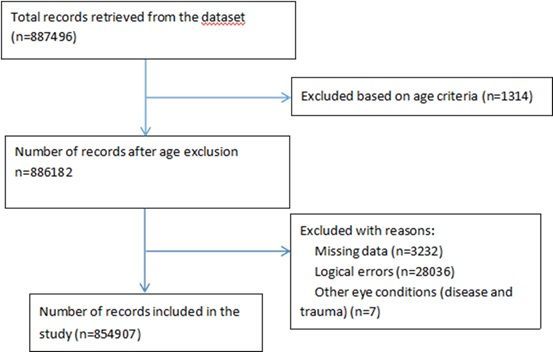
Abstract
Background
Myopia is the most common and leading cause of eye problems affecting people of all ages and yet a preventable cause of blindness. The prevalence of
myopia in China varied a lot, and related study is lacking from Central South China. So the purpose of this study was to investigate the trends in the
prevalence of myopia among under-college school children from 2013 to 2018 in Liuyang district, Central South of China.
Methods
This was a population-based retrospective study. Uncorrected visual acuity test with the Standard Logarithmic Visual Acuity E chart was used to detect
myopia. The yearly age-specific prevalence was calculated and compared.
Results
A total of 854907 children from Grade 1 to 12 were included. The prevalence of myopia increased from 24.3% (2013) to 35.9% (2018), with a significant trend
of increase (p < 0.001). Persistence higher prevalence was seen in girls than boys, urban dwellers than rural dwellers, and senior high school than that of junior
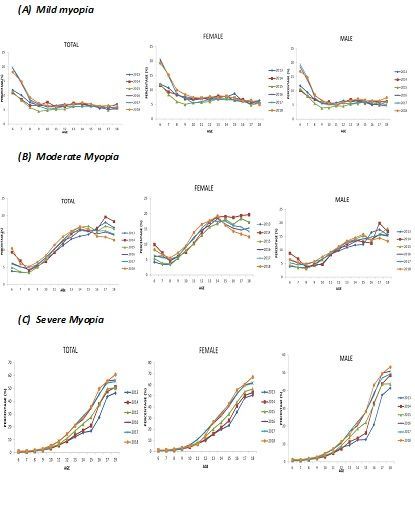
high or primary school children. Significant increase trends in the prevalence of severe myopia were seen across time (from year 2013 to 2018) in each age
group among students from 11 to 18 years old (p < 0.001).
Conclusions
There was a remarkable yearly increase in myopia prevalence among school children of all ages and across all grades in China from 2013 to 2018, especially
in female, urban and high school students. It is urgently needed for an effective public health intervention for the control of myopia among all Chinese school
children.
Background
Myopia is the most common and leading cause of eye problems affecting people of all ages and yet a preventable cause of blindness 1. There have been
tremendous increases in myopia prevalence in most parts of the world recently, especially among school children due to the increase pressure in education.
This increase is however with variation in different parts of the world, East Asia and South Asia are among the most hit 1, 2. About 80% of the global myopia
prevalence among children 0–19 years can be found in Asia with 35% of the cases in Southeast Asia 3. There exists a varying prevalence among Asian
countries. The lowest prevalence was reported in Laos and Nepal, with the myopia prevalence of 0.8% among 6 to 11 years old children4 and 1.2% among 5 to
15 years old children5 respectively. Contrarily, high prevalence was reported from China2, with the highest prevalence of 86.5% reported among adolescents of
13–17 years old from Yangxi, rural southern China 6.
However, the prevalence of myopia in China varied a lot, from 2.5% among 3 to 6 years old children in Guangzhou7 to 86.5% in Yangxi 6. Furthermore, dramatic
increases were reported in individual studies among children across China during the past several years, with 14.9% among 5 to 15-year-olds in Beijing 8, 9 and
82.7% among 13 to 18-year-olds adolescents in Anyang10. Although the variation of myopia prevalence observed among different studies could be
contributed to the heterogeneity of age, population, area and different criteria or test for myopia. Time trend is another potential contributor for the variation in
myopia prevalence 11.
As large variation in myopia prevalence was seen among different regions in China2, and related study is lacking from Central South China, it is worthwhile to
investigate the myopia prevalence in this region. In this current study, we analyzed the longitudinal screening data obtained from primary to senior high school
students in Liuyang district, Hunan province, China from 2013 to 2018, to determine the time series trends in myopia prevalence among school children, and to
explore the potential impact factors along the education continuum to provide additional evidence from Central South China for early management, prevention
and control of myopia in China.
Materials And Methods
Study population
A retrospective study was conducted from 2013 to 2018 in Liuyang, which is a county-level city located in the Northeast of Hunan province, China. Liuyang
has jurisdiction of 4 city districts and 33 towns, including 1.49 million populations. Liuyang was ranked as 19th among the ‘top 100 national strong counties’
in China in 201612. From 2006, Liuyang Health Bureau has appointed the Liuyang Center for Disease Control and Prevention (CDC) to conduct annual physical
examination among school students from grades 1 to 12. As a health policy aimed to improve the health of school children, the annual physical examination
is requested to cover all the students in primary, junior and senior high schools under Liuyang jurisdiction. As part of the yearly compulsory routine physical
examination that all students are requested to undergo, the eye examination records of all students were routinely collected each year by Jili hospital (also
named as Liuyang Eye Hospital) in Liuyang City. The facility mandated for the physical examination for the students in the district. In this study, data related
to the eye examination from 2013 to 2018 were retrieved for analysis.
Page 2/10All students’ records were electronically registered by file numbers, name, gender, age, ethnicity, school, and address. All the data were submitted to the
Liuyang CDC, the institution that was in charge of the physical examination. The Liuyang CDC is the custodian of the database and data retrieval was
conducted with de-identification of all students in May 2019, with the official permission from the Liuyang CDC.
Ethical approval
Since this study was based on routing data with all the subjects being de-identified. Ethical approval was waved from the Xiangya School of public health,
Central South University and Liuyang CDC. The study followed the guidelines of the Declaration of Helsinki13.
Data collection
The following data were retrieved from the dataset: age, sex, residency type (rural/urban), education level, height, weight and results of eye examination.
Details about height and weight measurements were presented in Appendix 1. Any record with missing data regarding the above listed variables, logic errors or
had an age lower than 6 or larger than 18 was excluded from the final data analysis.
Eye examination
The Eye examination was conducted by an experienced group of ophthalmologists optometrists and nurses according to the Chinese National standard for
students’ physical examination (GB11533). All were staffs from the department of ophthalmology in Jili Hospital. Each student’s uncorrected visual acuity
(UCVA) was measured monocularly at a distance of 5 meters using the Standard Logarithmic Visual Acuity (LogMAR) Chart with tumbling-E optotypes under
room lighting. The acuity of the LogMAR Chart that can be measured ranges from 4.0 to 5.3. If a score lower than 5.0 UCVA and a slit lamp examination as
well excluded opacity of optical media and other eye conditions, then it was recorded abnormal vision (myopia). Students who have UCVA lower than 5.0, were
further classified as slight myopia (4.9≤UCVA0.001) (Appendix 3) between the left and right eyes was reported 15.
Myopia prevalence was calculated one-time for each year and by age group from 2013 to 2018. Line graphs were used to describe and compare the annual
prevalence trends of myopia, within each sex and one-year time age interval (6 to 18years) from 2013 to 2018. Linear-by-Linear association test was used to
test the trends of myopia prevalence at each age group with the increase of age (from 6 years to 18 years) and year going on (from 2013 to 2018). Differences
in myopia prevalence among different groups were compared with Chi-squared test. Multivariable logistic regression analysis was used to identify the
association between demographic variables and myopia within each year from 2013 to 2018, and the total population. Among each logistic regression
analysis, myopia status was used as the dependent variables; sex, BMI status, grade and residency type were used as the independent variables. Sensitivity
analyses on multivariable logistic regressions were conducted by excluding students from senior high schools as enrollment rates decreased from over 99% in
primary school and junior high school to around 88% in senior high school 16, and a relative low eye examination rate was observed in senior high school. Age
was not included in the logistic regression for its collinearity with grade group. The model fitting was checked with Hosmer and Lemeshow (HL) test, with P-
value greater than 0.1 being considered as adequate model fit. Adjusted Odds Ratio (OR) with 95% confidence interval (CI) was calculated. A P-value of less
than 0.05 (two-tailed) was accepted as statistically significant (except for HL test). All data analyses were performed using SPSS statistics version 21.0 (SPSS
Inc., Chicago, Illinois, USA) and Graphical presentations by Microsoft Excel version 10.
Result
Characteristics of the study population
A total of 887,496 records from the dataset, after excluded records based on the inclusion criteria, 854,907 records were included in the final data analysis
(Figure 1). By comparing with the statistical data from the Liuyang Education Bureau, from 2015 to 2018, 95.00%-96.71% students from primary school,
92.81%-94.22% students from junior high school, and 45.98%-98.22% students from junior high school received the physical examination and were included in
this study (Appendix 4). Statistical data on total number of students in 2013 and 2014 is not available.
There were more students from primary school (ranged from 59.6% in 2018 to 69.3% in 2014) than that of junior high school (ranged from 22.2% in 2013 to
27.1% in 2015) and senior high school (ranged from 5.2% in 2014 to 14.2% in 2018). There were more students from rural area each year, with the proportion
ranged from 71.9% (year 2013) to 74.9% (year 2014). Male students account for an average of around 50.9%, with a stable gender proportion across the
Page 3/10studied six years (Table 1, Appendix 5). There is a slight trend in the prevalence of overweight and obesity from 2013 (11.9%) to 2018 (14.1%). Details regarding the demographic characteristics and distribution on schools of the students for each year from 2013 to 2018 are presented in Table 1. Results of UCVA score from 2013 to 2018 Generally slight trends of decreasing in mean UCVA score were observed from 2013 to 2018 among each age group. Furthermore, the decreasing trends in mean UCVA score were more obvious as the students grow, with the mean UCVA score of 4.99 (SD=0.12) on 6 years old and of 4.53 (SD=0.41) on 18 years old (Appendix 6). Prevalence of myopia from 2013 to 2018 The total prevalence of myopia increased each year from 2013 (24.3%) to 2018 (35.9%), with a significant trend of increase in myopia prevalence across the past six years (p
Table 1
                           Demographic characteristics and distribution on schools of the students for each year from 2013 to 2018
                        2013             2014              2015               2016                 2017                  2018                Total              p-
                                                                                                                                                                value

No. of Students

Residency Type (%)

Rural                   66782 (71.9)     96683 (74.9)      105125 (73.1)      112477 (73.1)        122599 (74.1)         122688 (72.3)       626354 (73.3)      0.001

Urban                   26163 (28.1)     32425 (25.1)      38614 (26.9)       41437 (26.9)         42960 (25.9)          46954 (27.7)        228553 (26.7)

Gender (%)

Female                  44989 (48.4)     63209 (49.0)      70437 (49.0)       75761 (49.2)         81660 (49.3)          83526 (49.2)        419582 (49.1)      0.001

Male                    47956 (51.6)     65899 (51.0)      73302 (51.0)       78153 (50.8)         83899 (50.7)          86116 (50.8)        435325 (50.9)

BMI Status (%)

Underweight             9385 (10.1)      13340 (10.3)      14642 (10.2)       16240 (10.6)         15420 (9.3)           14103 (8.3)         83130 (9.7)

Normal                  72499 (78.0)     100860 (78.1)     112441 (78.2)      119949 (77.9)        128854 (77.8)         131604 (77.6)       666207 (77.9)      0.001

Overweight              5659 (6.1)       7484 (5.8)        8500 (5.9)         9174 (6.0)           10749 (6.5)           11842 (7.0)         53408 (6.2)

Obesity                 5402 (5.8)       7424 (5.8)        8156 (5.7)         8551 (5.6)           10536 (6.4)           12093 (7.1)         52162 (6.1)

Grade Group

Primary School          64179 (69.1)     89452 (69.3)      94581 (65.8)       96726 (62.8)         99780 (60.3)          101148 (59.6)       545866 (63.9)

Junior High School      20624 (22.2)     32902 (25.5)      38890 (27.1)       40530 (26.3)         42755 (25.8)          44371 (26.2)        220072 (25.7)      0.001

Senior High School      8142(8.8)        6754(5.2)         10268(7.1)         16658 (10.8)         23024 (13.9)          24123 (14.2)        88969 (10.4)

Age Group (%)

6–12 years              68648(73.9)      95046 (73.6)      100150 (69.7)      102700 (66.7)        105536 (63.7)         107083 (63.1)       579163 (67.7)

13–15 years             17104 (18.4)     27720 (21.5)      35078 (24.4)       38583 (25.1)         41512 (25.1)          42617 (25.1)        202614 (23.7)      0.001

16–18 years             7193 (7.7)       6342 (4.9)        8511 (5.9)         12631 (8.2)          18511 (11.2)          19942 (11.8         73130 (8.6)

Total No. of            92945            129108            143739             153914               165559                169642              854907
students                (100.0)          (100.0)           (100.0)            (100.0)              (100.0)               (100.0)             (100.0)

No. Of Schools

Primary School          185              187               193                200                  205                   210                 1180

Junior High School      51               51                52                 52                   51                    52                  309                n.a

Senior High School      11               11                12                 12                   13                    15                  74

Total No. of            247              249               257                264                  269                   277                 1563
Schools

                                                                                            Table 2
                                         Prevalence rate of myopia among school children in each educational level for boys and girls from 20113 − 2018
Year      Primary School                                 Junior High School                                  Senior High School

          Girls (%)        Boys(%)        Total          Girls (%)        Boys(%)          Total             Girls (%)          Boys(%)           Total         Girls (%)

2013      5542(17.8)       5047(15.3)     10589(16.5)    3904(40.4)       3094(28.3)       6998(33.9)        2842(68.4)         2118(53.2)        4960(60.9)    12288(2

2014      8229(18.8)       7077(15.5)     15306(17.1)    6853(43.6)       5381(31.3)       12234(37.2)       2835(74.8)         1990(67.1)        4825(71.4)    17917(2

2015      7969(17.4)       6889(14.1)     14858(15.7)    9357(49.2)       7080(35.6)       16437(42.3)       4027(72.8)         2805(59.2)        6832(66.5)    21353(3

2016      10459(22.4)      9090(18.2)     19549(20.2)    10510(53.2)      7931(38.2)       18441(45.5)       6923(74.8)         4621(62.5)        11544(69.3)   27892(3

2017      10603(22.0)      9245(17.9)     19848(19.9)    11522(54.9)      8476(38.9)       19998(46.8)       9675(77.0)         6573(62.9)        16248(70.6)   31800(3

2018      11876(24.6)      10182(19.3)    22058(21.8)    12227(56.0)      9035(40.1)       21262(47.9)       10375(78.0)        7209(66.6)        17584(72.9)   34478(4

*Linear-by-Linear association test for the prevalence of myopia from 2013 to 2018 among students in primary schools, in junior high schools, senior high sch
students: all the p-values are less than 0.001.

                                                                          Page 5/10
Table 3
Association between demographic characteristics and myopia from 2013 to 2018: logistic regression analyses
Factors 2013 2014 2015 2016 2017 2018
OR 95% p OR 95% p OR 95% p OR 95% p OR 95% P OR
CI CI CI CI CI
Sex*
Female 1.42 1.39– < .001 1.42 1.38– < .001 1.49 1.46– < .001 1.53 1.49– < .001 1.59 1.56– < .001 1.60
1.47 1.46 1.53 1.56 1.63
Residency†
Urban 1.88 1.82– < .001 1.84 1.79– < .001 1.88 1.83– < .001 1.66 1.62– < .001 1.99 1.94– < .001 1.76
1.95 1.89 1.95 1.75 2.04
Education
level‡
Junior high 2.76 2.66– < .001 2.26 2.12– < .001 2.83 2.67- < .001 5.02 4.59– < .001 3.66 3.57– < .001 3.38
2.86 2.39 3.00 5.47 3.75
Senior high 8.39 7.98– < .001 4.98 4.04– < .001 4.39 3.92– < .001 1.39 1.32– < .001 9.95 9.63– < .001 9.55
9.83 6.16 4.93 1.48 10.29
BMI status§
Overweight 1.16 1.08– < .001 1.16 1.10– < .001 1.13 1.07– < .001 1.11 1.06– < .001 1.10 1.05– < .001 1.07
1.24 1.23 1.20 1.67 1.15
Obesity 1.18 1.10– < .001 1.16 1.10– < .001 1.20 1.13– < .001 1.15 1.09– < .001 1.12 1.06– < .001 1.10
1.26 1.23 1.27 1.21 1.16
Underweight 0.94 0.89– < .018 0.91 0.87– < .001 0.96 0.92- < .001 0.91 0.88– . 0.93 0.89– .Secondly, this study focused on school children, although the Nine-year compulsory education policy is well implemented in China, and the national
enrollment rate was over 99% in primary school and junior high school, and was over 88% in senior high school since 2012 16. The results should not be
extrapolated to the children with the same age while are not enrolled in the under-college education. Furthermore, the increase prevalence in senior high school
could also be contributed by selection bias due to the decreased low enrollment rate. Further cohort studies are needed to confirm the net risk of increase
education level to the development of myopia. However, as the prevalence was calculated based on majority of the high school students, especially after 2017,
the results indicated immediate public health strategies are needed to improve the eye health among school students.
Lastly, the coverage of the examination among the targeted children might impact the validity of the results. Based on the official statistical data from 2015 to
2018, we believe that we sampled the majority of the students in primary and junior high school. Selection bias might be existed among students in senior
high school before 2016. Based on the data from 2017 and 2018 that had optimal coverage for senior high school students, similar trend of increase in
myopia prevalence was observed with the results before 2016.
Conclusions
There was a marked yearly increase of myopia prevalence among school children of all ages and across all grades in China from 2013 to 2018, prominent
especially in high school. Similar increase trends were seen in severe myopia within the past six years. Girls showed higher prevalence of myopia than that of
boys with each age group, especially in high school. It is urgently needed of evidence-proved effective strategies/ public health intervention programs for the
control of myopia and myopia correction among all Chinese school children.
Abbreviations
Body mass index (BMI); Center for Disease Control and Prevention (CDC); Confidence interval (CI); Hosmer and Lemeshow (HL); Odds Ratio (OR); Standard
deviations (SD); Uncorrected visual acuity (UCVA).
Declarations
Ethics approval and consent to participate:
Since this study was based on routing data with all the subjects being de-identified. Ethical approval was waved from the Xiangya School of public health,
Central South University and Liuyang CDC. The study followed the guidelines of the Declaration of Helsinki13.
Consent for publication:
Not applicable.
Availability of data and materials:
Relevant supporting data aside those found in the main text will be available from the corresponding author on request.
Competing interests:
None of the following authors have any proprietary interests or conflicts of interest related to this submission.
Funding:
This research was supported by the High-level Talents Introduction Plan from Central South University (No. 502045003) and The Hunan Nature Science
Foundation (No. 2019JJ40348).
Authors' contributions:
MSC, XX, XYW conceived the idea for and designed this study; HJL, YTX, TL and HZ conducted the study; JA, HW and YCC performed the statistical analysis;
JA wrote the first draft of the manuscript and XYW revised the article. All authors critically revised and approved the final manuscript.
Acknowledgement:
We gratefully acknowledge the valuable contribution of the staff of education commission, Jili eye hospital and the Liuyang centers for disease control and
prevention.
References
Page 7/101. Holden BA, Fricke TR, Wilson DA, Jong M, Naidoo KS, Sankaridurg P, et al. Global Prevalence of Myopia and High Myopia and Temporal Trends from 2000
through 2050. Ophthalmology. 2016; 123:1036-42.
2. Hashemi H, Fotouhi A, Yekta A, Pakzad R, Ostadimoghaddam H, Khabazkhoob M. Global and regional estimates of prevalence of refractive errors:
Systematic review and meta-analysis. J Curr Ophthalmol. 2018; 30:3-22.
3. Rudnicka AR, Kapetanakis VV, Wathern AK, Logan NS, Gilmartin B, Whincup PH, et al. Global variations and time trends in the prevalence of childhood
myopia, a systematic review and quantitative meta-analysis: implications for aetiology and early prevention. Br J Ophthalmol. 2016; 100:882-90.
4. Casson RJ, Kahawita S, Kong A, Muecke J, Sisaleumsak S, Visonnavong V. Exceptionally Low Prevalence of Refractive Error and Visual Impairment in
Schoolchildren from Lao People's Democratic Republic. Ophthalmology. 2012; 119:2021-7.
5. Pokharel GP, Negrel AD, Munoz SR, Ellwein LB. Refractive error study in children: results from Mechi Zone, Nepal. American Journal of Ophthalmology.
2000; 129:436-44.
6. He M, Huang W, Zheng Y, Huang L, Ellwein LB. Refractive Error and Visual Impairment in School Children in Rural Southern China. Ophthalmology. 2007;
114:374-82.e1.
7. Lan W, Zhao F, Lin L, Li Z, Zeng J, Yang Z, et al. Refractive errors in 3-6 year-old Chinese children: a very low prevalence of myopia? PloS one. 2013;
8:e78003-e.
8. Guo Y, Duan JL, Liu LJ, Sun Y, Tang P, Lv YY, et al. High myopia in Greater Beijing School Children in 2016. PLoS One. 2017; 12:e0187396.
9. Guo Y, Liu LJ, Xu L, Lv YY, Tang P, Feng Y, et al. Outdoor activity and myopia among primary students in rural and urban regions of Beijing.
Ophthalmology. 2013; 120:277-83.
10. Li H, Li S, Liu L, Li S, Kang M, Ji Y, et al. [Distribution of refraction and ocular biometric parameters in a population of junior middle school children in
Anyang of Henan province]. Zhonghua yi xue za zhi. 2014; 94:1284-8.
11. Chen M, Wu A, Zhang L, Wang W, Chen X, Yu X, et al. The increasing prevalence of myopia and high myopia among high school students in Fenghua city,
eastern China: a 15-year population-based survey. BMC Ophthalmol. 2018; 18:159.
12. Tengxun Web. List of top 100 national strong counties has been released [in Chinese]. 2016 [cited 2019 5th October]; Available from:
https://baike.baidu.com/reference/1006909/ab3bT4sMu_6FGWdJ3GUMYc7RpTtWPm78rgmsfD8sgzh78Wq51-qlPBWUMfrTc2c-Qzx6NmPbB79Wh6Y-
GmFXx7xjzg.
13. Sun JT, An M, Yan XB, Li GH, Wang DB. Prevalence and Related Factors for Myopia in School-Aged Children in Qingdao. J Ophthalmol. 2018;
2018:9781987.
14. de Onis M, Onyango AW, Borghi E, Siyam A, Nishida C, Siekmann J. Development of a WHO growth reference for school-aged children and adolescents.
Bull World Health Organ. 2007; 85:660-7.
15. Ma Y, Zou H, Lin S, Xu X, Zhao R, Lu L, et al. Cohort study with 4-year follow-up of myopia and refractive parameters in primary schoolchildren in Baoshan
District, Shanghai. Clin Exp Ophthalmol. 2018; 46:861-72.
16. Ministry of Education of the People's Republic of China. Statistical Communiqué on National Education Development in 2018. 2019 [cited 2020 3 March];
Available from: http://www.moe.gov.cn/jyb_sjzl/sjzl_fztjgb/201907/t20190724_392041.html.
17. Lin L, Shih Y, Hsiao C, Chen C. Prevalence of myopia in Taiwanese schoolchildren: 1983 to 2000. Ann Acad Med Singapore. 2004; 33:27-33.
18. Wu JF, Bi HS, Wang SM, Hu YY, Wu H, Sun W, et al. Refractive error, visual acuity and causes of vision loss in children in Shandong, China. The Shandong
Children Eye Study. PloS one. 2013; 8:e82763-e.
19. Hyman L, Gwiazda J, Hussein M, Norton TT, Wang Y, Marsh-Tootle M, et al. Relationship of Age, Sex, and Ethnicity with myopia progression and axial
elongation in the correction of myopia trial. Arch Ophthalmol. 2005; 2005;123:977:977.
20. Wei S, Sun Y, Li SM, Hu J, Cao K, Du J, et al. Visual impairment and spectacle use in university students in central China: The Anyang University Students
Eye Study. Am J Ophthalmol. 2019.
21. Chiang SY, Weng TH, Lin CM, Lin SM. Ethnic disparity in prevalence and associated risk factors of myopia in adolescents. J Formos Med Assoc. 2019.
22. Hu M, Zhou Y, Huang S, Congdon N, Jin L, Wang X, et al. Population prevalence of myopia, glasses wear and free glasses acceptance among minority
versus Han schoolchildren in China. PLoS One. 2019; 14:e0215660.
23. Li T, Zhou X, Chen X, Qi H, Gao Q. Refractive Error in Chinese Preschool Children: The Shanghai Study. Eye Contact Lens. 2019; 45:182-7.
24. Dolgin E. The myopia boom Short-sightedness is reaching epidemic proportions. Some scientists think they have found a reason why. Nature. 2015;
519:276-8.
25. Guo K, Yang DY, Wang Y, Yang XR, Jing XX, Guo YY, et al. Prevalence of myopia in schoolchildren in Ejina: the Gobi Desert Children Eye Study. Invest
Ophthalmol Vis Sci. 2015; 56:1769-74.
26. He M, Xiang F, Zeng Y, Mai J, Chen Q, Zhang J, et al. Effect of Time Spent Outdoors at School on the Development of Myopia Among Children in China: A
Randomized Clinical Trial. JAMA. 2015; 314:1142-8.
27. Tong L, Saw SM, Tan D, Chia KS, Chan WY, Carkeet A, et al. Sensitivity and specificity of visual acuity screening for refractive errors in school children.
Optometry and vision science : official publication of the American Academy of Optometry. 2002; 79:650-7.
28. Cox TA, Naidoo KS, Ellwein LB, Group RW. The Relationship Between Visual Acuity and Myopia in Children. Investigative Ophthalmology & Visual Science.
2005; 46:5615-.
29. Leone JF, Mitchell P, Morgan IG, Kifley A, Rose KA. Use of Visual Acuity to Screen for Significant Refractive Errors in Adolescents: Is It Reliable? JAMA
Ophthalmology. 2010; 128:894-9.
Page 8/1030. Wu X, Pei C, Hua W, Yang J, Jiang X, Jin J, et al. Comparison studies of the screening methods of school myopia in children and adolescents [in Chinese].
Chinese Journal of School Health. 2018; 39:1613-6.
Figures
Figure 1
Flow chart of participant’s inclusion and exclusion
Figure 2
Myopia Prevalence from 2013 -2018
Page 9/10Figure 3
Levels of Myopia Prevalence among Students
Supplementary Files
This is a list of supplementary files associated with this preprint. Click to download.
Appendix19.pdf
Page 10/10You can also read


