ESSA School Performance Score Updates - Louisiana Believes
←
→
Page content transcription
If your browser does not render page correctly, please read the page content below

ESSA School Performance Score Updates

Agenda

• ESSA Plan Development

• Proposal for Elementary and Middle Schools

• Proposal for High Schools

• Review of Combination Schools

• Transition Proposal

• Upcoming Policy Considerations

• Resources and Next Steps

                                               2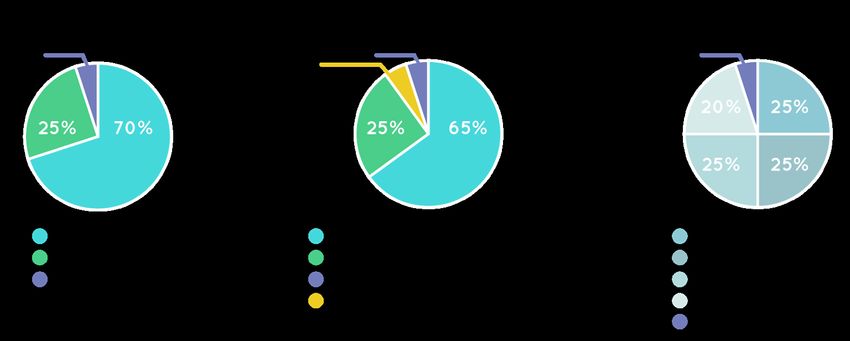
ESSA in Louisiana

• On July 1, 2017, the Every Student Succeeds Act (ESSA) replaces the No Child Left Behind
  as the country’s federal education law. The law will be in effect when the 2017-2018
  school year begins.

• ESSA provides Louisiana with an opportunity to collaborate with educators, parents,
  business and community leaders to create an improved K-12 education system that
  provides all students with equal access and opportunity to high-quality learning.

• ESSA requires that every state capture these improvements in a state plan that is
  submitted to the federal government.

• Louisiana intends to submit this state plan to the U.S. Department of Education on April 3,
  2017 with the goal of receiving feedback and final approval of the plan prior to the start of
  the 2017-2018 school year in order to provide educators and families with clarity and
  consistency.

                                                                                                  3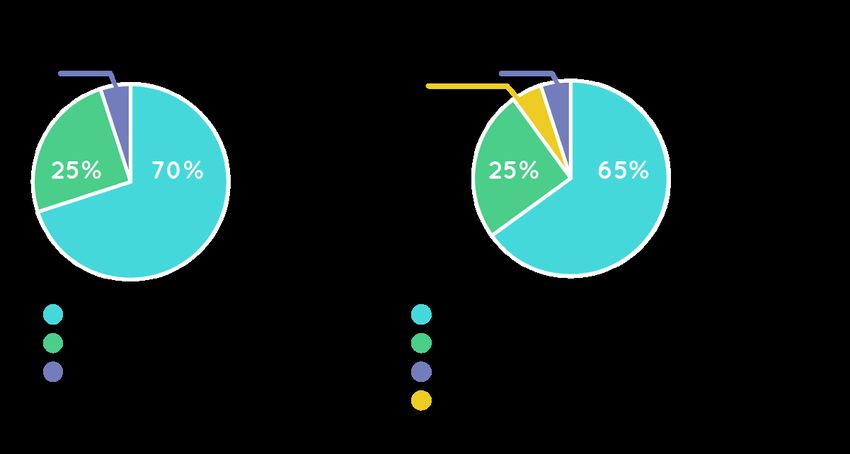
Louisiana’s ESSA Plan Development

• After engaging with stakeholders for months, the Department released a draft ESSA
  framework on September 28, to provide the general public with examples of what policies,
  supports, and resources could be used to provide targeted support for disadvantaged
  students.

• Since that release, the Department has been in continuous conversations with educators,
  advocacy groups, civic leaders and others to refine the proposals within the framework.

• During this time, the Louisiana Accountability Commission has also been meeting to make
  recommendations regarding the state’s accountability system. To view the Commission’s
  recommendations, you can view previous meeting videos and presentations in the
  Accountability library.

• On Monday, February 6, the Department released an updated framework that included
  greater detail from the initial framework as well as stakeholder feedback.

• On February 20, the Department released the draft state plan for public comment.

                                                                                             4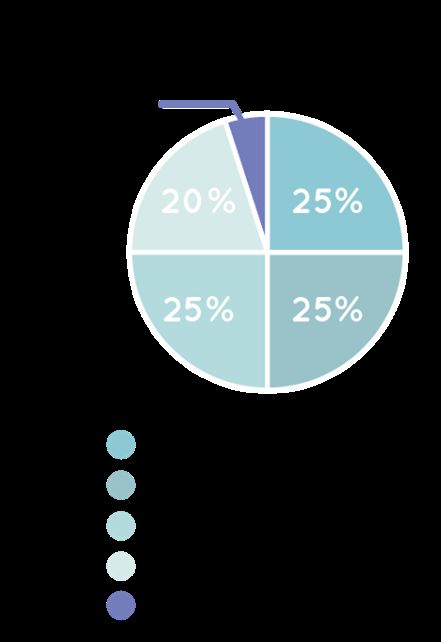
Development Timeline

In developing its recommendations for accountability system changes under ESSA, the
Commission considered numerous models and metrics in order to address priority issues
within student achievement and as articulated by stakeholders over the past five years.
Commission recommendations were developed over the course of eight meetings across
nine months.

•   February 17, 2017
•   February 8, 2017
•   January 9, 2017
•   December 5, 2016
•   November 1, 2016
•   October 17, 2016
•   September 12, 2016
•   June 27, 2016

                                                                                          5
Guiding Beliefs
Louisiana’s students—all of them, no matter race, disability, or creed—are as smart and
capable as any in America. They have gifts and talents no lesser than those given to any
children on this earth.
Louisiana has worked hard to raise expectations for students, and as a result, students are
performing at higher levels than ever before.
While Louisiana has made great strides in increasing life opportunities for its students,
there remain serious challenges in Louisiana’s schools. Often these challenges are
experienced to the greatest extent by children of historically disadvantaged backgrounds.
As educators, we have a powerful role to play in helping all students overcome the
challenges they will experience on the way to leading healthy and productive lives as
adults.
6Improvements to Louisiana’s K-12 System
The updated ESSA framework, highlights several unique improvements to Louisiana’s K-12
system:
• raise fundamental expectations for students to be equal with their peers across the
country;
• reduce end-of-year state testing, while simultaneously improving the quality and depth of
information provided to educators and families;
• recognize growth for all students;
• allow students taking the LAA 1 the opportunity to earn diplomas into the state graduation
rate;
• deliver targeted funding to students and schools who are the most in need;
• foster and fund relationships between persistently struggling schools and partners that
have demonstrated success in turning around struggling schools;
• place future teachers in classrooms under a mentor educator for full–year, classroom-
based residencies that prepare them for day one in their own classrooms; and
• provide every student with enriching experiences and a well rounded education that is
recognized in the state’s accountability system.
7Improvements to Louisiana’s Accountability System
These formulae represent three critical shifts in the design of the accountability system.
1. Ensuring an “A” in Louisiana’s letter grade system signals mastery of fundamental
skills. This will be achieved by raising expectations for what is required in order for
a school to earn A-level points based on student achievement and growth.
2. Adjusting school rating calculations to value more the progress of every individual
child, including (a) measuring whether students are on a path to master
fundamental skills; and (b) measuring how effectively students are advancing
relative to their peers. This growth index will replace the current progress point
system.
3. Expanding the school performance score formula to emphasize interests and
opportunities for students, in addition to traditional assessment and graduation
outcomes, as five percent of school scores.
8School Performance Score Formulae
Beginning in 2017-2018, Louisiana will use the following formulae when evaluating school
performance:
NOTE: The interests and opportunities measure will not be included within annual results until 2019-2020.
9Agenda
• ESSA Plan Development
• Proposal for Elementary and Middle Schools
• Proposal for High Schools
• Review of Combination Schools
• Transition Proposal
• Upcoming Policy Considerations
• Resources and Next Steps
10Current Formula for School Performance Scores (SPS)
ESSA requires states to maintain accountability systems that evaluate school quality and
protect the interests of historically disadvantaged students.
Elementary/Middle Schools
Elementary Schools
(with Grade 8)
5%
+ Up to 10 + Up to 10
Progress Points Progress Points
100% 95%
Assessment Index Assessment Index
Dropout Credit Accumulation Index
11Future School Performance Score (SPS) Formulae
Beginning in 2017-2018, Louisiana will use the following formulae when evaluating school
performance:
NOTE: The interests and opportunities measure will not be included within annual results until 2019-2020. Until the
interest and opportunities measure is added, the assessment index shall be worth 75% for elementary schools and
70% for schools with an eighth grade.
12K-8 School SPS: Ranges
Score Ranges
For 2017-2018, as in previous transition years, letter grades are aligned to the 2012-2013
distribution to ensure simplicity, consistency, and fairness between now and the new baseline
year, as Louisiana transitions to higher standards. The curve is applied by school type: K-8,
high school, and combination school.
Letter Grade SPS Range
A 100.0 – 150.0
B 85.0 – 99.9
C 70.0 – 84.9
D 50.0 – 69.9
F Below 50.0
For more information on the transition policies, click here.
13K-8 School SPS: Assessments
Purpose
Louisiana students in grades 3-8 take assessments in ELA, math, science and social studies to
measure student mastery of the knowledge and skills reflected in the standards of that grade
and subject.
Accountability
The school performance score includes the points assigned to achievement levels earned by
students for each subject tested.
LEAP 2017-2018 2021-2022 2024-2025
Achievement Level
Advanced 150 150 150
Mastery 110 105 100
Basic 70 60 50
Approaching 0 0 0
Basic/Unsatisfactory
14K-8 School SPS:
Celebrating Student Growth Through Two Key Questions
Question 1: If students are not yet Question 2: Are students growing at
achieving Mastery, are they on a rate comparable to their peers?
track to doing so? • Using Louisiana’s value-added
• Every student scoring below measurement, it is possible to
Mastery will receive a simple, compare students’ individual
clear growth target for the performance to that of similar
following year that illustrates the peers.
growth required to be on track to • Schools will earn points based on
Mastery in ELA and math by 8th students’ growth percentile as
grade. compared to peers.
• If a student achieves the target, • 81st-99th percentile (150 points)
the school shall earn 150 points,
equivalent to an A+. Otherwise, • 61st-80th percentile (115 points)
move to question 2. • 41st-60th percentile (85 points)
• 21st-40th percentile (25 points)
15How Can High Achieving Students Show Growth?
For students scoring Advanced (the For students scoring Mastery in the
highest possible rating) in the prior prior year:
year: • Once students achieve Mastery, they
• If the student maintains a score of will receive a Continued Growth
Advanced, the school earns 150 target that illustrates what it will
points or an A+. take to get to Advanced by 8th
• If the student drops to the Mastery grade. If a student achieves this
level or below, the school is target, then the school is awarded
awarded points based on the 150 points or an A+.
student’s performance compared to • If a student does not achieve the
similar peers (Question 2). Continued Growth target, the school
is awarded points based on the
student’s performance compared to
similar peers (Question 2).
16Value-Added Calculation
Under ESSA, Louisiana will utilize the full value-added model (VAM) model for the school
growth index, as it does for teacher VAM.
The model includes the following characteristics: prior achievement on assessments up to
three years, special education status and disability category, economically disadvantaged
status, student absences, and student suspensions.
Example:
• Suzy scored Approaching Basic in ELA each of the past three years with no grade
retention. As a result, she is expected to score Approaching Basic (719) this year.
• Because Suzy has a speech/language disability, her expected score is reduced to 717.5.
• Because Suzy missed ten days of school, her expected score is further adjusted to 716.
• No other characteristics listed above apply to Suzy so they do not impact her score.
17K-8 School SPS:
Student Growth Example
18What Does the Growth Index Mean?
Growth Step 1: Growth to
Summary Step 2: Growth Relative to Peers
Rating Mastery
A Most students are Of students who started Approximately 75% or more of the
(100-150) exceeding below Mastery, students are growing at a rate that is
expectations. approximately half are at or above expectations for their
on track to reach peer group.
Mastery.
C Most students are Of students who started Students are performing about as
(70-84.9) maintaining their below Mastery, about a expected, with approximately 60% of
prior performance third on track to reach students growing at a rate that is at or
level. Mastery. above expectations for their peer
group.
F Most students are Of students who started Approximately 60-70% of students
(0-49.9) falling behind. below Mastery, less than are growing at a rate that is below
1 in 4 are on track to expectations for their peer group.
reach Mastery.
19K-8 School SPS: Dropout/Credit Accumulation Index (DCAI)
Purpose
This measure encourages successful transition to high Carnegie 2017- 2021- 2024-
Course Credits 2018 2022 2025
school, as well as access to Carnegie credits in middle
school. 7 or more 150 150 150
Accountability 6.5 135 130 125
6 120 110 100
• Calculated for schools that include grade 8 in prior
year. 5.5 95 85 75
• Points based on number of Carnegie credits earned 5 70 60 50
through the end of 9th grade (and transitional 9th, 4.5 45 35 25
where applicable) and/or dropout status.
4 20 10 0
Policy
3.5 10 5 0
• To count toward DCAI, students must be full
3 or less 0 0 0
academic year in 8th and 9th grade (or transitional 9th,
where applicable), if earning Carnegie credits. 3rd year 8th 0
0 0
grader
• Students transferring between public districts
between 8th and 9th grade are still eligible to earn Dropout 0 0 0
points for DCAI.Agenda
• ESSA Plan Development
• Proposal for Elementary and Middle Schools
• Proposal for High Schools
• Review of Combination Schools
• Transition Proposal
• Upcoming Policy Considerations
• Resources and Next Steps
212016 School Performance Score (SPS) Formula
ESSA requires states to maintain accountability systems that evaluate school quality and
protect the interests of historically disadvantaged students.
High Schools
25% 25%
+ Up to 10 Progress
Points
25% 25%
EOC (Status)
ACT/WorkKeys
Strength of Diploma
Cohort Graduation Rate
22Future School Performance Score Formula
Beginning in 2017-2018, Louisiana will use the following formulae when evaluating school
performance:
NOTE: The interests and opportunities measure will not be included within annual results until 2019-2020. Until the
interests and opportunities measure is added, cohort graduation rate will continue to count as 25% of the score.
23High School SPS: Ranges
Score Ranges
For 2017-2018, as in previous transition years, letter grades are aligned to the 2012-2013
distribution to ensure simplicity, consistency, and fairness between now and the new
baseline year, as Louisiana transitions to higher standards
Letter Grade SPS Range
A 100.0 – 150.0
B 85.0 – 99.9
C 70.0 – 84.9
D 50.0 – 69.9
F Below 50.0
For more information on the transition policies, click here.High School SPS: EOC Achievement and Growth
Purpose
The End-Of-Course (EOC) exams assess whether students have mastered the standards of core high school core
subjects. EOC exams are required in Algebra I, Geometry, English I (beginning in 2017-2018), English II, Biology,
and U.S. History.
Policy
All high school students, except for students who participate in LAA 1, are required to take an ELA and math
EOC exam by their 3rd cohort year regardless of graduation pathway.
Scores from high school students who are retaking an EOC are not used in the school performance score (unless
taken in middle school where current practice of counting scores in middle school (with incentive points) and
again in high school will continue).
LEAP 2025 EOCs 2017-2018 2021-2022 2024-2025
Achievement Level
Advanced 150 150 150
(or Excellent)
Mastery 110 105 100
Basic 70 60 50
(or Good)
Approaching 0 0 0
Basic/Unsatisfactory
(or Fair/Needs Imp.)High School SPS: EOC Achievement and Growth
Like schools serving grades 3 to 8, high schools may earn credit for both achievement and
growth with students, as measured by the EOCs. High achieving students will be treated the
same as in elementary schools.
Question 1: If students are not yet Question 2: Are students growing at
achieving Mastery, are they on a rate comparable to their peers?
track to doing so? • Using Louisiana’s value-added
• Every student scoring below measurement, it is possible to
Mastery in grade 8 will receive a compare students’ individual
simple, clear growth target for performance to that of similar
the following year that illustrates peers.
the growth required to be on • Schools will earn points based on
track to Mastery in ELA and math students’ growth percentile as
by 10th grade. compared to peers.
• If a student achieves the target, • 81st-99th percentile (150 points)
the school shall earn 150 points,
equivalent to an A+. Otherwise, • 61st-80th percentile (115 points)
move to question 2. • 41st-60th percentile (85 points)
• 21st-40th percentile (25 points)High School SPS: ACT and WorkKeys
ACT / 2017- 2021- 2024-
Purpose
WorkKeys 2018 2022 2025
The ACT/WorkKeys index is to ensure student 36 150 150 150
readiness for postsecondary learning.
31 or Platinum 135 134.5 134
Policy
27 (TOPS Honors) 122.3 121.3 120.4
• All students in grade 11 take the ACT, a
nationally recognized measure of college
25 116 114.8 113.6
and career readiness.
• Schools earn points for the highest 24 or Gold 112.8 111.5 110.2
composite score earned by a student
through the spring testing date of their 23 (TOPS Performance) 109.7 108.3 106.8
senior year or a student who graduates at
the end of grade 11. 21 (ACT Readiness marker) 103.4 101.7 100
• Beginning in 2015-2016, WorkKeys was 20 (TOPS Opportunity) 93.2 89.1 85
included in the ACT index for accountability
when the WorkKeys score yielded more 18 or Silver 73 64 55
index points than the ACT score.
17 or below 0 0 0High School SPS: Graduation Rate
Purpose
The cohort graduation rate measures percentage of students who enter grade 9 and graduate four years
later, adjusted for students who transfer in or out.
Policy
All 9th grade students who enter a graduation cohort are included in calculations of the cohort graduation
rate, regardless of diploma pathway, unless they are legitimate leavers. Beginning in 2017-2018, per ESSA,
students assessed on an alternate assessment who earn a diploma will be included in the cohort in the
year they graduate.
Legitimate leavers are students who are removed from the cohort and exited enrollment for one or more of
the following reasons: death (07); transfer out of state (10); transfer to approved nonpublic school (14);
transfer to BESE-approved home study program (16); transfer to early college (20).
Cohort Grad 2017-2018 2021-2022 2024-2025
Rate 100 = 85% 100 = 87.5% 100 = 90%
0-75% CGR × 1.1 CGR × 1 CGR × 0.9
76-90% CGR x 1.177778 CGR x 1.155556 CGR x 1.111112
91-100% +4.4 points per percent +4.6 points per percent +5 points per percent
increase (91=110.4, increase (91=109.5, increase (91=105, 92=110)
92=114.8) 92=114)High School SPS: Strength of Diploma
The graduation index measures the quality of the diploma earned by each 12th grader. The “A” bar will
remain at receipt of a diploma.
Quality of Diploma (Graduation Index): Student Results Points Awarded
HS Diploma plus 110-160
Additional points awarded for students who graduate on time and meet requirements for one or
more of the following:
• Advanced Placement
• International Baccalaureate
• JumpStart credentials
• CLEP
• TOPS-aligned dual enrollment course completion
• Associates Degree
Four-year graduate 100
(Includes Career Diploma students with a regional Jump Start credential, as well as students earning
a diploma who are assessed on an alternate diploma)
Five and six-year graduate with any diploma 50-75
(Five-year graduates who earn an AP score of 3 or higher, an IB score of 4 or higher, or a CLEP of 50
or higher will generate 140 points.)
HiSET/GED + JumpStart credential 40
HiSET/GED (earned no later than October 1 following last exit record) 25
Non-graduate without HiSET/GED 0Agenda
• ESSA Plan Development
• Proposal for Elementary and Middle Schools
• Proposal for High Schools
• Review of Combination Schools
• Transition Proposal
• Upcoming Policy Considerations
• Resources and Next Steps
30Combination SPS: Ranges
Score Ranges
For 2017-2018, as in previous transition years, letter grades are aligned to the 2012-2013
distribution to ensure simplicity, consistency, and fairness between now and the new
baseline year, as Louisiana transitions to higher standards.
Letter Grade SPS Range
A 100.0 – 150.0
B 85.0 – 99.9
C 70.0 – 84.9
D 50.0 – 69.9
F Below 50.0
For more information on the transition policies, click here.Combination Schools: Weighting
School Accountability
Schools with students in both K-8 and 9-12 grades will receive a school performance score
based on both the K-8 and 9-12 formulas and weighted by students included in the formula.
Example Calculation
1. Calculate K-8 SPS for all students who test or are included in DCAI as for all K-8 schools.
2. Calculate HS SPS for EOC and ACT testers, without duplication, and cohort graduation
members.
3. Determine number of students that are K-8 and number that are high school.
4. Average the K-8 SPS and HS SPS using numbers of students to weight the SPS before
averaging them.
K-8 50 Students 33% of all eligible testers
HS 100 Students 67% of all eligible testers
Total Students Used for Weights 150 Students 100% of eligible testers
32Agenda
• ESSA Plan Development
• Proposal for Elementary and Middle Schools
• Proposal for High Schools
• Review of Combination Schools
• Transition Proposal
• Upcoming Policy Considerations
• Resources and Next Steps
33Transitioning to Higher Expectations
The proposed accountability system will ensure that:
a) an “A” represents nationally-competitive readiness for our students and
b) an “A” represents a school where students are sustaining and growing, not regressing.
Over the next eight years, Louisiana’s school ratings will raise statewide expectations in order to allow
our students to compete. Louisiana’s students cannot wait. But the transition must also ensure stability.
As such, the following slides outline a proposed transition plan that ensures most schools would not
change letter grades.
• Four in five elementary/middle schools would maintain the same letter grade; four percent would
improve as a result of the new standards, and 13 percent would decline a letter grade.
• More than half of high schools and combination schools would maintain the same letter grade.
For the highest performing schools, the proposed transition plan ensures most districts see no change in
their A and B schools:
• More than two thirds of districts would have no change in the number of elementary/middle schools
earning A or B letter grades, and nearly forty percent would have no change in the number of A and B
schools of any grade level.
• Five districts would increase the number of A and B elementary/middle schools, and three districts
would see an increase in the total number of A and B schools.
34Transition Proposal
Beginning in 2017-2018, During the 2019-2020 Assuming the board and
Louisiana’s accountability year, the Accountability commission determine
standards will shift Commission and BESE will that the current plan
modestly in order to begin review the results of the should proceed, the
making progress toward shifting system to scoring system will shift
the 2025 “A” benchmarks. determine if any incrementally two
adjustments are needed additional times–in 2021-
and whether the letter 2022 and 2024-2025–such
This shift will proceed for grade curve should be that Louisiana has fully
two years and letter grade maintained or ended. transitioned to the 2025
ratings will be curved standards.
during this period. The
overall distribution of
letter grades will not
worsen.
35Elementary/Middle Schools
On average, elementary/middle schools will need to improve 5.4 points in the first year, 7.7
points by the second transition, and 10.2 points by 2025 to maintain their 2016 Letter Grade.
Distribution of Elementary/Middle Schools by Transition Timeline
(25% Growth Index, No Curve, No Projected Improvement)
24 17 14
90 62
Number of Elementary/Middle Schools
150 (15%) 196 156 108
296 290
279 (28%) 243 316
325 A (100-150)
B (85-99.9)
284 (29%) 272 355 C (70-84.9)
450
411 D (50-69.9)
378
203 (21%) 203 F (0-49.9)
209
89 120 156
67 (7%) 66 22
2013 Baseline 2016 Actual 2016 with Growth 2018 2022 2025
36Elementary/Middle Schools
With the curve, the distribution of letter grades will not worsen. As a result, the percent of
elementary/middle schools at each letter grade in 2017-2018 would mirror the 2013 baseline.
Approximately 68% of grades would be curved.
Distribution of Elementary/Middle Schools with Letter Grade Curve
Number of Elementary/Middle Schools
150 (15%) 196 146
279 (28%) 275 A (100-150)
243
B (85-99.9)
C (70-84.9)
284 (29%) 272 280
D (50-69.9)
F (0-49.9)
203 (21%) 203 204
67 (7%) 66 67
2013 Baseline 2016 Actual (Curved) 2018 Curved
37Elementary/Middle Schools
If elementary/middle schools maintain their current performance in 2017-2018, more than
four out of five (83%) schools will maintain the same letter grade.
Four percent will improve as a result of the new standards, and 13 percent would decline a
letter grade.
2016 Actual 2018 Curved Letter Grades
Letter Grade
(Curved) A B C D F Total
A 142 54 0 0 0 196
B 4 207 32 0 0 243
C 0 14 235 22 0 271
D 0 0 13 173 15 201
F 0 0 0 9 52 61
Total 146 275 280 204 67 972
38High Schools
On average, high schools will need need to improve 3.4 points in the first year, 4.8 points by
the second transition, and 6.5 points by 2025 to maintain their 2016 Letter Grade.
Distribution of High Schools by Transition Timeline
(25% EOC Growth and Status Index, No Curve, No Projected Improvement)
18 (11%) 11 9 8
61 53 44
Number of High Schools
62 55
52 (31%)
A (100-150)
44 53 58 B (85-99.9)
42 (25%) 55
58 C (70-84.9)
40 46 D (50-69.9)
43 (26%) 48 55
38 F (0-49.9)
25 19
13 (8%) 13 9 11 13 15
2013 Baseline 2016 Actual 2016 with Growth 2018 2022 2025
39High Schools
With the curve, the distribution of letter grades will not worsen. As a result, the percent of
high schools at each letter grade in 2017-2018 would mirror the 2013 baseline. Approximately
six percent of grades would be curved.
Distribution of High Schools with Letter Grade Curve
18 (11%) 19
61
Number of High Schools
52 (31%) 56 A (100-150)
B (85-99.9)
44
42 (25%) C (70-84.9)
56
D (50-69.9)
40
F (0-49.9)
43 (26%)
25 38
13 (8%) 13 11
2013 Baseline 2016 Actual (Curved) 2018 Curved
40High Schools
Because high school letter grades have increased significantly since the 2012-2013 baseline
distribution, more high schools change letter grades under the proposed 2017-2018
standards.
Fifty-four percent of high schools would maintain the same letter grade, and 46 percent
would decline.
2016 Actual 2018 Curved Letter Grades
Letter Grade
(Curved) A B C D F Total
A 19 39 3 0 0 61
B 0 17 27 0 0 44
C 0 0 26 13 0 39
D 0 0 0 24 0 24
F 0 0 0 1 11 12
Total 19 56 56 38 11 180
41Combination Schools
On average, combination schools will need to improve 4.5 points in the first year, 6.7 points
by the second transition, and 8.8 points by 2025 to maintain their 2016 Letter Grade.
Distribution of Combination Schools by Transition Timeline
(Growth Index, No Curve, No Projected Improvement)
19 (10%) 18 7 7 6
Number of Combination Schools
39 25 15
36
57 (31%)
69 73 A (100-150)
57 74
73 B (85-99.9)
56 (30%) C (70-84.9)
34 42 D (50-69.9)
47
24 (13%) 27 36
14 16 F (0-49.9)
29 (16%) 22 20 22 23 24
2013 Baseline 2016 Actual 2016 with Growth 2018 2022 2025
42Combination Schools
With the curve, the distribution of letter grades will not worsen. As a result, the percent of
combination schools at each letter grade in 2017-2018 would mirror the 2013 baseline.
Approximately 36 percent of grades would be curved.
Distribution of Combination Schools with Letter Grade Curve
19 (10%)
Number of Combination Schools
24
39
57 (31%) 48 A (100-150)
57 B (85-99.9)
C (70-84.9)
56 (30%) 47
D (50-69.9)
34
24 (13%) F (0-49.9)
14 34
29 (16%) 22 12
2013 Baseline 2016 Actual (Curved) 2018 Curved
43Combination Schools
Like high schools, combination school letter grades have increased since the 2012-2013
baseline distribution.
Sixty-three percent of high schools would maintain the same letter grade in 2017-18, and 31
percent would decline.
2016 Actual 2018 Curved Letter Grades
Letter Grade
(Curved) A B C D F Total
A 17 22 0 0 0 39
B 0 29 26 2 0 57
C 0 0 23 11 0 34
D 0 0 0 9 5 14
F 0 0 0 0 21 21
Total 17 51 49 22 26 165
44Agenda
• ESSA Plan Development
• Proposal for Elementary and Middle Schools
• Proposal for High Schools
• Review of Combination Schools
• Transition Proposal
• Upcoming Policy Considerations
• Resources and Next Steps
45English Learners in Accountability
ESSA requires that states include an accountability measure of English learners’ progress
towards English language proficiency. Louisiana will measure school success with English
language learners in two ways:
1. Progress towards English language proficiency, as measured by the English language
proficiency exam, will be included within the assessment index of each school beginning in
2018-2019 (2017-2018 is baseline).
• This ensures all student scores are included regardless of the number of English
language learners in a school, and that all such scores are weighted equally with the
assessment results of all students in the school.
• As provided for in ESSA, the measure of progress towards English language proficiency
will consider a student’s ELP level at the time of identification and may also account
for other characteristics such as age, grade, native language proficiency level, and
time in formal education.
2. Both the English language proficiency results and English learner subgroup results on all
other SPS indicators will be publicly reported on school report cards.
46English Learners in Accountability: Recently-Arrived Students
Under ESSA, states may utilize longer timeline before counting results of recently-arrived
students. Currently, scores count after one year; under ESSA, achievement counts in the third
year.
EXAMPLE: If a student recently arrived to the United States enrolls in a school and is identified
as an English learner in third grade, the following outlines how that student will assessed and
included in accountability beginning in 2017-2018.
Assessment Year 1 (3rd Grade) Year 2 (4th Grade) Year 3 (5th Grade)
Content (ELA, math, Not in accountability Growth only Achievement and
science, social growth
studies)
English language Not in accountability Growth only Growth only
proficiency
47Interests and Opportunities
The interests and opportunities indicator (five percent of each school's score) will measure whether
schools are providing students with access to a well-rounded education, exposing them to diverse areas
of learning in which they can develop their skills and talents. This indicator will also measure the extent to
which schools are providing students the opportunity to take courses needed to successfully transition to
postsecondary studies, including courses for college credit and those that lead to a recognized industry
credential.
All elementary and middle settings should offer every Louisiana student access to quality visual and
performing arts, foreign language instruction, technology consistent with current standards, and a variety
of co-curricular activities (academic, athletic, and special interests).
High schools should offer all Louisiana students access to all courses required for receiving TOPS
University and TOPS Tech scholarships, a variety of statewide Jump Start training pathways leading to
advanced credentials, or an associate's degree aligned to top-demand occupations.
Timeline for implementation:
• 2017-2018: Collect all data necessary
• Summer 2018: Outline pilot index for measuring success
• 2018-2019: Pilot index for all schools, report publicly with no stakes
• 2019-2020: Interests and Opportunities measure included in SPS
48Agenda
• ESSA Plan Development
• Proposal for Elementary and Middle Schools
• Proposal for High Schools
• Review of Combination Schools
• Transition Proposal
• Upcoming Policy Considerations
• Resources and Next Steps
49Resources
To support educators, the Department will offer the following supports regarding Louisiana’s
new accountability system:
1. Continued trainings at annual Summit, through networks, and by district as needed.
2. Calculators, including (a) traditional SPS calculator but also (b) simple growth target
calculator
3. Improved reporting on student assessment results including simple growth targets in
anticipation of 2017-2018 school year
4. 2016-2017 results calculated using current formula but also future formula as part of fall
principal profile process
50Next Steps
BESE will meet on March 29 at 1:00 PM in the Claiborne State Office Building, Louisiana
Purchase Room, to consider Louisiana’s ESSA state plan.
The Accountability Commission will meet to consider district performance scores in the
coming months.
Please continue to provide public comment via essalouisiana@la.gov.
Contact information: Jessica.Baghian@la.gov
51You can also read


