Full Year 2019 Preliminary Earnings Presentation - BEFESA
←
→
Page content transcription
If your browser does not render page correctly, please read the page content below
BEFESA

Full Year 2019 Preliminary Earnings Presentation

                                                   20 February 2020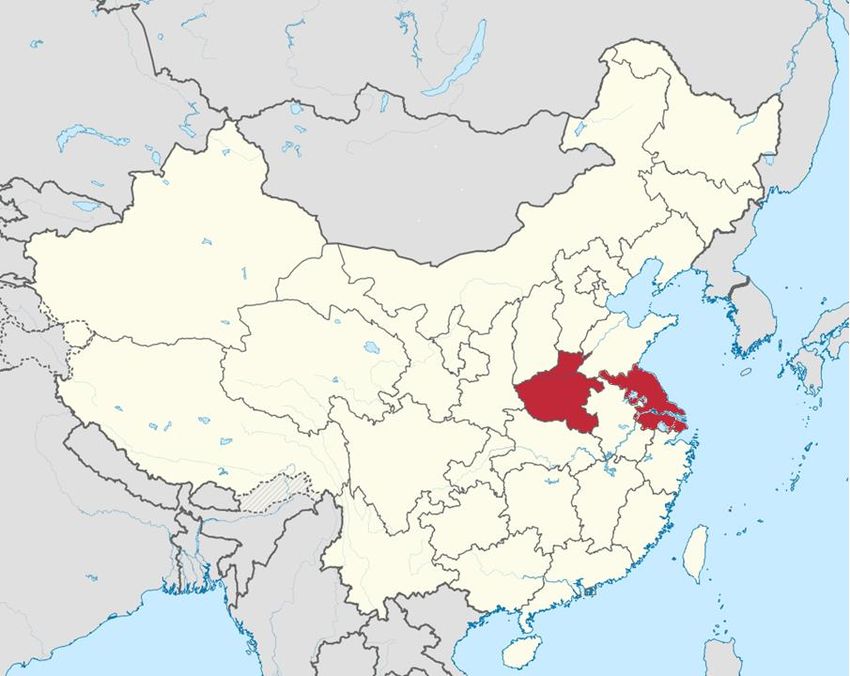
BEFESA                                                                                                                                       Disclaimer
This presentation contains forward-looking statements and information relating to Befesa and its affiliates that are based on the beliefs of its management,
including assumptions, opinions and views of Befesa and its affiliates as well as information cited from third party sources. Such statements reflect the current
views of Befesa and its affiliates or of such third parties with respect to future events and are subject to risks, uncertainties and assumptions.

Many factors could cause the actual results, performance or achievements of Befesa and its affiliates to be materially different from any future results,
performance or achievements that may be expressed or implied by such forward-looking statements, including, among others: changes in general economic,
political, governmental and business conditions globally and in the countries in which Befesa and its affiliates do business; changes in interest rates; changes
in inflation rates; changes in prices; changes to national and international laws and policies that support industrial waste recycling; legal challenges to
regulations, subsidies and incentives that support industrial waste recycling; extensive governmental regulation in a number of different jurisdictions, including
stringent environmental regulation; management of exposure to credit, interest rate, exchange rate and commodity price risks; acquisitions or investments in
joint ventures with third parties; inability to obtain new sites and expand existing ones; failure to maintain safe work environments; effects of catastrophes,
natural disasters, adverse weather conditions, unexpected geological or other physical conditions, or criminal or terrorist acts at one or more of our plants;
insufficient insurance coverage and increases in insurance cost; loss of senior management and key personnel; unauthorised use of Befesa’s intellectual
property and claims of infringement by the Company of others’ intellectual property; Befesa’s ability to generate cash to service its indebtedness changes in
business strategy and various other factors. Should one or more of these risks or uncertainties materialise, or should underlying assumptions prove incorrect,
actual results may vary materially from those described herein as anticipated, believed, estimated, expected or targeted.

Befesa and its affiliates do not assume any guarantee that the assumptions underlying forward-looking statements are free of errors nor do they accept any
responsibility for the future accuracy of the opinions expressed herein or the actual occurrence of the forecasted developments. No representation (express or
implied) is made as to, and no reliance should be placed on, any information, including projections, estimates, targets and opinions, contained herein, and no
liability whatsoever is accepted as to any errors, omissions or misstatements contained herein or otherwise resulting, directly or indirectly, from the use of this
document.

This presentation is intended for information only and should not be treated as investment advice. It is not intended as an offer for sale, or as a solicitation of
an offer to purchase or subscribe to, any securities in any jurisdiction. Neither this presentation nor anything contained therein shall form the basis of, or be
relied upon in connection with, any commitment or contract whatsoever. This presentation may not, at any time, be reproduced, distributed or published (in
whole or in part) without prior written consent of Befesa.

Full year preliminary figures contained in this presentation are currently being audited by external auditors.

This presentation includes Alternative Performance Measures (APMs), including EBITDA, Adjusted EBITDA, Adjusted EBITDA margin, EBIT, Adjusted EBIT,
Adjusted EBIT margin, net debt, leverage and capital expenditures which are not measures of liquidity or financial performance under International Financial
Reporting Standards (IFRS). These non-IFRS measures should not be considered in isolation or as an alternative to results from operating activities, cash flow
from operating, investing or financing activities, or other financial measures of our results of operations or liquidity derived in accordance with IFRS. We
include APMs in this presentation because we believe that they are useful measures of our performance and liquidity. Other companies, including those in our
industry, may calculate similarly titled financial measures differently than we do. Because all companies do not calculate these financial measures in the same
manner, our presentation of such financial measures may not be comparable to other similarly titled measures of other companies. These APMs are not
audited. All amounts are stated in million euros (€ million) unless otherwise indicated.

                                                                                                                                                                      2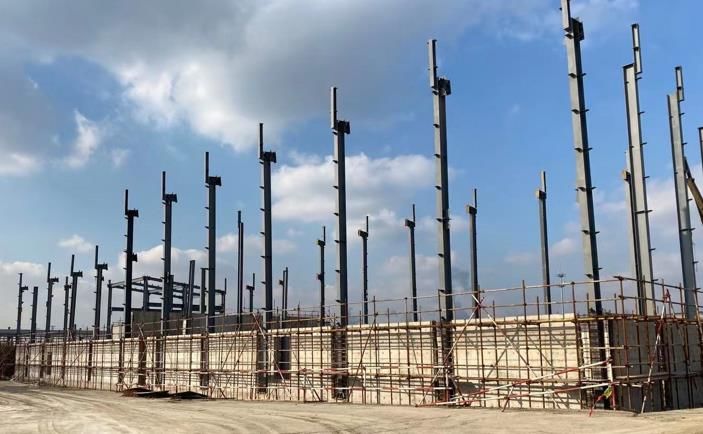
BEFESA                                                                        Today’s Presenters

                CEO since 2000                       CFO since 2014                         Since 2008

               Javier Molina                        Wolf Lehmann                         Rafael Pérez

               CEO                                  CFO; including                       Director of
                                                    responsibilities                     Investor Relations
                                                    for Operational                      & Strategy
                                                    Excellence and IT

▪ Leading the company since 1994   ▪ 20+ years in finance and           ▪ Director of Investor Relations
                                     operational leadership roles         and Strategy of Befesa
                                                                          since 2008
                                   ▪ 50/50 General Electric /
                                     Private Equity

                                                                                                              3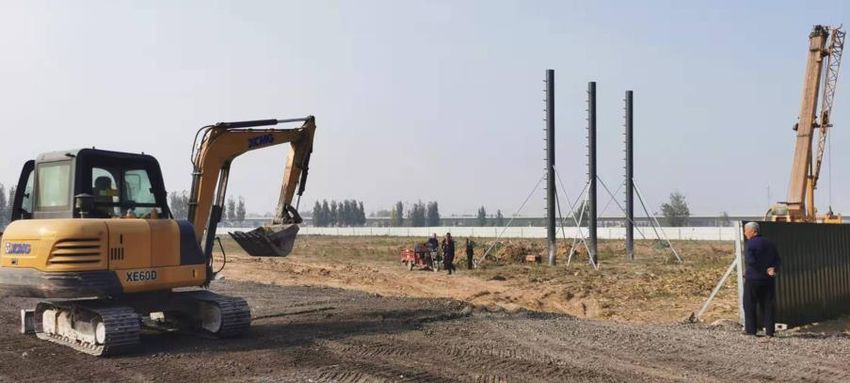
BEFESA                                                                        2019 Highlights
                                            ▪   Steel Dust throughput 666kt (-7% YoY): Turkey upgrade
 Good operational performance &
                                            ▪   Salt Slags & SPL recycled at 493kt (-5% YoY)
 plant utilisation, considering downtimes
                                            ▪   Core businesses normalised at ~90% utilisation rates
 for plant upgrades:                        ▪   Aluminium alloys produced 177kt (+4% YoY): Furnace
 Turkey (Steel), Barcelona (Aluminium)          upgrades in H2’18 and H2’19 delivering

                                            ▪ EBITDA at €160m (-9% / €-16m YoY)
 Full year 2019 earnings as expected;          ▼ Steel volume: Turkey upgrade (7 months down)
 YoY impacted by lower metal prices:           ▼ Unfavourable metal prices: $245/t TC (+67% YoY);
 - Treatment charges (TC);                       €2,274/t LME zinc (-8% YoY); €1,397/t Alu FMB (-19%)
                                               Partially offset by:
 - Zinc LME -&- aluminium alloy FMB
                                               ▲ Zinc hedges (€2,310/t in 2019)
                                               ▲ Stainless operations recovering
 … Delivered strong 25% EBITDA margin       ▪ Profitability continues at strong 25% EBITDA margin

                                            ▪ Solid operating cash flow at €103m; Cash on hand at
 Solid cash flow funding a record growth      €126m after funding capex (€56m growth initiatives;
 capex; Cash at €126m & leverage at x2.6;     €24m maintenance / prod. / compliance / IT) & dividend
 Proposing stable dividend distribution       (€45m paid in July 2019); Leverage at moderate x2.6
                                            ▪ Proposing stable dividend distribution of €45 equal to
 of €45m or €1.32 per share                   €1.32 per share in ´20 (same as ´19); 3.5% dividend yield

                                            ✓   Turkey capacity upgrade: Completed in August
 Completed growth projects on time &
                                            ✓   2nd Alu Barcelona furnace upgrade completed in Nov
 on budget (Turkey, Korea, Barcelona);
                                            ✓   Korea Waelz oxide (WOX) washing plant completed Dec
 Progressing in China ~on schedule;         ➢   Progressing in China: Jiangsu in construction -&-
 Set up well for growth in 2020+                Henan broke ground mid-Nov
                                                                                                          4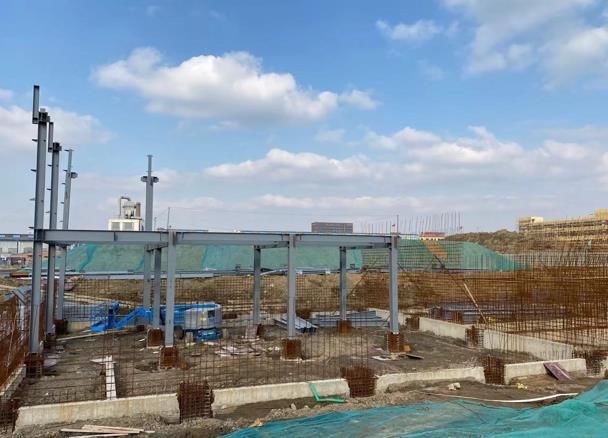
BEFESA                                                      Consolidated Key Financials
 EBITDA €160m (-9% YoY) as expected: Lower volume due to Turkey upgrade;
 Unfavourable TC & metal prices; Partially offset by higher hedges, recovering
 Stainless operations and 2nd Alu efficiencies; Strong 25% EBITDA margin
Revenue
                                         ▪   2019 revenue at €647.9m (€-72 / -10% YoY) primarily due to:
(€m)
                         720.1   647.9       - EAF dust throughput at 666kt (-7% YoY): Lower volumes
       181.0
                151.3                          in Turkey due to scheduled 7-month downtime to upgrade;
                                               Salt slags & Spent Pot Linings (SPL) at 493kt (-5%):
                                               Prolonged maintenance downtimes;
       Q4 '18   Q4 '19   2018    2019          Partly offset by higher aluminium alloys produced
                                               at 177kt (+4% YoY): New furnaces at Bilbao delivering
EBITDA and % margin                          - Unfavourable zinc TC for 2019 ~$245/t vs. $147/t ’18
(€m)
                         176.0               - Lower market prices: Zinc LME prices down 8% (2019:
                                 159.6
       47.1     42.5
                                               €2,274/t; 2018: €2,468/t); Aluminium alloy FMB prices
                                               down 19% (2019: €1,397/t; 2018: €1,715/t)
                                             - Revenue decrease partially offset by:
       Q4 '18   Q4 '19   2018    2019          (a) Improved hedging prices (2019: €2,310; 2018: €2,051)
                                               → improved zinc blended prices (2019: €2,280; 2018: €2,168)
       26%      28%      24%     25%
                                               (b) Recovered YoY performance in Stainless operations
Net profit                               ▪   EBITDA at €160m (€-16m / -9% YoY);
(€m)                                         Strong 25% margin; following the above drivers:
                         90.2
                                             - Lower volumes Steel: Turkey upgrade (~€-10);
                                  82.7
                                             - Unfavourable TC (~€-21);
        27.3    22.0                         - Lower metal market prices (Zinc €-9; Alu alloy ~€-6)
                                             + Partially offset by better zinc hedges (~€+24);
                                             + Recovering Stainless operations (~€+5)
       Q4 '18   Q4 '19   2018    2019

                                         ▪   Net Profit at €83m (-€7 / -8% YoY); Following reduced EBITDA;
                                             Proposing stable €45m / €1.32 per share dividend distribution 5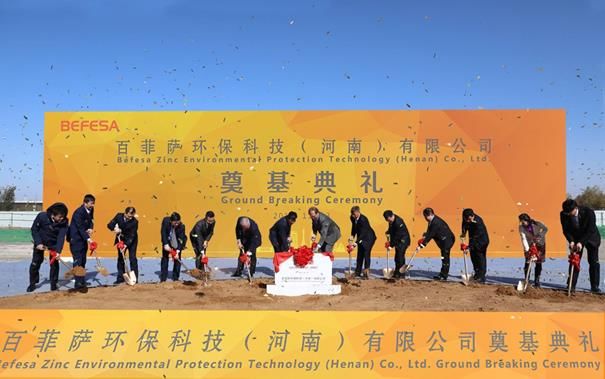
BEFESA                                                                            Steel Dust Recycling Services
 EBITDA at €125m (-9% YoY), driven by lower volume in Turkey -&- unfavourable
 zinc LME prices & TC; Partly offset by improved hedges & Stainless operations
Revenue                                                          EAFD throughput & capacity utilisation
(€m)                                                             (thousand tonnes, % of annual installed capacity)
                                    380.9         360.1
       96.9                                                                                                              717.7
                    85.1                                                                                                                      665.8
                                                                          180.9               177.1

       Q4 '18       Q4 '19           2018         2019                                       95%(i)      % capacity                          90%(i)
                                                                          92%                    85%     utilisation      92%                    81%
EBITDA and % margin
(€m)                                                                     Q4 '18               Q4 '19                      2018                 2019
                                    137.4         125.3           (i) Utilisation rates in 2019 are normalised for the capacity upgrade in Turkey, from 65kt
                                                                      to 110kt (plant was down seven months, from end of January to mid August)

       36.1         33.5                                          ▪ Throughput impacted as expected mainly by downtime in
                                                                    Turkey to expand capacity (Jan-Aug ’19)

       Q4 '18       Q4 '19           2018         2019            ▪ Continued high ~90% plant utilisation, normalised for
                                                                    Turkey plant upgrade
       37%          39%              36%          35%

 ▪ FY revenue down 5% driven by 7% lower throughput YoY          Prices                     Q4          Q4         %                                 %
                                                                                                                              2018       2019
   - Turkey: seven months down to upgrade capacity               (€ per tonne)             2018        2019       Var.                              Var.
   - Unfavourable TC: ~$245/t in ´19 vs. ~$147/t in ´18           Befesa blended(ii)
   + Partly offset with higher blended zinc prices (+5% YoY) &                             2,191       2,273    +3.8%        2,168       2,280     +5.2%
                                                                  zinc price (€/t)
     Stainless operations recovering
                                                                  LME avg. price
                                                                                           2,305       2,157    -6.4%        2,468       2,274     -7.9%
 ▪ FY EBITDA down €12m YoY primarily driven by:                   (€/t)
   - Turkey volume (~€-10); Unfavourable TC (~€-21);              (ii) Blended rate between hedged prices and average spot prices, weighted by the
     Lower zinc market prices (~€-9); Partially offset by              respective hedged and non-hedged volumes, reflecting the effective price to Befesa
   + Better zinc hedges (~€+24) & recovering Stainless (~€+5)
                                                                                                                                                               6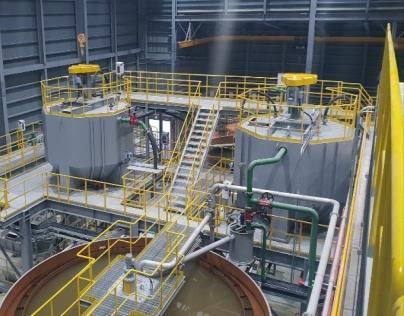
BEFESA                                                                     Aluminium Salt Slags Recycling Services
    EBITDA at €33m (-11% YoY) mainly driven by lower aluminium alloy prices;
    Plant utilisations >90% normalised for furnace upgrades
  Revenue(1)                                                                        Volumes & capacity utilisation
  (€m)                                                   342.9                      (thousand tonnes, % of annual installed capacity)
                                                                 292.4                Salt Slags & SPL treated
                                                                                                                                                   -24.4kt / -4.7%
              84.8                                       300.1
                                  68.2                           245.2                                                                           517.0           492.6
                                                                                             138.1               126.3
               73.8               55.4
               21.4               20.9                   83.4    81.6
                                                                                                                            % capacity
                                                                                             103%                95%        utilisation
                                                                                                                                                 98%              93%
              Q4 '18             Q4 '19                  2018    2019

   EBITDA and % margin(2)                                                                    Q4 '18              Q4 '19                          2018             2019
   (€m)                                                  37.2                         Aluminium alloys produced
                                                                 33.0                                                                                            176.7
                                                                                                                                                 169.3
                                                         12.4
              10.7                                               12.0                        42.6                 43.6
                                  8.3
               5.2
                                   3.4                   24.8    21.0                                                       % capacity
                                                                                            98%(ii)             89%(i)                       98%(ii)             91%(i)
               5.5                 4.9                                                          82%                 84%     utilisation            83%               86%

              Q4 '18             Q4 '19                  2018    2019
                                                                                             Q4 '18              Q4 '19                          2018             2019
              26%                 23%                    30%     26%                 (i) Utilisation rates in 2019 are normalised for the furnace upgrade in Barcelona plant
                                                                                         (three-month downtime, from 2nd week of Aug to 2nd week of Nov)
                                                                                     (ii) In 2018, they are normalised for the furnace upgrades in Bilbao plant (three-month
                                                                                          downtime, from 2nd week of Jun to 3rd week of Sep) and Barcelona (two-month
    ▪   2nd Alu: FY EBITDA ~flat YoY at €12m – Furnace upgrades                           downtime, from 4th week of Aug to 4th week of Oct)
        in H2’18 delivering and offset impact from scheduled
                                                                                    Prices                       Q4          Q4            %                                %
        downtime at Barcelona plant to upgrade furnace in H2’19                     (€ per tonne)               2018        2019          Var.
                                                                                                                                                         2018   2019
                                                                                                                                                                           Var.
    ▪ Salt Slags & SPL: FY EBITDA down €4m YoY mainly due to                          Aluminium alloy
      19% decrease in aluminium alloy market prices (~€-6);                                                     1,508      1,312      -13%              1,715   1,397      -19%
                                                                                      avg. price (iii) (€/t)
      Slightly reduced salt slags volumes;                                           (iii) Aluminium Scrap and Foundry Ingots Aluminium pressure diecasting ingot
      Partially offset by improved efficiencies                                            DIN226/A380 European Metal Bulletin Free Market Duty paid delivered works

                                                                   Salt Slags subsegment
(1) Total revenue after inter-segment eliminations                 Secondary Aluminium subsegment                                                                                 7
(2) EBITDA margins refer to the Salt Slags sub-segment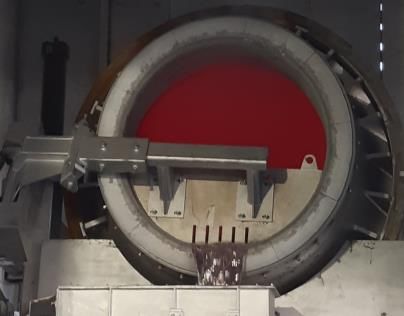
Consolidated Net Debt / Leverage /
  BEFESA                                                                                                        Cash Flow / Capital Structure
     Solid operating cash flow: Funding record €80m capex -&- €45m dividend;
     YE´19 cash on hand of €126m, Leverage at moderate x2.6;
     Reduced interest rate of long-term capital structure by 50 bps in Feb 2020
   Net debt & leverage rate evolution                                                                    2019 EBITDA to total cash flow – main drivers
   (€m)          542   (1)
                                               126                                                       (€m)
                                                                             417                         EBITDA                   €160           Down €16.4m / 9.3% YoY
                                                                                                         WC change                €-16           Mainly a) higher inventories ref. to
                                      After €45m dividend                                                                                        Korea washing & ramp-up of Alu furnace
                                      & €80m record capex                                                                                        -&- b) hedge accounting
                                                                                                         Taxes                    €-21           Cash tax rate 20.6%
           Gross debt as of                Cash&Equiv                  Net debt as of
          31 December 2019                                           31 December 2019                    Interest & other(2) €-22

                                                                                                         Capex & other        €-80               €24 Maint. / prod. / compl./ IT spend;
        x4.7         x4.4                                                                                investing activities                    €56 Growth: Turkey, Korea, Alu furnaces
                                  x3.8         x3.5
                                                                                      x2.6                                                                    & China expansion
                                                            x2.4         x2.1
                                                                                                         Dividends                €-45           Paid in July 2019
                                                                                                         Total Cash Flow          €-25           → €126 cash on hand & x2.6 leverage
        2013         2014         2015         2016         2017         2018         2019

   Capital Structure                                                                                     Operating cash flow(3)
   ▪ 17 Feb’20, term loan B (TLB) successfully repriced; Interest rate down                              (€m)                                               104               103
     50 bps to E+200 bps; €2.6 savings p.a.; Other terms unchanged                                                                         92
   ▪ After a fixed 9-months period, interest rate could be reduced further                                                56
     alongside certain leverage ratchets, e.g. E+125 bps if leverage < x1.75
   ▪ Long-term capital structure, cov-lite TLB, with remaining ~6.5 years
     tenor to July ´26; Includes loan baskets to accommodate China growth
   ▪ Moody’s / S&P corporate ratings unchanged: Ba2 / BB; stable                                                         2016             2017              2018              2019

(1) Gross debt at YE’19 includes €12.2m under current financial indebtedness, primarily explained by €6.8m accrued bi-annual interests of TLB paid in Jan’20, and €3.5m effect from implementing
     IFRS 16 amendment (renting & leasing) from 1 January 2019 onwards
(2) “Other” includes cash bank inflows/outflows from bank borrowings and other liabilities, as well as the effect of foreign exchange rate changes on cash                                         8
(3) Operating cash flow per audited consolidated statement of cash flows; after WC, taxes & interest; pre capex & dividend; 2019 figures are preliminary & unaudited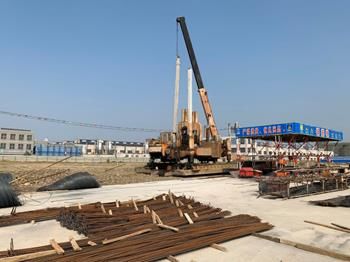
BEFESA                                                                                                         Zinc Prices & Hedging Strategy
    Hedging up to Oct ´21 improves earnings & cash flows visibility for 2020 & 2021
    € 3,000
                 Market zinc price vs. zinc hedges
                 (€/tonne)

    € 2,500
                                                                                                                                                   ~€2,310 ~€2,250
                                                                                                                             €2,168                                9M ’21:
                                                                                                                                                     €2,280
                                                                                                                    €2,160                                         ~€2,200
    € 2,000                                                                                                                       €2,051                               Closed ~half of Q3 ’21
                                                                                                €1,939              €1,876                                            targeted hedge volume

    € 1,500

                                                                                                                     2017          2018          2019          2020          9M ’21
    € 1,000
                        LME zinc           Swap           Floor                 Average hedged price (€/t)          €1,876        €2,051       ~€2,310       ~€2,250         ~€2,200
                        Average blended                                         Zinc content hedged (kt)             73.2          92.4          92.4          92.4            57.3
      € 500

              Source: London Metal Exchange (LME) zinc daily cash settlement prices; Company information

    Zinc hedges & blended average prices
                                                                                                             ▪    Hedges in place until & including Oct ‘21
                                      2018                        2019
           Unhedged             32% or 44kt @                26% or 33kt @                                   ▪    Continuous monitoring of the market to
                                 €2,468/t LME                 €2,274/t LME
                                                                                                                  close further hedges
           Hedged                  68% or 92kt                74% or 92kt
                                    @ €2,051                  @ €2,310/t                                     ▪    Majority of hedges Euro based
                                   hedge price                hedge price
           Blended (i)               €2,168                       €2,280                                     ▪    Befesa providing no collateral

                                                                                                                                                                                                9
(i) Zinc blended prices are annual averages computed based on the monthly effective LME zinc and hedging prices weighted with the respective hedged and non-hedged volumes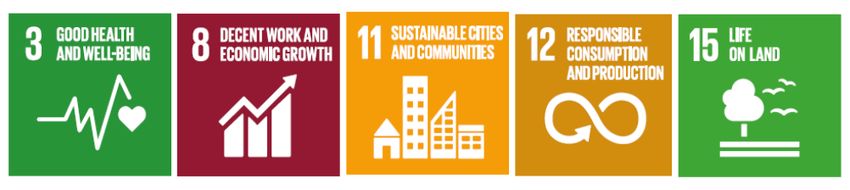
BEFESA                                                                                                                        Mid-Term Growth Roadmap
           Accelerating growth through well defined roadmap: Hedging in place;
           Organic growth on track; Building two EAF steel dust recycling plants in China

                                                                                                                                  1   Hedging
                                                                                                                                      ▪ 2019: 92.4kt @ ~€2,310/t
                                                                                                                                      ▪ 2020: 92.4kt @ ~€2,250/t
                                                                                                                                      ▪ 9M 2021: 57.3kt @ ~€2,200/t
  Indicative earnings

                                                                                                                                  2   Organic growth
                                                                                                                                      2019/2020 focus – top 5 projects:
                                                                                                                                      ▪ Steel Dust:
                                                                                                      3                                  ✓ Turkey 65kt → 110kt; Completed
                                                                                                                                         ✓ Korea washing; Completed Dec’19
                                                                                                 2021+
                                                                           2                                                          ▪ Aluminium Salt Slags:
                                                 1                                                                                       ✓ 2 tilting furnaces (Bilbao; Barcelona)
                                                                         2020/21                                                         - Expand Hannover (130kt → 170kt)

                                                            Managing Variability
                        €160m                                                                                                     3   China
                                                                                                                                      ▪ Developing two EAF steel dust
                                                                                                                                        recycling plants in two provinces:
                                                                                                                                         - #1 (Jiangsu): Completion of
                                                                                                                     Mid-term              construction expected ~end of ‘20
                         2019        Hedging                    Organic                     China
                                                                                                                     business
                        EBITDA                                  growth                                                                   - #2 (Henan): Completion of
                                                                                                                       plan
                                                                                                                                           construction expected ~mid of ´21
                                                                                                                                                                              10
Note: Chart is illustrative and size of respective arrows in the chart is not indicative to the underlying growth potential
Organic Projects in Turkey, Korea & Barcelona Completed
BEFESA 2 on Time & Budget … Supporting Growth in 2020+
Turkey 65kt to 110kt capacity expansion completed on time & budget
✓ Electric Arc Furnace (EAF) dust recycling plant “brownfield” capacity expansion from 65kt to 110kt
✓ On time and budget; Overall in around seven months – Started downtime end of January 2019
and back in operations in August 2019
✓ Ramp-up completed in Q4 2019; Delivering growth in 2020
Korea: New WOX washing plant completed on time & budget;
Ramped up in December 2019
✓ “Greenfield” investment in the 1st WOX washing plant of Befesa at Asia
✓ Completed on time and budget
✓ Ramp-up completed in December 2019; Delivering growth in 2020
Barcelona furnace upgrade completed on time and budget;
Pouring ingots; Ramped up in December 2019
✓ Barcelona 2nd Aluminium plant refurbishment with high efficiency furnaces;
All secondary production plants now with latest furnace technology (Bernburg, Bilbao, Barcelona)
✓ Completed on time and budget
✓ Ramped up volume further in December; Delivering growth in 2020
11BEFESA 3 China Plant #1: Jiangsu – Construction Progressing
Changzhou (Jiangsu) plant construction progressing;
Completion of construction expected by ~end of 2020
1
Plant #1 in Changzhou
(Jiangsu province)
Structural works – Plant buildings
Key facts of the plant
▪ 1st EAF steel dust recycling plant in China
▪ Capacity to recycle 110kt EAF steel dust p.a.
▪ Total investment: ~€42m
Status
✓ Ground breaking ceremony on 10 April 2019
➢ Construction progressing
➢ Completion of construction expected by
Structural works – Plant buildings ~end of ‘20 12BEFESA 3 China Plant #2: Henan – Preparing Site for Construction
XuChang (Henan) ground breaking ceremony held on 13 November;
Preparing site for construction; Completion of construction expected by ~mid ‘21
2
Plant #2 in XuChang
(Henan province)
Ground breaking ceremony, 13 Nov 2019
Key facts of the plant
▪ 2nd EAF steel dust recycling plant in China
▪ Capacity to recycle 110kt EAF steel dust p.a.
▪ Total investment: ~€42m
Status
✓ Signed development contract on 8 April 2019
✓ Ground breaking 13 November 2019;
Preparing site for construction
Site preparation at XuChang (Henan province) ➢ Completion of construction expected by ~mid’21 13BEFESA 2020 – Preliminary View
Completed organic growth projects of 2019 (Turkey, Korea, Barcelona) driving
volume & earnings growth in 2020; Expecting record high plant utilisation levels
in both core segments: Steel Dust >90% and Salt Slags >95%
2020 Prelim. view: Operational growth partially offset with lower YoY hedging prices
(~€2,260 ´20 vs. €2,310/t ‘19); Monitoring spot zinc & alu alloy prices as well as
TC to be settled in Mar/Apr → Providing 2020 earnings guidance in Q1 call (Apr 30)
Focus on China growth: Finish 1st EAF steel dust recycling Jiangsu plant by ~YE’20;
Progress on construction on 2nd plant in Henan to be completed by ~mid 2021;
Capex ~similar to 2019: ~€55m expansion* & ~€25m maintenance
There is still uncertainty about the impact of the coronavirus;
Short-term, we expect some delay in construction, to be quantified further;
Befesa remains committed to building its 1st plant in China at the earliest time allowed
Re-priced debt 17 Feb: Achieved 50 bps reduction to E+200, €2.6 interest savings p.a.;
Planning for ~balanced total cash flow & stable leverage at approx. current levels
Targeting a stable dividend distribution of €1.32 per share in 2020 (same as 2019)
14
* Part of which will be funded through China local loanBEFESA Sustainability at Befesa
Befesa is a vital player in the circular economy providing sustainable solutions
• Befesa recycles annually around 1.5 million tonnes of hazardous residues, avoiding landfilling and
recovering and reintroducing around 1.2 million tonnes of valuable new materials
• Befesa’s business model is vital part of the circular economy … Befesa’s core business is sustainability
• Befesa is deploying its proven environmental services technologies in other parts of the world,
like China, and will contribute to the environmental protection in these new regions
Befesa agrees with all 17 United Nations Sustainable Development Goals and supports all of them.
Based on Befesa’s business model it focuses to the contribution and impact on the following five goals:
Available ESG ratings for Befesa
15BEFESA Investor Agenda
Financial calendar Meet Befesa …
Thursday, 20 February 2020: ✓ 20-22 January 2020 – UniCredit / Kepler Cheuvreux
Preliminary Year-End Results 2019 & Analyst Call Frankfurt, 19th German Corporate Conference (GCC) 2020
✓ 04-05 February 2020 – HSBC
Frankfurt, 15th ESG Conference
✓ 05-06 February 2020 – Santander
Thursday, 26 March 2020: Madrid, XXVI Santander Iberian Conference
Annual Report 2019 11 March 2020 – Berenberg
London, Berenberg European Opportunities Conference
18 March 2020 – Berenberg
London, Berenberg Circular Economy Conference
Thursday, 30 April 2020: 19 March 2020 – JP Morgan
Q1 2020 Statement & Analyst Call London, JPM Pan-European Small/Mid Cap Conference
01 April 2020 – Mainfirst
Copenhagen, 5th MainFirst Corporate Conference
12 May 2020 – Mainfirst
Thursday, 18 June 2020: Frankfurt, 3rd MainFirst SMID CAP One-on-One Forum
Annual General Meeting in Luxembourg 13-14 May 2020 – Commerzbank
New York & Boston, Northern European Conference 2020
18-20 May 2020 – Berenberg
Tarrytown (New York), Berenberg US Conference 2020
Friday, 31 July 2020: 08-10 June 2020 – Stifel
H1 2020 Interim Report & Analyst Call Boston, 3rd Stifel Cross Sector Insights Conference
01-03 September 2020 – Commerzbank
Frankfurt, Commerzbank Corporate Conference
17-18 September 2020 – Citi
Thursday, 29 October 2020: London, SMID/Growth Conference 2020
Q3 2020 Statement & Analyst Call 21-23 September 2020 – Goldman Sachs & Berenberg
Munich, 9th German Corporate Conference
21-25 September 2020 – Baader
IR contact Munich, Baader Investment Conference 2020
Rafael Pérez 11-12 November 2020 – Goldman Sachs
Director of Investor Relations & Strategy London, Global Natural Resources Conference 2020
Phone: +49 (0) 2102 1001 0
30 November – 03 December 2020 – Berenberg
email: irbefesa@befesa.com
Pennyhill, London, Berenberg European Conference 2020
Note: Befesa’s financial reports and statements are published at 7:30 am CET 16
Befesa cannot rule out changes of dates and recommends checking them in the Investor Relations / Financial Calendar section of Befesa’s website www.befesa.comYou can also read