COMPANY UPDATE JUNE 2021 - Russel Metals
←
→
Page content transcription
If your browser does not render page correctly, please read the page content below
COMPANY UPDATE JUNE 2021
FORWARD-LOOKING INFORMATION

Certain information contained in this presentation constitutes forward-looking information within the meaning of applicable securities laws. Forward-looking information
relates to future events or future performance. All statements, other than statements of historical fact, are forward-looking statements. Forward-looking statements are often,
but not always, identified by the use of words such as “seek”, “anticipate”, “plan”, “continue”, “estimate”, “expect”, “may”, “will”, “project”, “predict”, “potential”, “targeting”,
“intend”, “could”, “might”, “should”, “believe” and similar expressions . Forward-looking information is based on estimates and assumptions. While such estimates and
assumptions are considered reasonable by us, they inherently involve known and unknown risks, uncertainties and other factors that may cause actual results or events to
differ materially from those anticipated in our forward-looking information, including the factors described below.

We are subject to a number of risks and uncertainties which could have a material adverse effect on our future profitability and financial position, which are important factors
in our business and the metals distribution industry. Such risks and uncertainties include, but are not limited to: (i) volatility in metal prices; (ii) cyclicality of the metals
industry; (iii) volatility in oil and natural gas prices; (iv) capital budgets in the energy industry; (v) pandemics and epidemics; (vi) climate change; (vii) product claims; (viii)
significant competition; (ix) sources of metals supply; (x) manufacturers selling directly; (xi) material substitution; (xii) credit risk; (xiii) currency exchange risk; (xiv) restrictive
debt covenants; (xv) asset impairments; (xvi) the unexpected loss of key individuals; (xvii) decentralized operating structure; (xviii) future acquisitions; (ixx) the failure of our
key computer-based systems, (xx) labour interruptions; (xxi) laws and governmental regulations; (xxii) litigious environment; (xxiii) environmental liabilities; (xxiv) carbon
emissions; (xxv) health and safety laws and regulations; and (xxvi) common share risk.

The above list is not an exhaustive list of the factors that may affect any of Russel Metals’ forward-looking information. While we believe that the expectations reflected in our
forward-looking information are reasonable, no assurance can be given that these expectations will prove to be correct, and the forward-looking information included in this
presentation should not be unduly relied upon. Forward-looking information speaks only as of the date of this presentation and, except as required by law, we do not assume
any obligation to update our forward-looking information. Our actual results could differ materially from those anticipated in our forward-looking information including as a
result of the risk factors described above and elsewhere in this presentation, under the heading “Risk” in our management’s discussion and analysis of financial condition and
results of operations for the twelve months ended December 31, 2020, under the heading “Risk Management and Risks Affecting Our Business” in our annual information
form for the year ended December 31, 2019 and as otherwise disclosed in our filings with securities regulatory authorities which are available on SEDAR at www.sedar.com.

                                                                                                                                                                                     2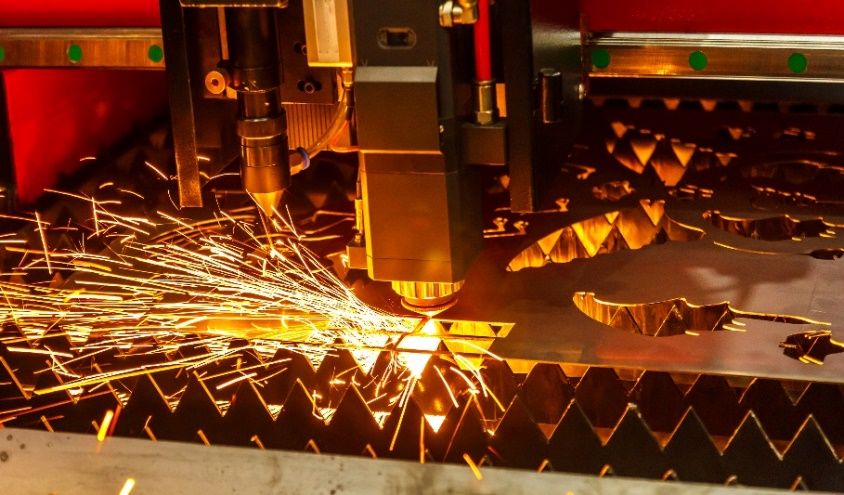
NON-GAAP MEASURES

This presentation includes a number of measures that are not prescribed by GAAP and as such may not be comparable to similar measures presented by other companies. We
believe these measures are commonly employed to measure performance in our industry and are used by analysts, investors, lenders and other interested parties to evaluate
financial performance and our ability to incur and service debt to support our business activities. These measures include EBITDA which represents earnings before interest,
income taxes, depreciation and amortization; and free cash flow which represents cash from operating activities before changes in working capital less capital expenditures.
We believe that EBITDA and free cash flow may be useful in assessing our operating performance and as an indicator of our ability to service or incur indebtedness, make
capital expenditures and finance working capital. The items excluded in determining EBITDA and free cash flow are significant in assessing operating results and liquidity.
EBITDA and free cash flow should not be considered in isolation or as an alternative to net income, cash flows generated by operating, investing or financing activities, or
other financial statement data presented in accordance with GAAP and investors are cautioned not to place undue reliance on ratios or percentages calculated using non-
GAAP measures.

OTHER DEFINITIONS:
Book Value per Share – Shareholders’ equity divided by common shares outstanding at December 31
Adjusted EBIT – Earnings before deduction of long-lived asset impairment, interest and provision for income taxes
Adjusted EBITDA – Earnings before deduction of long-lived asset impairment, interest, provision for income taxes, depreciation and amortization
Free Cash Flow – Cash from operating activities before change in working capital less capital expenditures
Interest Bearing Debt to Adjusted EBITDA – Total interest bearing debt divided by Adjusted EBITDA
Invested Capital – Net debt plus shareholders’ equity
Net Debt– Total interest-bearing debt, net of cash on hand
Return on Invested Capital – Adjusted EBIT divided by invested capital
Return on Equity – Adjusted EBIT divided by shareholders’ equity

                                                                                                                                                                      3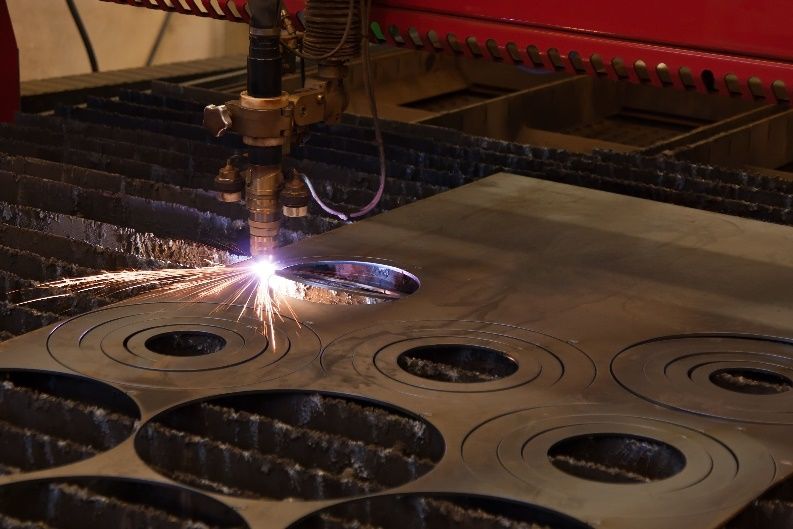
BUSINESS HIGHLIGHTS

Compelling Market Position with Strong Supplier Relationships and Market Insight
• One of the largest metals distribution and processing companies in North America
• Well-established relationships with North American steel producers and one of the largest independent steel importers in North America
• Global supplier reach provides timely access to market information and outlook to proactively manage inventory

Diversified Products and Customer Base
• Operates in three segments of metals distribution business, each with a distinct customer base and business cycle
• Approximately 31,000 end customers across a wide variety of industries including machinery and equipment manufacturing, construction, shipbuilding and natural
   resources with our largest customer accounting for less than 2% of total revenue in 2020

Flexible Business Model Through Cycles to Minimize Risk
• Management has carefully managed inventory levels to mitigate downside risk in market volatility, while maintaining sufficient supply to respond to customer orders
• Variable cost/compensation model and prudent inventory management drives counter cyclical cash flows in market downturns
• Russel Metals’ metals service centers have consistently turned inventory at higher rates than the industry average

Strong Liquidity, Cash Flow Generation and Financial Position
• Strong credit metrics
       • Net Debt/Invested Capital: 18%
       • Net Debt/LTM EBITDA: 0.8x
• $444 million of liquidity as at March 31, 2021

Experienced Management Team
• Average of ~30 years of industry experience

                                                                                                                                                                        4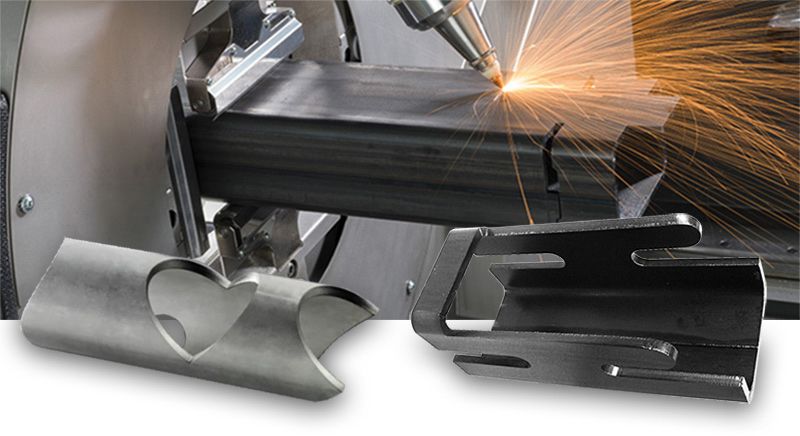
RUSSEL METALS AT-A-GLANCE
                                    Business Overview                                            Key Segments

•   Russel Metals Inc. (“the Company”) is a metals distribution company which
    distributes steel and other metal products across North America

                                                                                Metals Service
     –     One of the two largest metals service centers operating in Canada                           •   Extensive metal products line with

                                                                                  Centers
                                                                                                           value-added focus
•   The Company operates through three key segments: Metal service centers,
    Energy products and Steel distributors

•   Founded in 1929 and headquartered in Mississauga, Canada

                                                                                                       •   Field Stores (60% of revenue) that
                                                                                                           distribute highly engineered

                                                                                Products
                  Revenue by Segment (YTD March 31, 2021)

                                                                                 Energy
                                                                                                           products (eg. valves, fittings, etc.)
                                                           Steel                                       •   Line Pipe / OCTG (40% of revenue)
         Energy Products                                Distributors                                       which distributes steel pipe and
                                    Line Pipe /             11%
              22%
                                       OCTG                                                                tubular goods
                            Field
                           Stores

                                                                                Distributors
                                                                                                       •   Sells steel in larger volumes to

                                                                                   Steel
                                                                                                           other steel service centers & large
                                                                                                           equipment manufacturers

                                                            Metals Service
                                                              Centers
                                                                67%
                                                                                                                                           5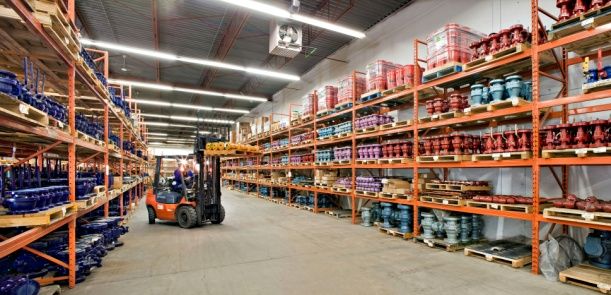
TABLE OF CONTENTS

I.    Market Trends
II.   Company Overview
III. Financial Overview

                          6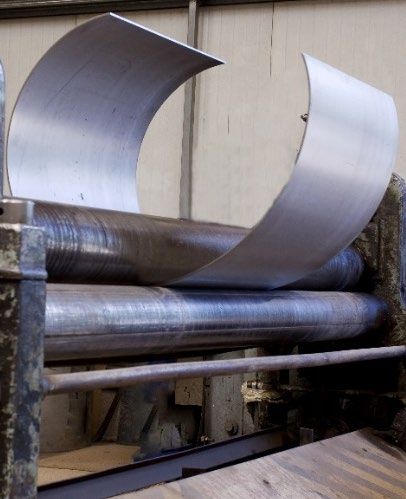
I. MARKET TRENDS

STEEL PRICES VS. RUSSEL EBIT
HR Sheet, Plate & Russel EBIT(1)
$1,400 $140
Carbon Plate HR Sheet EBIT
$1,200 $120 $1,800
$1,600
Carbon Plate / HR Sheet (US$ per Ton)
$1,000 $100
$1,400
$800 $80 $1,200
EBIT (millions)
$1,000
$600 $60
$800
$400 $40 $600
$400
$200 $20
Jul/03/20
Jun/03/20
Aug/03/20
Sep/03/20
Nov/03/20
Dec/03/20
Jan/03/21
Apr/03/20
Oct/03/20
May/03/20
Feb/03/21
Mar/03/21
Apr/03/21
May/03/21
$0 $0
Q1-2011
Q3-2011
Q1-2012
Q3-2012
Q1-2013
Q3-2013
Q1-2014
Q3-2014
Q1-2015
Q3-2015
Q1-2016
Q3-2016
Q1-2017
Q3-2017
Q1-2018
Q3-2018
Q1-2019
Q3-2019
Q1-2020
Q3-2020
Q1-2021
Source: American Metal Market
(1) EBIT has been adjusted to exclude inventory provisions, asset impairments, product warranty provision and acquisition costs in
2014, 2015, Q3 2019 and Q4 2019, and gain on sale of properties in 2016 and 2020 8
C$ / ton

                                                          $150
                                                                 $200
                                                                        $250
                                                                                  $300
                                                                                                 $350
                                                                                                          $400
                                                                                                                 $450
                                                                                                                         $500
                                                                                                                                   $550
                                                                                                                                                  $600
                                                 Jan-11
                                                 Jul-11
                                                 Jan-12
                                                 Jul-12
                                                                                                                                                     AMM Scrap Values

                                                 Jan-13
                                                 Jul-13
                                                 Jan-14
                                                 Jul-14
                                                 Jan-15
                                                 Jul-15
                                                 Jan-16
                                                 Jul-16
                                                 Jan-17
                                                 Jul-17
                                                 Jan-18
                                                 Jul-18
                                                 Jan-19
                                                 Jul-19
                                                 Jan-20
                                                                                                                                                                                   SCRAP AND STEEL PRODUCTION

                                                 Jul-20

    Source: American Metal Market
                                                 Jan-21

                                                                                     Net Tons (000's)
                                                         700
                                                                 900
                                                                          1,100
                                                                                         1,300
                                                                                                        1,500
                                                                                                                 1,700
                                                                                                                           1,900
                                                                                                                                          2,100

                                                Jan-11
                                                Jul-11
                                                Jan-12
                                                Jul-12
                                                Jan-13
                                                Jul-13
                                                Jan-14
                                                                                                                                                         US Raw Steel Production

                                                Jul-14
                                                Jan-15
                                                Jul-15
                                                Jan-16
                                                Jul-16
                                                Jan-17
                                                Jul-17
                                                Jan-18
                                                Jul-18
                                                Jan-19
                                                Jul-19
                                                Jan-20
                                                Jul-20
9

                                                Jan-21
    Source: American Iron and Steel Institute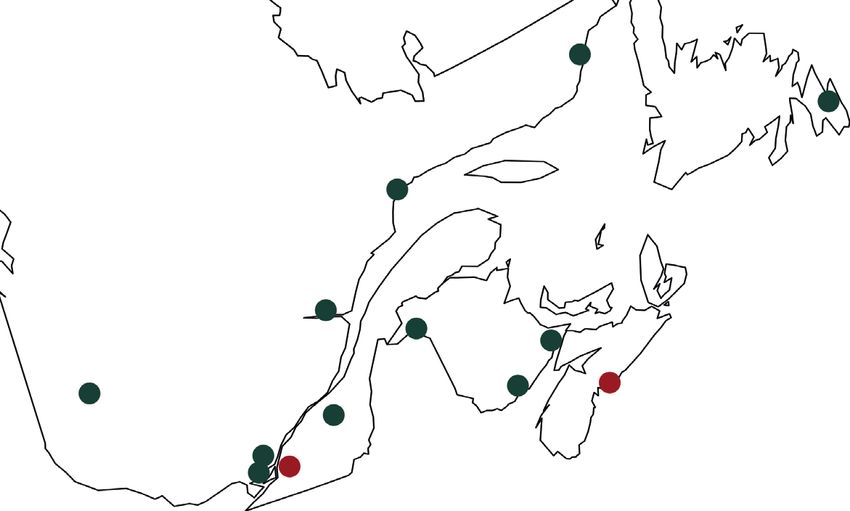
SERVICE CENTER BUSINESS CONDITIONS

Source: Metals Service Center Institute   Source: Metals Service Center Institute

                                                                                    10
NORTH AMERICAN RIG COUNTS
1000 2250
900 2000
Canada U.S
800
1750
700
1500
600
1250
500
1000
400
750
300
500
200
100 250
0 0
Source: Baker Hughes
11II. COMPANY OVERVIEW
SERVICE CENTER / DISTRIBUTION LANDSCAPE
Russel is one of the largest service center companies in North America
Ranked by Revenue
(in US$ billions)
2019 2018
Reliance Steel & Aluminum Co. $11.0 $11.5
Ryerson Inc. $4.5 $4.4
Thyssenkrupp Materials NA Inc. $3.2 $3.2
Kloeckner Metals Corp. $3.0 $3.2
Russel Metals Inc. $2.8 $3.2
Samuel, Son & Co $2.8 $2.9
Toyota Tsusho America $2.5 $2.3
O'Neal Industries Inc. $2.4 $2.7
Steel Technologies LLC $2.4 $2.6
Worthington Industries $2.2 $2.5
Alro Steel Corp. $2.0 $2.0
Olympic Steel Inc. $1.6 $1.7
Steel Warehouse Co. $1.3 $1.2
Coilplus Inc. $1.3 $1.4
Triple-S Steel Holdings Inc. $1.2 $1.1
Source: Metals Center News – September 2020
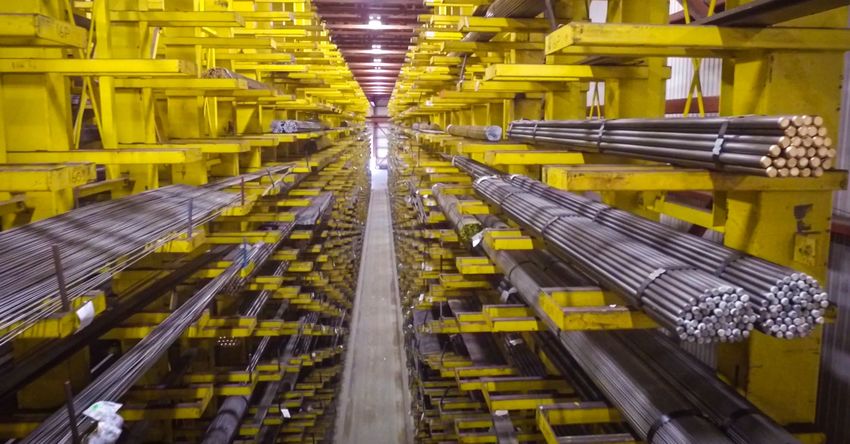
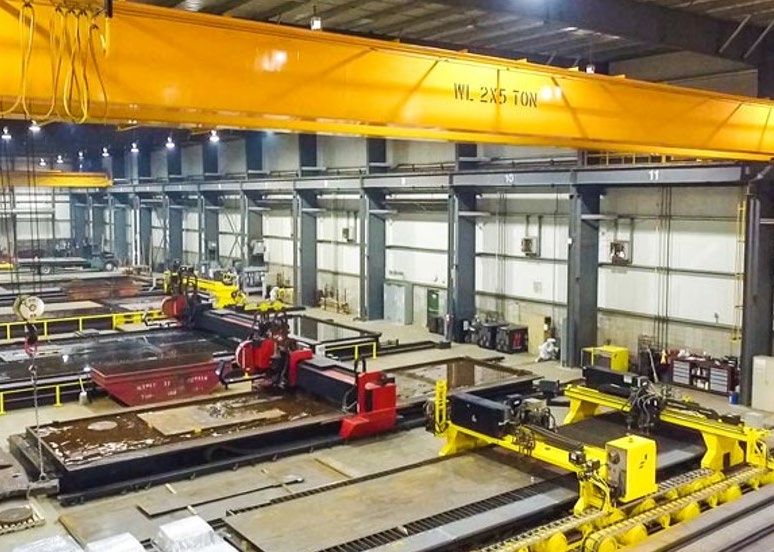
13VALUE-ADDED PROCESSING
14VALUE-ADDED PROCESSING – HUB & SPOKE APPROACH
Wisconsin U.S. South Southern Ontario
Western Canada Quebec and Atlantic
15VARIABLE COST MODEL – BREAKDOWN OF CASH COSTS
QUARTER ENDED MARCH 31, 2021 YEAR ENDED DECEMBER 31, 2020 YEAR ENDED DECEMBER 31, 2019
$761 Million $2,559 Million $3,499 Million
Operating Operating Employee Operating Employee
Employee Expenses -
Expenses - Operating Expenses - Expenses - Expenses -
Expenses - Fixed, $207
Variable, $15 Expenses - Variable, $58 Operating Variable, $66 Fixed, $265
Fixed, $59 Employee Operating
Fixed, $34 Expenses - Expenses - Employee Expenses -
Employee
Variable, $20 Fixed, $112 Expenses - Fixed, $109
Expenses -
Variable, $23 Variable, $31
Cost of
Materials, Cost of
Cost of
$2,162 Materials,
Materials,
$3,028
$629
Note: Figures exclude mark-to-market adjustments for stock-based compensation, gains/losses on sale of assets, asset impairment and foreign exchange.
16COUNTERCYCLICAL CASH FLOWS
Adj. EBITDA positive throughout the cycles; working capital repatriation during market downturns.
Quarterly EBITDA vs. Change in Working Capital ($000’s)
$250,000
$200,000
$150,000
$100,000
$50,000
$-
$(50,000)
$(100,000)
$(150,000)
Q1 2007 Q1 2008 Q1 2009 Q1 2010 Q1 2011 Q1 2012 Q1 2013 Q1 2014 Q1 2015 Q1 2016 Q1 2017 Q1 2018 Q1 2019 Q1 2020 Q1 2021
Change in Working Capital EBITDA
Adj. EBITDA
Note: Adj. EBITDA has been adjusted to exclude inventory provisions, asset impairments, product warranty provision, and gain on sale of properties
from 2014, 2015, 2016 and 2020
17DIVERSIFIED BUSINESS
Geography - 126 Locations Supplier by Products Type Product Mix
Tubing & Flanges, Fittings
Other 5% Non-Ferrous
United OCTG, 2% & Valves, 1% Bars 6%
Pipe, 3% 4%
States - 31
Flat Roll, Plate, 4%
Others, 51% Structurals -
Long Products,
Plate, Pipe, 5% 27%
Flat Rolled 9%
Tubing, 5%
Plate, 6%
Pipe 16%
Tubing, 6%
Plate - 17%
Canada - 95
Flat Roll, Plate,
Long Products
- 7% Long Products - Flanges 16%
10%
Customers
• ~30,000 customers
• Average invoice < $2,500
• Top 10 customers < 10% of 2020 FY revenues
18ENERGY SUB-SEGMENTS
Field Stores Line Pipe/OCTG Energy Strategy:
• Reduce absolute and relative
exposure
• Continue to repatriate
substantial working capital
from OCTG/Line Pipe
• Canada: recent JV
announcement
• US: to be completed by
end of 2021
• Distribution of highly engineered products • Distribution of steel pipe and oil country
(eg. valves, fittings, flanges, etc.) tubular goods (eg. drill pipe and casings)
• High customer service • Commodity business
• Focus on repeat maintenance and repair work • Business is tied to new drilling activity in
for existing energy assets Canada and US
• Comparable gross margin profile to metals • Higher volatility and lower gross margins than
service centers metals service centers
• 60% of energy segment’s 2020 revenues • 40% of energy segment’s 2020 revenues
• $190 mm of net working capital (3/31/21) • $210 mm of net working capital (3/31/21)
19CANADIAN OCTG/LINE PIPE TRANSACTION
• On April 14, 2021 Russel announced an important transaction involving its Canadian OCTG/Line Pipe business
• Merger of Russel’s business (“Triumph”) with the comparable business from Marubeni-Itochu (“Hallmark”) to form TriMark
• Russel will realize a significant portion of its contributed value in cash and retain a 50% interest in the JV
• The combined company will have greater scale and product mix to serve its customers
• Russel contributions:
Marubeni – Itochu Tubulars
Russel Metals Inc.
America, Inc.
• Net assets (mostly inventory less AP) - book value of ~$111
mm
• Retain AR ($59 mm at 3/31/21)
100% 100%
• ~$170 mm of capital currently deployed in Triumph
• Russel to received:
Triumph Tubular & Supply Ltd. Hallmark Tubulars Ltd.
(“Triumph”) (“Hallmark”) • Cash ~$79 mm from TriMark + monetization of retained AR
• Near term cash realization equates to ~$138 mm
50% 50% • Preferred shares in TriMark - $32 mm (7% dividend)
• 50% of common shares in TriMark
TriMark Tubulars Ltd. • Triumph’s standalone historical results - low margins/returns:
• 2020: Revenue $165 mm/EBIT $(3) mm
• 3 Year Avg: Revenues $267 mm/EBIT $10 mm
• Transaction subject to regulatory approval (target close Q2/Q3)
20RETURN (EBIT) ON NET ASSETS - OVER THE CYCLE
• The OCTG/line pipe segment 50%
generated an average annual
45%
RONA ofESG FOCUSED
Aggregate Emissions Sources:
Environmental
• Environment Management System
• Low carbon emissions from operations Electricity
• GHG emissions in 2020 were 53,345 23%
CO2(e) - emission intensity of 0.00001984 Diesel Fuel
tonnes CO2(e) per dollar of revenue 40%
Governance Propane
3%
• Independent Board and Audit Committee
• Majority Voting
Gasoline
• Code of Business Conduct 4%
• Independent Whistleblower program
• Female/Visible Minority: 45% Board; 38% Corporate Management
Natural Gas
Social 30%
• Structured H&S Program
• Ethical, Privacy and Social Policies Health and Safety Metrics:
• Community Involvement 2020 2019 2018
• Scholarship fund for children of employees Number of Employees 3,010 3,400 3,420
Number of Lost Time Accidents 9 21 31
Number of Lost Time Days 345 592 962
Frequency * 0.29 0.61 0.89
Severity * 11.18 17.40 27.73
Note: Disclosure updated on Russel’s website when data is available Medical Aids * 94 163 208
First Aids * 131 236 244
* See Russel Metals Annual Information Form for definitions and additional information
22III. FINANCIAL OVERVIEW
SUMMARY FINANCIAL RESULTS
 $ mm, unless otherwise stated                            Q1 2020                 Q4 2020                Q1 2021                        Q1 2021 Observations:
 Income Statement:
 Revenues                                                   $815                    $671                   $885
                                                                                                                     •   Substantial improvement for Q1 vs. Q4
 Gross Margin ($ mm/%)                                 $152 / 18.7%            $139 / 20.8%           $255 / 28.8%   •   Gross margin improving with market conditions
                                                                                                                     •   Q1 EBITDA/EBIT impacted by:
 EBITDA(1) ($ mm/%)                                      $39 / 4.8%             $41 / 6.2%            $129 / 14.6%          + Wage subsidies: $3 mm vs. $8 mm in Q4
 EBIT(1) ($ mm/%)                                        $24 / 2.9%             $27 / 4.0%            $114 / 12.9%          − Mark-to-market of stock-based comp expense: $2 mm
                                                                                                                                 (comparable to Q4)
 Interest Expense                                             $9                     $9                      $6      •   Interest expense savings reflect the benefit of last year’s
                                                                                                                         refinancing
 Net Income                                                  $11                    $(9)                    $81
 EPS                                                        $0.17                 $(0.14)                  $1.29
 Cash Flow:
 Changes in non-cash working capital                         $36                     $85                   $(17)     •   Build WC as business recovers. Increases in AR ($128 mm) and
                                                                                                                         Inventory ($11 mm) mostly offset by increase in AP ($125 mm)
 Capex                                                       (7)                    $(6)                    $(6)     •   Capex remains below depreciation
 Balance Sheet:
 Net Debt                                                   $444                    $267                   $202      •   Total debt of $294 mm offset by cash/investments of $92 mm
                                                                                                                     •   Liquidity continued to remain strong
 Shareholders’ Equity                                       $980                    $865                   $932      •   Declared dividend of $0.38/share
 Available Liquidity                                        $393                    $406                   $444
 Net Debt/Capitalization                                     31%                    24%                     18%
(1) Figures are Adjusted EBITDA and Adjusted EBIT for Q1 2020 and Q4 2020. The Adjustments exclude non-cash asset
    impairment charges of $30.1 mm in Q4 2020 and $3.7 mm in Q1 2020.

                                                                                                                                                                                 24
SEGMENT BREAKDOWN: OPERATING RESULTS
Revenue (C$ millions) Gross Margins %
$700 35% 34%
$585 33%
$600 $535 30%
$474 25%
$500 $437 25%
$412 $419 21% 21% 21%
$393
$373 19% 19% 19%
$400 20%
16% 17% 15%
19% 15% 17%
$300 $343 15%
$298 $298 $316 17%
$226
14% 14% 12%
$200 $158 $176 10% 11%
$149 11% 11%
10%
$100 5%
$100 $94 $81
$62 $64 $62 $74 $74
4%
$0 0%
Q2 2019 Q3 2019 Q4 2019 Q1 2020 Q2 2020 Q3 2020 Q4 2020 Q1 2021 Q2 2019 Q3 2019 Q4 2019 Q1 2020 Q2 2020 Q3 2020 Q4 2020 Q1 2021
MSC Energy Distributors MSC Energy Distributors
Earnings from Operations (C$ millions)
$120
$106
$100
$80
$60
$36
$40 $26
$25
$24 $18
$18 $16
$20 $23 $9
$16 $6 $2 $5
($2) $6
$0 $6 $3 $2
$1 $2 ($7)
($3) ($4)
($20)
Q2 2019 Q3 2019 Q4 2019 Q1 2020 Q2 2020 Q3 2020 Q4 2020 Q1 2021
MSC Energy Distributors 25SEGMENT BREAKDOWN: INVENTORIES
Inventory Trends MSC:
$500
• Tonnage remains low; values have increased
$470
• Inventory turns at 4.8x
$450
Distributors:
$400
• Inventory remains low; procurement lead
$350 $329
$317 times are extended
$300
$297 • Purchase orders have grown, with most
committed on a back-to-back basis
Million $
$250
$197 Energy:
$200
• Revenue pick-up and limited procurement
$150 has reduced inventories
$100
$95
$74
• Energy as % of total portfolio has declined
from 55% to 33% (pro forma the Marubeni-
$50
Itochu transaction)
$0
Metals Service Centers Steel Distributors Energy
June 30, 2020 March 31, 2021 March 31, 2021 - Pro Forma Joint Venture
26LIQUIDITY AND CAPITAL STRUCTURE SUMMARY
• Russel has over $400 mm of liquidity and no debt maturities for several years.
12/31/20 3/31/21
(C$ mm) (C$ mm)
Cash $26 $92
Bank Lines - Maturity 2023 -- --
5.75% Notes - Due 2025 $147 $147
6% Notes - Due 2026 $147 $147
Total Debt $294 $294
Shareholders Equity $865 $932
Net Debt/Invested Capital 24% 18%
Net Debt/LTM Adj EBITDA 1.7x 0.8x
Liquidity $406 $444
276600 Financial Drive, Mississauga, Ontario L5N 7J6
Email: info@russelmetals.com
Visit us at: www.russelmetals.com
Investor Relations Line: 905.816.5178You can also read