WEBJET LIMITED FY19 RESULTS PRESENTATION - B2C TRAVEL B2B HOTELS
←
→
Page content transcription
If your browser does not render page correctly, please read the page content below

WEBJET LIMITED
         FY19 RESULTS
         PRESENTATION
         JOHN GUSCIC, Managing Director
         TONY RISTEVSKI, Chief Financial Officer

         22 August 2019

              B2C TRAVEL                           B2B HOTELS

Page 1
$$3.8
                                                                3 BN
                                                                   BN                  $366.4
                                                                                        $291 MM         $$ 124.6
                                                                                                           87.4 MM
Ongoing                                                        TTV                     Revenue
                                                                                       Revenue    (2)
                                                                                                         EBITDA
Record                                                                                                     Up
                                                                                        Up
                                                                                         Up54%             Up 71%
Performance                                            (1)    Up 54%
                                                                 27%                        26%               43%

Demonstrating
Profitable Global                                                                                98%
Growth                                                                 $ 43.2
                                                                         81.3 M                $ 43.2 M
                                                                                              Adjusted
                                                                        NPAT                    NPAT
                                                                        (before AA3)            Cash
                                                                         Up
                                                                         Up 30%
                                                                            46%              Conversion
                                                                                                 Up 30%   (4)

(1)   Shows results for FY19 Continuing Operations -
      refer to page 35 for full description
(2)   Excludes Revenue as Principal
(3)   Acquisition Amortisation
(4)   Refer to page 28 for calculation

Page 2
WebBeds is now the largest and fastest growing business
                                                      •   In just 6 years since start-up, delivered $2.2 billion TTV and $67.3 million EBITDA
                                                      •   The clear #2 global B2B player and fastest growing B2B business in the world
                                                      •   Organic EBITDA up 30%

FY19                                                  •   Focus on delivering profitable growth – TTV margins 8.6%(1) (9.4% excluding Thomas Cook);
                                                          EBITDA margins 36.4%

Key
                                                      Successful integration of DOTW
highlights                                            •   Cost synergies ahead of plan; revenue synergies tracking to plan
                                                      •   Successful framework for extracting acquisition synergies
                                                      •   Pipeline of further acquisitions identified

                                                      Webjet OTA delivering improved margins
                                                      •   Delivering profitable growth in a tough domestic travel market – TTV margin 10.9%; EBITDA
                                                          margin 40.4%
                                                      •   Continues to gain share – Webjet is now 50% of the OTA flights market, more than 5% of the
                                                          domestic flights market and 4% of the international flights market

                                                      Record $124.6 million EBITDA
(1)   Includes Thomas Cook TTV for which no revenue   •   Notwithstanding costs expensed in launching Umrah Holidays International ($1.4 million) and
      was recognised until 1 June 2019
                                                          impact of Christchurch incident on Online Republic (over $1 million)
Page 3
WebBeds is now the largest business by EBITDA (1)

 EBITDA                                                $160M
                                                                                                                 $124.6M
                                                       $140M
 more than                                             $120M
 doubled in 2                                          $100M
                                                                                            $87.4M                 $67.3M

 years                                                  $80M    $51.0M
                                                                                            $27.2M

                                                                 $0.4M                      $13.3M                 $12.5M
                                                        $60M
                                                                $15.0M
                                                        $40M
                                                                                            $58.7M                 $60.8M
                                                        $20M    $43.1M

                                                         $0M    ($7.5M)                     ($11.7M)              ($15.9M)
                                                       ($20M)
                                                                 FY17                        FY18                  FY19
(1)   EBITDA is for Continuing Operations - refer to
      page 35 for full description                               WEB      Online Republic    WebBeds B2B   Corporate

Page 4
(1)
                                                         EBITDA Margin

Profitable
growth
EBITDA
margins
continue to
increase

(1)   For Continuing Operations - refer to page 35 for     (2)
      full description
(2)   B2C is Webjet OTA and Online Republic
      combined

Page 5
B2B HOTELS

         WebBeds
         DIGITAL PROVISION OF HOTEL ROOMS TO
         GLOBAL PARTNERS

Page 6
A$                       FY19                FY18         Change
                                                   Bookings ('000s)                               3,444              2,277             51%

                                                   TTV                                        2,154 million       1,354 million        59%
                                                             (1)                              184.5 million       114.0 million        62%
WebBeds                                            Revenue
                                                   EBITDA                                      67.3 million       27.2 million         148%

delivering                                         TTV / Revenue Margin      (2)                  8.6%                8.4%             15bps

                                                   TTV / Revenue Margin (excl TC)                 9.4%                9.2%             23bps
profitable                                         EBITDA Margin                                  36.4%              23.8%             1,261bps

growth                                             Organic EBITDA     (3)                      78.4 million       60.2 million         30%

                                                  Increased scale allowing focus on more profitable growth
                                                  • TTV and EBITDA margins continue to improve in all regions
                                                  • Direct contracts now account for over 55% of sales
(1)   Revenue is shown net of costs of sale as    • Costs as % TTV continue to decline – DOTW cost synergies tracking ahead of plan; Rezchain helping
      principal (i.e. on agency basis)
(2)   TTV/ Revenue Margin includes Thomas            reduce costs
      Cook TTV for which no revenue was
      recognised until 1 June 2019                • On a constant currency basis, FY19 EBITDA $65.1 million
(3)   FY18 Organic EBITDA includes $10.3M for
      JacTravel (1 July 2017 to 31 August 2017)   • FY19 EBITDA is after expensing $1.4 million in the launch of Umrah Holidays International
      plus $22.7M for DOTW (full 12 months).
      FY19 Organic EBITDA includes $11.1M for     • Profitable growth accelerating – organic EBITDA growth up 24% in 1H; up 34% in 2H (over pcp) assisted
      DOTW (1 July 2018 to 21 Nov 2018).
                                                     by synergies
TC = Thomas Cook                                  • Efficiencies coming through – each incremental $100 of TTV delivering $5 EBITDA
Page 7
A$                         FY19                   FY18            Change
               Bookings ('000s)                       1,628                  1,296                26%

               TTV                                 1,122 million           775 million            45%

WebBeds        EBITDA                              35.7 million           17.6 million            102%

Europe       Outstanding EBITDA in a difficult market environment

Highlights   • Strong growth despite ongoing impact of record hot 2018 European summer, uncertainty surrounding
                Brexit and poor growth in Germany (the largest European travel market)
                   • UK TTV up +72%
                   • Germany TTV up +78%
             • Focus on selling directly contracted inventory (in particular contracts acquired from Thomas Cook) and
                increasing margins
             • Broad inventory offering across both city and beach destinations
             • Direct contracts now account for more than 70% of sales in a number of key European cities including
                Amsterdam, Barcelona, Berlin, London, Milan, Paris, Rome and Venice; as well as important global
                cities including New York and Dubai
             • Ongoing revival of important beach destinations – Turkey, Egypt and Tunisia all saw TTV growth above
                100%
             • Retirement of surplus JacTravel IT platform completed; over 4,500 contracts migrated to other systems
             • Efficiencies coming through – each incremental $100 of TTV delivering $5 EBITDA

Page 8
A$                        FY19                   FY18           Change
                Bookings ('000s)                       214                    142                50%

                TTV                                 197 million           116 million            70%

WebBeds
Europe        Thomas Cook investment has delivered in full on our sourcing expectations
              • Over 3,000 direct contracts acquired from Thomas Cook are available to all WebBeds customers
Thomas        • Sales of these direct contracts to parties other than Thomas Cook are at full margin and were a key
                 contributor to increased margins in FY19
Cook          • All key Thomas Cook platforms and geographies are now connected. WebBeds inventory is currently
                 sold to Thomas Cook customers in Nordics, Germany, Austria, Switzerland, UK, Poland, France, Czech
partnership      Republic, Belgium, Netherlands, Hungary, China and Russia
              • As of 1 June 2019, we now earn %TTV for all sales made to Thomas Cook. This TTV margin is
update           significantly lower than for the rest of the WebBeds business

              Revised FY20 TTV expectations
              • In light of the issues currently impacting Thomas Cook, we have revised TTV expectations and now
                 expect FY20 TTV from Thomas Cook to be between $150-200 million (down from $300-450 million at
                 1H19)
              • All costs associated with supporting the Thomas Cook agreement are already expensed in WebBeds
                 Europe results. We therefore expect the majority of incremental revenue to flow through to EBITDA
              • We expect our agreement with Thomas Cook to remain unchanged under proposed new ownership
Page 9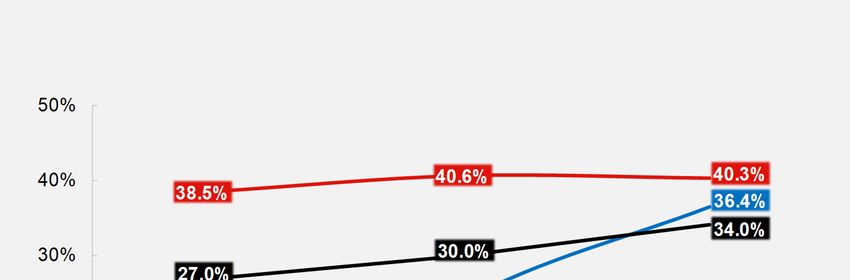
A$                        FY19                   FY18            Change
               Bookings ('000s)                        952                    571                67%

               TTV                                 623 million            385 million            62%

WebBeds        EBITDA                              25.8 million           11.6 million           123%

AMEA         Middle East & Africa – ongoing growth in a difficult market
             • Market share continues to improve – driven by DOTW and organic growth
Highlights   • Now the regional market leader – #1 player operating across 36 markets
             • Underlying market continues to struggle; Average Booking Value (ABV) down 5%
             • Our #1 position driving scale benefits
             • EBITDA growth continues to be driven by increased sales through higher margin supply sources

             The Americas – delivering substantial EBITDA
             • North America – strong bookings growth coming through increased number of large customers as well
                as optimising delivery platforms to facilitate higher booking volumes
             • Latin America – now operating in 17 markets across Latin America. Strong growth in several markets in
                2H19
             • Continue to invest in expanding our presence in the Americas

             Efficiencies coming through – each incremental $100 of TTV delivering $6 EBITDA

Page 10
A$ FY19 FY18 Change
Bookings ('000s) 863 410 111%
TTV 409 million 195 million 110%
WebBeds EBITDA 5.8 million (2.1 million) 380%
Asia FY17 and FY18 investments now delivering EBITDA
Pacific • Now the #2 player in the region – operating in 17 countries
• Strong EBITDA growth in 2H19
Highlights • 1H19 ($0.6 million) ; 2H19 $6.4 million
• Driven by DOTW, as well as organic growth coming through from FY17 and FY18 investments in
expanding sales and contracting teams
• Key highlights include:
• Strong increase in large key accounts
• Connection of key customers in China and Japan
• Integration of new 3rd party providers
• Increased scale in key source markets of South Korea, Indonesia, India and Hong Kong
• Not yet at scale and efficiencies already coming through – each incremental $100 of TTV delivering
over $3 EBITDA
Page 11Significant new market opportunity
WebBeds •
•
The Kingdom of Saudi Arabia has a vision to welcome 30 million religious visitors a year by 2030
Opportunity to leverage the WebBeds global distribution network and strong partnership with hotels in
Umrah the Kingdom of Saudi Arabia to offer a range of religious travel packages
Holidays • Umrah Holidays International
• Launched in February 2019, it is the first truly online B2B provider of travel services for religious
International pilgrims
• The first online B2B operator to provide a sophisticated integrated visa application tool in
accordance with the Kingdom of Saudi Arabia regulations
• 51% owned by WebBeds; 49% owned by partners who bring deep religious tourism experience
providing ground services across Umrah and Hajj
• WebBeds expensed $1.4 million in 2H19 to build out capabilities in the region
• Currently GSAs operating in 5 markets with a further 4 starting in 1H20
• Key clients signed in China and India
• We estimate the market opportunity is c. US$10 Billion TTV
• Similar market characteristics to the Middle East B2B business at launch (eg customer profiles,
relationship driven market)
• We believe Umrah Holidays International offers meaningful EBITDA potential by FY22
Page 12DOTW Successful integration into WebBeds regional structure; cost synergies tracking ahead of plan
• Acquisition announced 5 November 2018 and completed on 21 November 2018
Successful • Since 1 January 2019, DOTW has been integrated into the WebBeds regional structure (6 weeks post
completion)
integration • Key management remains in place
• Cost synergies
• Tracking ahead of anticipated cost synergies of A$4 million pa (excluding one-off costs to
achieve), commencing in FY19 with full year impact in FY20
• Revenue synergies
• Cross-sell opportunities tracking in line with JacTravel experience
• On target to deliver anticipated revenue synergies of A$10 million pa (excluding one-off costs to
achieve). Expected to achieve in full in FY20
• 2H19 focus has been on embedding the business and optimising effectiveness of acquired direct
contracts
• Following the successful integrations of JacTravel and DOTW, we have developed a framework to
extract synergies which can be used for future acquisitions
Page 13We expect between $27 to $33 million additional EBITDA in FY20 (revised from at least $40 million
WebBeds at 1H19)
• In addition to organic growth in our existing WebBeds businesses, we expect the following to deliver
FY20 EBITDA between $27 - $33 million additional EBITDA in FY20
opportunities • DOTW – additional 5 months contribution and revenue and cost synergies expected to be
achieved in full in FY20
• Thomas Cook – expected FY20 TTV of $150-200 million (down from $300-450 million at 1H19)
with majority of incremental revenue to flow through to EBITDA
• Asia-Pacific - significant growth opportunities in China, India and Japan offer potential for
additional $75-125 million TTV in FY20
• We have revised expectations from 1H19 due to:
• Reduced TTV expected from Thomas Cook due to the impact of current issues facing Thomas
Cook
• Some of the EBITDA expected from DOTW cost synergies and Asia-Pacific growth opportunities
have been realised earlier than anticipated and are included in FY19 results
Page 14“8/4/4” profitability target for FY22
WebBeds • By FY22 we believe we can deliver “8/4/4” – 8% revenue/TTV and 4% costs/TTV to drive 4%
EBITDA/TTV
FY22 “8/4/4” • Equating to 50% EBITDA margin
target • IT platforms
• We continue to evaluate and assess options in relation to the various B2B platforms, focusing on
maximising customer connectivity while meaningfully reducing operating costs
• Retirement of surplus JacTravel IT platform completed in 2H19. We continue to roll out
WebConnect to our supply partners to improve efficiency of connections
• We expect IT operating costs to grow at a lower rate than revenue over the next 2-3 years
• Rezchain
• Rezchain is already reducing operating costs and improving customer experience within all our
WebBeds businesses. It is implemented across all platforms in all geographies – DOTW platform
connected in April 2019. We expect to connect Thomas Cook as our first external party in
calendar year 2019
• Rezchain has been a key contributor to FY19 WebBeds result and we expect it to play a key role
in delivering our 8/4/4 target
• Efficiencies coming through in all regions – each incremental $100 of TTV delivering $5 EBITDA
Page 15WEBJET.COM.AU
AUSTRALIA / NEW ZEALAND
Page 16A$ FY19 FY18 Change
Bookings ('000s) 1,565 1,549 1%
Driving TTV 1,378 million 1,345 million 2%
margin Revenue 150.5 million 145.6 million 3%
improvement EBITDA 60.8 million 58.7 million 4%
in a difficult TTV / Revenue Margin 10.9% 10.8% 10bps
EBITDA Margin 40.4% 40.3% 5bps
market
Solid EBITDA performance notwithstanding a tough domestic travel market
• 2H19 travel market significantly impacted by the Federal election, a slower than expected post-
election rebound and slowing economic conditions
• Overall bookings up 1%; TTV up 2%; ABV up 1%
• TTV margins up 10bps
• Increased sales of higher margin products across both flights and ancillary products
• EBITDA margins up 5bps
• Scale benefits and ongoing focus on managing costs helping reduce costs. Costs up 3%, mostly
increased marketing spend for ancillary products
• Have seen significant uplift in TTV for 6 weeks to 12 August 2019 – up 9% over pcp
Page 17Webjet OTA is now 50% of the entire OTA flight market
Market Growth
Flight Webjet Growth
bookings 1.0% 0.8% 0.4%
Webjet Domestic Domestic
Year-on-year
continue to Webjet flight
Bookings (2) Bookings (3)
bookings (1)
outperform 6.8% 4.0%
the market Webjet International
Bookings (4)
International Bookings (5)
(1) Year-on-year Webjet flight bookings growth
• Outperforming the market by around 2 times
shows 12 months to June 2019
(2) Webjet Domestic growth shows 11 months • Webjet now more than 5% of the domestic flight market
to May 2019
(3) Domestic Passenger numbers growth – 11
months to May 2019. Source BITRE
• Webjet now around 4% of the international flight market
(4) Webjet International growth shows 11
(5)
months to May 2019
Outbound travelling passengers – 11
• Market still offers substantial headroom for growth
months to May 2019. Source BITRE
Page 18• TTV margin increase coming through Key FY19 initiatives
Brand across both flights and ancillary products
• Continued growth in size and scale is
strength helping deliver value to both airlines and
other partners
• Introduction of HSBC Interest Free – letting
customers book now and pay later
• Recommitted to Travelport to ensure best placed to
driving higher • Ongoing investment in partnerships to
ensure the best content receive real time content from more than 400 carriers
around the world
TTV margin • Wide range of ongoing technological
improvements and product
• Launch partner for the Qantas NDC program
• Complex multi-stop flights available on mobile
sales across enhancements
platforms
• Payment option improvements including integration of
entire product • Higher margin ancillary products continue
to grow
POLI and PayPal added to mobile apps
range • Continue to account for c.25% of
revenues
• Enhanced user experience for mobile sites
• Enhancements to automate Change My Booking
processes
• Technology improvements continue to
• User Experience enhancements for Dynamic
facilitate greater cross-sell Packages
• Growth continues to come through • Enhanced LCC flight offerings adding Cebu Pacific
Packages and Hotels and increasing available ancillaries across LCC’s
• Free seat selection for major airlines
Page 19ONLINE REPUBLIC
Global Marketplace
Page 20A$ FY19 FY18 Change
Bookings ('000s) 496 501 1%
Improved TTV TTV 299 million 313 million 4%
margins Revenue 31.4 million 31.5 million 0%
but 2H19 EBITDA 12.5 million 13.3 million 6%
impacted by TTV / Revenue Margin 10.5% 10.1% 41bps
external EBITDA Margin 40.0% 42.1% 217bps
events Strategy to focus on profitable bookings improved TTV margins but 2H19 impacted by Christchurch
incident
• Improved TTV margins reflect strategy to focus on higher margin, profitable bookings
• Following the Christchurch incident in March 2019, demand for travel in New Zealand fell and Motorhomes
in particular was severely impacted. We estimate the event had a more than $1 million EBITDA impact on
2H19 results. We are starting to see a rebound with TTV up 4% over pcp (as at 12 August 2019)
• Cars did well during the year but Cruise continued to underperform.
• New senior management appointments made to improve performance
• Lindsay Cowley appointed CEO in June 2019 bringing relevant global and business transformation
experience
Page 21 • General Manager Cruise appointed in May 2019 to address market challengesMOTORHOMES CAR HIRE CRUISE
Cars
performed • Strong 1H19 bookings growth • Yield improved on flat • Cruise continued to
but 2H19 bookings fell bookings growth in line with underperform in FY19
well but significantly following focus on profitable bookings • Constrained capacity in the
Christchurch incident and improved channel source
Motorhomes • Strong bookings demand pick management
Australian home port cruise
market continued to have a
and Cruise up since July 2019 • Insurance attachment rate
continued to drive improved
material impact on bookings
with total Australian capacity
• Additional foreign language
under- sites released in FY19, margins falling further from the already
helping drive outperformance • Developing profitable new reduced levels in FY18
performed from those markets outbound travel markets in • New General Manager
• Expanded global offering with North America, Europe, appointed in May 2019 to
the addition of a further 10 South Africa and China, as drive improved performance
countries and 50 additional well as extending the range
locations of services in response to
• New specialist multi-lingual customer demand for a
call centre was established in broader offering
Romania, providing additional
capacity
• Peer2peer inventory
Page 22
integrated during 2H19Corporate Page 23
EBITDA (A$M)                          FY19                   FY18           Change
                                                  B2B                                67.3 million           27.2 million           148%
  Corporate                                       B2C (1)                            73.3 million           72.0 million           2%

  Division                                        Corporate                         (15.9 million)         (11.7 million)          36%
                                                  Total EBITDA                      124.6 million           87.4 million           43%

                                              •    FY19 Corporate costs for Continuing Operations include:
                                                     • FX losses of $2.2 million ($1.8 million in 1H19; $0.4 million in 2H19)
                                                     • Revised hedging program starting to mitigate FX volatility in 2H19
                                                     • WebBeds hedging program being rolled out to DOTW booking platform. Legacy
                                                        DOTW FX risk to unwind in 1H20
                                                     • FY19 corporate costs include 2H19 grant of retention options to executive team
                                                        ($0.5 million)
(1)   B2C is Webjet OTA and Online Republic          • Growth of corporate costs reflects investment across the group function to
      combined
                                                        support significantly increased global scale, stronger governance and risk
                                                        management as well as overheads associated with running a c.$4 billion TTV
                                                        business

  Page 24
FY19 Financial
Highlights
Page 25FY19 Financial Highlights
(1)
FY19 vs FY18 Statutory Result Continuing Operations
Increased (includes one-offs) (excludes one-offs)
EPS (before AA) TTV $3,831m 27% $3,831m 27%
Up 31% Revenue (2) $366.4m 26% $366.4m 26%
EBITDA $123.1m 43% $124.6m 43%
EBITDA Margin 33.6% 395bps 34.0% 398bps
NPAT (before AA) (3) $79.3m 47% $81.3m 46%
NPAT $60.3m 45% $62.3m 44%
(1) Continuing Operations - FY19 excludes
acquisition and integration costs ($15.2M), EPS (before AA) 61.8 cents 32% 63.3 cents 31%
reduction in earnout liability ($18.5M) and
debt establishment costs of $0.5M
associated with DOTW acquisition, and
EPS 47.0 cents 30% 48.6 cents 30%
software write-off of $4.9M. FY18 excludes
acquisition costs of $1.1M and debt
establishment costs of $0.6M associated
with JacTravel acquisition.
(2) Revenue - is shown net of costs of sale as AASB 15 – Revenue from Contracts with Customers
principal (i.e. on agency basis)
(3) Acquisition Amortisation - includes • The new standard has been adopted from 1 July 2018
charges relating to amortisation of
intangibles acquired through acquisition
• There is no financial impact as a result of adopting the new standard
Page 26Cash & Equivalents Stable
Jun-19 Jun-18 Change
Summary Balance Sheet • $211.4 million as at 30 June 2019
$m $m $m
includes $29.2 million of client
funds
Cash & equivalents 211.4 190.8 20.6
Strong Trade & receivables
Other current assets
341.2
26.9
261.0
18.2
80.2
8.7
• $190.8 million as at 30 June 2018
includes $25.9 million of client
funds
Balance Non-current assets 942.2 613.6 328.6 Working Capital Improving
• Increased receivables and
Sheet Total Assets
Trade & payables
1,521.7
550.5
1,083.6
450.7
438.1
99.8
payables due to DOTW
acquisition in 1H19
Conservative Other current liabilities
Borrowings
47.4
205.9
20.2
122.7
27.2
83.2
• The delayed FY18 Trade
Payables of $53 million (due to
go-live issues with new ERP
gearing Other non-current liabilities 73.7 47.1 26.5
system) paid during 1H19
Borrowings Conservative
Total Liabilities 877.5 640.8 236.7
• Increased $83.2 million to $205.9
Total Equity 644.2 442.8 201.4 million, including $100 million
debt funding for DOTW
Net debt (1) $23.7M ($42.2M) +156% acquisition.
Net debt to EBITDA ratio (2)
0.19 times (0.48 times) +0.67 times Strong Returns
(1) Excludes client funds
• ROE and ROIC comfortably
(2) For Continuing Operations - refer to page 35 for ROE (2)(3) 15.0% 16.9% -194bps above WACC. FY19 results do
full description
not account for full year
(3) Return on equity (ROE)
( )
ROIC (2)(4) 17.5% 23.9% -642bps
!"#
./ ( , 1 22 3)
contribution of DOTW and
(4) Return on invested capital (ROIC)
( "4 "5 !"#) synergies. FY20 will improve
across both measures
Page 27FY19 FY18 FY19 FY18
Cash Flow Summary Operating Cash Conversion
$m $m $m $m
Cash Flow EBITDA
Change in working capital
Income tax paid
123.1
(52.6)
(12.3)
86.3
46.2
(6.6)
Cash flow from Operating Activities
Add back: tax and interest
Add back: Delay in Supplier Payments from FY18
45.7
24.8
53.0
120.8
11.6
(53.0)
Cash Interest
Cash flow from Operating Activities
(12.5)
45.7
(5.1)
120.8
Total Operating cash
Add back: Client Funds movement (1)
123.5
(3.3)
79.5
4.7
Conversion Capital Expenditure
Acquisition / Disposals
Dividends received
(32.7)
(209.6)
0.2
(27.9)
(320.3)
0.2
Operating Cash Flow
Adjusted Cash Conversion
120.2
98%
84.1
98%
on target Cash flow from Investing Activities
New Equity
(242.2)
160.4
(348.0)
170.2
Net (repayment) of borrowings 82.7 72.1 Adjusted Cash Conversion 98%
Net (repayment) of loan receivable 7.6 14.8
Dividends paid (25.9) (21.3) • FY19 adjusted cash conversion in line with 95% to 110%
Cash flow from Financing Activities 224.7 235.7 target
FX movement on cash balances (7.6) 4.1 • Negative change in working capital due to go-live issues
Net increase / (decrease) in cash 20.6 12.6 with new financial ERP system in FY18 which resulted in
$53 million payments in 1H19 that should have been made
in 2H18
• Adjusting for the one-off $53 million Trade Payable carried
over from FY18, FY19 cash conversion is 98%
(1) Client Funds movement – As at 30 June 2019
Webjet had $29.2M in its Client Funds bank
account; This balance was $25.9M at 30 June
2018. The movement in the Client Funds
account is excluded from the calculation of
Operating Cash Flow (OCF) and the Cash
Conversion Rate.
Page 28CAPEX
Summary $27.9M
$32.7M
FY18 B2C B2B DOTW FY19
• FY19 CAPEX was $32.7 million, up 17% on pcp largely due to DOTW
• Assuming full year ownership of JacTravel in FY18 and excluding DOTW, underlying
CAPEX was down 4%
• FY19 B2C CAPEX spend down on pcp due to property upgrade in FY18
• FY20 CAPEX expected to increase 10-15% over FY19
Page 29$140M 100%
CAPEX $120M
$124.6M
Declining $100M
80%
spend $87.4M
60%
$80M
relative to
EBITDA $60M
$51.0M 40%
34.3%
$40M 31.9%
26.2% 20%
$20M
$0M 0%
FY17 FY18 FY19
EBITDA (Continuing Operations) CAPEX as % of EBITDA
Trend expected to continue in FY20
Page 30Final Dividend (fully franked)
13.5
CENTS
13.50c
PAID 10.00c
12.00c
Full year 8.00c
dividend up
10% 6.50c 7.50c 8.00c 8.50c
FY16 FY17 FY18 FY19
Interim Final
Future dividend increases to be lower than EPS growth in order to retain cash for
future growth opportunities
Page 31A strong start to FY20 – 6 weeks trading to 12 August 2019
• WebBeds – TTV up more than 50% over reported pcp (excluding Thomas Cook)
FY20 • Webjet OTA – TTV up 9%
• Online Republic – TTV up 4%
Outlook • Strong pipeline of acquisition opportunities
WebBeds
• We continue to see significant opportunities for profitable growth in all markets and target
opportunities to deliver 8/4/4 by FY22
FY20 guidance
range will be Webjet OTA
provided at our • We continue to see above market growth opportunities across both domestic and international
AGM on flights, as well as ancillary products
20 November 2019
Online Republic
• Consistent with our FY19 strategy, we will continue to focus on higher TTV margins and lower
acquisition costs
Page 32Thank You
B2C TRAVEL B2B HOTELS
Page 33Appendix
B2C TRAVEL B2B HOTELS
Page 34Description of Result
Categories
Statutory Result Continuing Operations
• FY19 includes 7 months of DOTW, acquisition and • FY19 excludes acquisition and integration costs ($15.2M),
integration costs ($15.2M), reduction in earnout liability reduction in earnout liability ($18.5M) and debt
($18.5M) and debt establishment costs of $0.5M establishment costs of $0.5M associated with DOTW
associated with DOTW acquisition, and software write-off acquisition, and software write-off of $4.9M
of $4.9M
• FY18 excludes acquisition costs of $1.1M and debt
• FY18 includes 10 months of JacTravel, acquisition costs of establishment costs of $0.6M associated with JacTravel
$1.1M and debt establishment costs of $0.6M associated acquisition
with JacTravel acquisition
Page 35Financial Results
Statutory Result Continuing Operations (1)
FY19 FY18 Change FY19 FY18 Change
$m $m $m % $m $m $m %
TTV 3,831 3,012 819 27% 3,831 3,012 819 27%
Revenue 366.4 291.0 75.4 26% 366.4 291.0 75.4 26%
(2)
Revenue as Principal - 470.6 (470.6) (100%) - 470.6 (470.6) (100%)
(3)
Total Revenue 366.4 761.6 (395.2) (52%) 366.4 761.6 (395.2) (52%)
EBITDA 123.1 86.3 36.8 43% 124.6 87.4 37.2 43%
Depreciation (5.1) (3.1) (2.0) (65%) (5.1) (3.1) (2.0) (65%)
Amortisation (11.9) (6.4) (5.5) (86%) (11.9) (6.4) (5.5) (86%)
Acquisition Amortisation (AA) (4) (19.0) (12.5) (6.4) (51%) (19.0) (12.5) (6.4) (51%)
EBIT 87.1 64.3 22.8 36% 88.7 65.4 23.3 36%
Interest (Net) (12.4) (5.7) (6.8) (119%) (12.0) (5.1) (6.8) (133%)
(1) Continuing Operations - FY19 excludes acquisition and PBT 74.7 58.6 16.1 27% 76.7 60.3 16.4 27%
integration costs ($15.2M), reduction in earnout liability
($18.5M) and debt establishment costs of $0.5M Tax (14.4) (17.1) 2.7 16% (14.4) (17.1) 2.7 16%
associated with DOTW acquisition, and software write-off
of $4.9M. FY18 excludes acquisition costs of $1.1M and NPAT (before AA) 79.3 54.0 25.3 47% 81.3 55.7 25.6 46%
debt establishment costs of $0.6M associated with
NPAT 60.3 41.5 18.8 45% 62.3 43.2 19.2 44%
JacTravel acquisition.
(2) Revenue as Principal - JacTravel contracts were aligned
to WebBeds where Revenue is reported as Agent from 1 EPS (cents)
July 18. - Basic (before AA) 61.8 46.9 14.9 32% 63.3 48.4 15.0 31%
(3) Total Revenue - includes Other income, but excludes - Basic 47.0 36.0 11.0 30% 48.6 37.5 11.1 30%
Interest income (reported on a net basis below) - Diluted 46.8 35.6 11.1 31% 48.3 37.1 11.3 30%
(4) Acquisition Amortisation - includes charges relating to
amortisation of intangibles acquired through acquisition Margins
Revenue Margin 9.6% 9.7% -10bps 9.6% 9.7% -10bps
EBITDA Margin 33.6% 29.6% +395bps 34.0% 30.0% +398bps
Effective Tax Rate (excl AA) 15.3% 24.0% -871bps 15.0% 23.5% -847bps
Effective Tax Rate 19.2% 29.2% -995bps 18.7% 28.4% -964bps
Page 36Group TTV (continuing operations) 27% pcp
FY19 FY18 Change
Continuing Operations (1)
$m $m $m % B2C TTV 1%
• Webjet TTV 2%
TTV
Webjet 1,378 1,345 33 2% • Online Republic 4%
Online Republic 299 313 (13) (4%)
AMEA 623 385 239 62%
B2B TTV 59%
Europe (incl TC) 1,122 775 347 45%
Asia 409 195 214 110% • AMEA 62%
Segment Total TTV
Bookings
3,831 3,012 819 27%
•
•
Europe (incl TC) 45%
Asia Pacific 110%
Summary B2C
B2B
2,061
3,444
2,050
2,277
12
1,167
1%
51%
Group EBITDA (continuing operations) 43% pcp
Continuing Segment TTV
B2C
B2B
1,677
2,154
1,657
1,354
20
799
1%
59%
B2C EBITDA 2%
• Webjet EBITDA 4%
Operations Revenue
B2C 181.9 177.1 4.8 3%
• Online Republic 6%
B2B 184.5 114.0 70.6 62% B2B EBITDA 148%
Operating Costs
• Includes contribution from DOTW
B2C (108.6) (105.1) (3.5) (3%) • AMEA 123%
B2B (117.3) (86.8) (30.5) (35%)
Corporate (15.9) (11.7) (4.2) (36%) • Europe (incl TC) 102%
• Asia Pacific 380%
EBITDA
B2C 73.3 72.0 1.3 2% • No recognition of Thomas Cook management fee
B2B 67.3 27.2 40.1 148%
Corporate (15.9) (11.7) (4.2) (36%)
(1) Continuing Operations - FY19 Corporate EBITDA 36%
excludes acquisition and integration
costs ($15.2M), reduction in earnout Revenue Margin % • Includes $2.2M FX losses and increased investment in
liability ($18.5M) and debt
establishment costs of $0.5M
B2C 10.8% 10.7% +16bps overheads
associated with DOTW acquisition, and B2B 8.6% 8.4% +15bps
software write-off of $4.9M. FY18
excludes acquisition costs of $1.1M Effective tax rate (continuing operations) 18.7%
EBITDA Margin %
and debt establishment costs of $0.6M
associated with JacTravel acquisition. B2C 40.3% 40.6% -34bps • Excluding non-deductible amortisation of acquisition
B2B 36.4% 23.8% +1,261bps intangible assets ("AA"), the effective tax rate was
Page 37
15.0%You can also read