WP PFC SP5: Post mortem analyses and material migration - Antti Hakola VTT
←
→
Page content transcription
If your browser does not render page correctly, please read the page content below
WP PFC SP5: Post mortem analyses and
 material migration

Antti Hakola
VTT
Introduction
•    In 2020, besides the ongoing activity areas, finally WEST-related work started
       ü    SP5.1: Material migration in tokamaks
       ü    SP5.4: Development of mixed-material reference coatings
       ü    SP5.7: Dust production mechanisms in tokamaks
       ü    SP5.8: Post-exposure analyses of WEST plasma-facing units from deuterium and helium
            plasma operations
•    Due to COVID-19, some tasks delayed or partly shifted into 2021
       ü Especially, most of the SP5.8 activities only in 2021
    Activity     Orig. PM in 2020   Analysis & HW (k€)            RUs involved
    SP5.1               51.5                  45.5                FZJ, IPPLM, JSI, MPG, RBI, VR, VTT
    SP5.4               34.0                  11.0                CEA, DIFFER, ENEA, FZJ, IAP, IPPLM,
                                                                  IST, JSI, RBI, VTT
    SP5.7               24.0                   3.0                ENEA, IAP, IPPLM, JSI, MPG, VR
    SP5.8               25.0                   9.0                CEA, FZJ, IAP, IPPLM, IST, MPG, RBI,
                                                                  VR, VTT
•    Usage of facilities:
       ü PSI-2: 4 days (sample exposure for WEST and test coatings)
       ü MAGNUM: 1 days + 2 days from 2019 (exposing test coatings)

                                            Antti Hakola | WP PFC & JET2 Annual Meeting | VC | 9 Nov 2020 | Page 2
SP5 focus points in 2019/20

I: Understanding material migration pathways on AUG, W7-X, and WEST
(SP5.1, SP5.8)
II: Clarifying the role of surface roughness and modifications on gross and net
erosion of PFCs (SP5.1, SP5.4)

III: Developing Be-based coatings to simulate co-deposits observed on JET-
ILW tiles and expected on ITER (SP5.4)

IV: Identifying dust sources on AUG and measuring and modelling the
contribution of arcing to erosion and dust production (SP5.7)

V: Studying plasma-wall interaction processes in samples exposed to He
plasmas (SP5.1, SP5.8)

                                  Antti Hakola | WP PFC & JET2 Annual Meeting | VC | 9 Nov 2020 | Page 3
SP5.1: what was promised?

•   Surface analyses of AUG samples and wall tiles originating from plasma
    operations in 2019 and 2020
•   Surface analyses of marker samples exposed on AUG in 2019 and 2020
•   Erosion and deposition studies on W-coated samples with different
    roughness on AUG
•   Post exposure analyses of W7-X marker tiles and other wall components
    including long-term samples after the OP1.2b campaign
•   Analysis of plasma-exposed W7-X samples and tiles for their surface
    modifications and deposition of impurities and tracer elements
•   Providing data of gross and net erosion patterns on AUG samples for
    modelling efforts under SP4.1 and SP4.2
•   Surface analyses of W-isotope enriched coatings after exposure to
    tokamak plasmas

                                     Antti Hakola | WP PFC & JET2 Annual Meeting | VC | 9 Nov 2020 | Page 4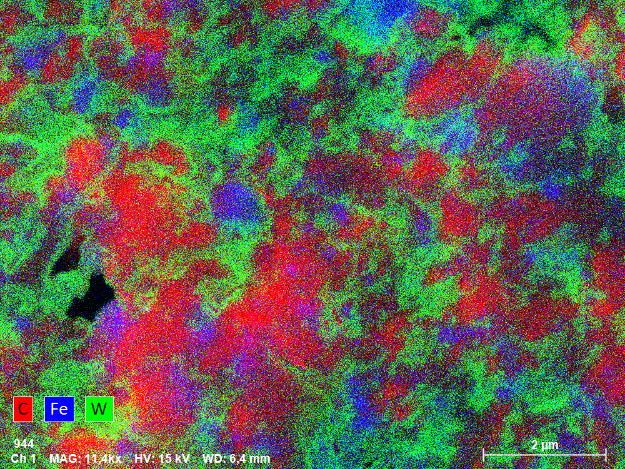
SP5.4: what was promised?

•   Production and characterization of ITER and JET-ILW relevant Be-based
    coatings at different temperatures simulating plasma and baking cycles
•   Production of ITER and DEMO relevant W-based coatings with different
    gas and impurity contents
•   Preparation of reference coatings with different roughnesses for
    experiments under SP2 and SP5.1
•   Production of samples for LIBS studies
•   Loading selected samples with fuel (D, He) by plasma exposure in linear
    devices (MAGNUM, PSI-2)
•   Surface analyses of the produced reference samples
•   Development of Re/Ta reference coatings and isotope-enriched W
    samples

                                     Antti Hakola | WP PFC & JET2 Annual Meeting | VC | 9 Nov 2020 | Page 5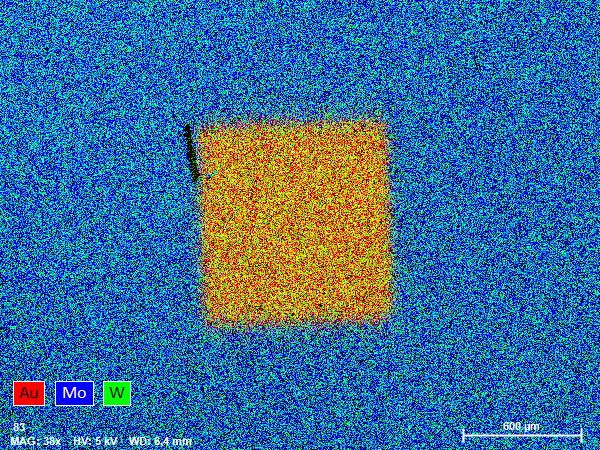
SP5.7: what was promised?

•   Determining arcing patterns on various AUG wall tiles
•   Studying the dust production on AUG with the help of long-term samples
•   Comparing the results obtained from AUG and other tokamaks (including
    FTU) for co-deposits with the lab samples produced by a dust-gun device
•   Validate droplet ejection simulation results against experimental data of
    arcing obtained from AUG and JET
•   Carry out laboratory experiments of W and Be dust generation during
    simulated air and water leaks

                                      Antti Hakola | WP PFC & JET2 Annual Meeting | VC | 9 Nov 2020 | Page 6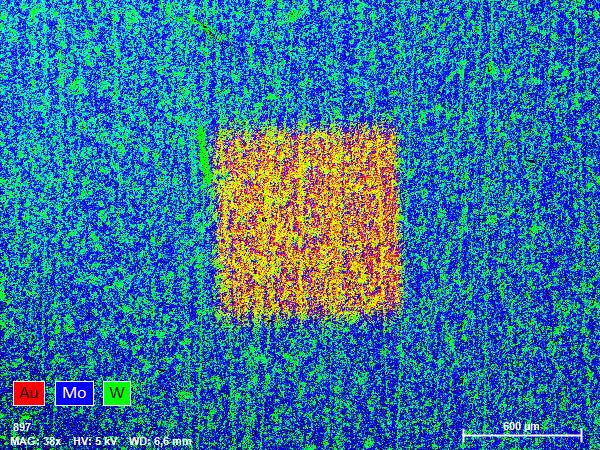
SP5.8: what was promised?

•   Erosion, deposition, and fuel-retention studies of WEST PFUs after the C3
    and C4 campaigns
•   Characterizing ageing of PFUs including changes in their surface
    roughness and morphology, and crack formation
•   Determining and analysing heat-load patterns on PFUs
•   Investigating He retention, PFU erosion, formation of co-deposited layers
    on W surfaces, and the formation and destruction of W fuzz resulting
    from exposure of PFUs to He plasmas on WEST
•   Developing in situ LIBS as a fuel-retention diagnostics on WEST

                                     Antti Hakola | WP PFC & JET2 Annual Meeting | VC | 9 Nov 2020 | Page 7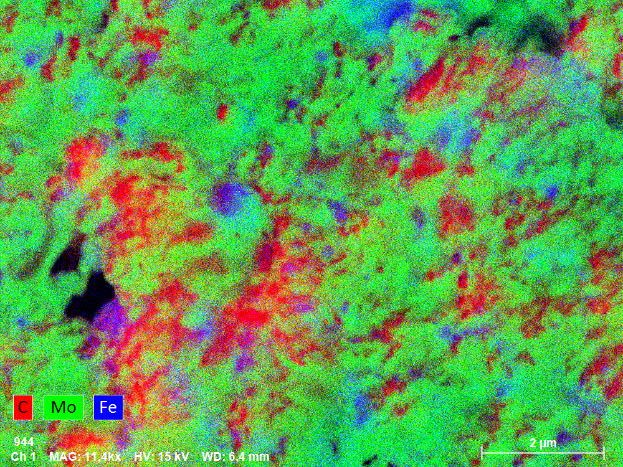
SP5.1: Material migration in tokamaks –
main achievements
- with contributions also from SP5.4

                  Antti Hakola | WP PFC & JET2 Annual Meeting | VC | 9 Nov 2020 | Page 8
AUG: exposing marker samples to
    L- and H-mode plasmas (VTT, MPG, RBI)
•   Main goals:                                                                                  After experiment
                                                                                       SOL
     ü Investigate gross and net erosion of W in different
       plasma conditions on ASDEX Upgrade (AUG) using Mo-
       coated (~200 nm) graphite samples with 1×1 mm2 or
       5×5 mm2 Au marker spots (thickness ~20 nm)                                       L3      Ra ~ 110 nm     R1       Ra ~ 2 mm

     ü Provide benchmarking data for ERO modelling                                      L2      Ra ~ 110 nm     R3      Ra ~ 2 mm
•   Experiment #1: AUG L-mode experiment from 2019                                                                          OSP
                                                                                        L1                       R2
     ü Bt = 2.5 T, Ip = 0.8 MA, ne,core ~ 4×10¹⁹ m-3                                            Ra ~ 290 nm              Ra ~ 5 nm

     ü PECRH = 0.8 MW, Te,peak ~20-25 eV, texposure ~ 44 s
                                                                                      PFR
•   Achievements in 2020:
     ü ERO and OSM simulations revisited (for PSI 2020, see
       SP4.2 talk)
     ü Broad-beam RBS results for Au and Mo erosion
       consolidated, erosion profiles to be compared with
       microbeam data from samples L1, L2, R2, and R3
       (estimated early 2021)

A. Hakola, J. Likonen, A. Lahtinen, K. Krieger, M. Balden, M. Brajković,
M. Barac, S. Gouasmia, Z. Siketić, I. Bogdanović Radović

                                                        Antti Hakola | WP PFC & JET2 Annual Meeting | VC | 9 Nov 2020 | Page 9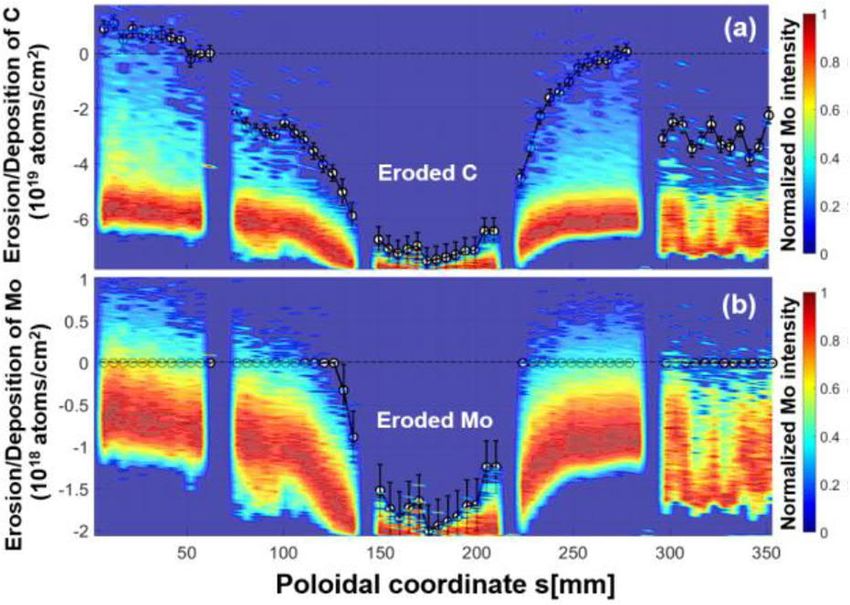
AUG: exposing marker samples to
    L- and H-mode plasmas (VTT, MPG, RBI)
                                                                                             After experiment
•   Main goals:                                                                                     OSP
     ü Investigate gross and net erosion of W in different                          PFR                                     SOL
       plasma conditions on ASDEX Upgrade (AUG) using Mo-
       coated (~200 nm) graphite samples with 1×1 mm2 or
       5×5 mm2 Au marker spots (thickness ~20 nm)
     ü Provide benchmarking data for ERO modelling
•   Experiment #2: AUG H-mode experiment from 2019 –
    “large ELMs”
     ü Bt = 2.4 T, Ip = 1.0 MA, ne,core ~ 9×10¹⁹ m-3
     ü PECRH = 3.4 MW, Te,peak ~20-25 eV, texposure ~ 12 s
•   Achievements in 2020:
     ü Broad-beam RBS measurements made and results
       available
     ü Comparison between L- and H-mode results made (for
       IAEA FEC 2020)

A. Hakola, J. Likonen, A. Lahtinen, K. Krieger, M. Balden, M. Brajković,
M. Barac, S. Gouasmia, Z. Siketić, I. Bogdanović Radović

                                                       Antti Hakola | WP PFC & JET2 Annual Meeting | VC | 9 Nov 2020 | Page 10
AUG: exposing marker samples to
L- and H-mode plasmas (VTT, MPG, RBI)
• Main goals: After experiment
ü Investigate gross and net erosion of W in different
plasma conditions on ASDEX Upgrade (AUG) using Mo-
coated (~200 nm) graphite samples with 1×1 mm2 or
5×5 mm2 Au marker spots (thickness ~20 nm)
ü Provide benchmarking data for ERO modelling
• Experiment #3: AUG H-mode experiment from 2020
with 2 different OSP positions – “small ELMs”
ü Bt = 2.5 T, Ip = 0.6 MA, ne,core ~ 8×10¹⁹ m-3
ü PNBI=5.0 MW, PECRH = 4.0 MW, Te,peak ~30 eV
ü Left tile: marker samples above OSP 2 and roughness OSP2
samples between OSP1 and OSP2
ü Right tile: Re- and Mo-coatings and roughness samples
between OSP 1 and OSP 2
• Achievements in 2020:
ü Experiment done in 07/2020 OSP1
ü Post-exposure analyses pending
A. Hakola, J. Likonen, A. Lahtinen, K. Krieger, M. Balden, M. Brajković,
M. Barac, S. Gouasmia, Z. Siketić, I. Bogdanović Radović
Antti Hakola | WP PFC & JET2 Annual Meeting | VC | 9 Nov 2020 | Page 11AUG: Microscale analyses of exposed
marker samples (VTT, MPG, RBI)
A. Hakola, J. Likonen, A. Lahtinen, K. Krieger, M. Balden, M. Brajković,
M. Barac, S. Gouasmia, Z. Siketić, I. Bogdanović Radović
• Focus on samples from the AUG 2019 L-mode experiment
• SEM/EDX indicates the Au deposition outside markers being below sensitivity threshold
(masked by Mo) – left and middle
ü To be verified by microbeam measurements at JSI
• First micro-PIXE and RBS measurements carried out for the L1 and L2 samples - right
ü Peaked erosion profile: L1 thickness ~10 nm, L2 thickness ~22 nm
ü Analyses complicated by overlapping W and Au peaks in PIXE
ü Au can be seen outside the marker spots (but results still to be confirmed)
ü Tiny spots rich in Fe, Cr, and Ni also observed (blue)
before AUG exposed
Au marker
Antti Hakola | WP PFC & JET2 Annual Meeting | VC | 9 Nov 2020 | Page 12AUG: Production of samples with varying
surface roughness (JSI, VTT, MPG, ENEA)
E. Vassallo, D. Dellasega, M. Passoni
• Main goal:
ü Produce Mo-coated graphite samples with
varying surface roughness for lab studies
and AUG experiments Impressive figure #1
• In 2020, focus on additional batches for a
new experiment on AUG (July 2020)
ü Substrates exposed to fluorine-based
plasma etching à average roughness
values Ra = 110 and 290 nm
ü Mo layer produced on treated substrates
Ra ~290 nm
using Pulsed Laser Deposition
ü In addition, films produced on glass-blasted
graphite (R > 1 μm)
• Produced films mimic the underlying
substrate morphology
Fig. 2. Plasma treated graphite (etching for 90 min)
Antti Hakola | WP PFC & JET2 Annual Meeting | VC | 9 Nov 2020 | Page 13AUG: Exposure of roughness samples to
L- and H-mode plasmas (JSI, VTT, MPG)
M. Kelemen, S. Markelj, M. Balden
• Key focus points in 2020
ü Finish analysis of data from laboratory samples
à article sent for publication
ü Complete measurements of samples originating
from 2019 experiment on AUG à article in
preparation
ü Expose new sets of samples to AUG plasmas in
2020 à in connection with the marker samples
• AUG 2019 samples exhibit well-known
deposition pattern (below): Erosion at
elevations and deposition in depressions
• Mo W
2019 L-mode experiment: Ra~110 nm
Antti Hakola | WP PFC & JET2 Annual Meeting | VC | 9 Nov 2020 | Page 14AUG: exposure of nanostructured W to
He plasmas (FZJ, MPG, VTT, RBI)
• Samples resulting from a 2-phase plasma
X12 G1
experiment on AUG
Poloidal
ü OSP 1: H-mode part for eroding fuzz
ü OSP 2: L-mode part for growing fuzz X11 G6
• Sample types:
ü G1-6: Bulk W samples, pre-exposed in GLADIS (see J3
right) G5
ü J1: W fuzz (from PSI-2); J2: W rough; J3: W polished
ü X10-12: Mo-coated graphite markers J1 G4
OSP 1
• Main focus points in 2020
X10 G3
ü Determine deposition of impurities and He (X10-
X12) on the samples
ü Complete microscopy analyses of G1-G6 and J1-J3 J2 G2
OSP 2
S. Brezinsek, A. Hakola, M. Balden, K. Krieger, M. Rasinski, M. Brajković,
M. Barac, S. Gouasmia, Z. Siketić, I. Bogdanović Radović
Antti Hakola | WP PFC & JET2 Annual Meeting | VC | 9 Nov 2020 | Page 15AUG: exposure of nanostructured W to
He plasmas (FZJ, MPG, VTT, RBI)
• Observed elements D, He, B, C, N, O, Cr, Fe, Mo, and W X10
• Main results:
ü B shows strong deposition peaks below or around OSP 1,
smaller peaks for D and C as well
ü He concentration up to 25 at.% on sample X10 (between
OSP 1 and OSP 2), remainsAUG: exposure of nanostructured W to
He plasmas (FZJ, MPG, VTT, RBI)
• Microscopy analyses of the G samples Fuzz formed of cross-section made before
completed and results made available for AUG-He exposure
publications
• Main results:
ü Pre-formed fuzz survives and is covered by layer
(unclear if erosion of fuzz nano-tendrils occurs)
ü New fuzz is formed on cross-section plane
prepared before AUG exposure for fuzz thickness
determination
ü Fuzz is formed on surrounding DIM-tile 2.5 µm
Cross-section through survived fuzz layer with
additionally formed layer ® new fuzz
S. Brezinsek, A. Hakola, M. Balden, K. Krieger, M. Rasinski, M. Brajković,
M. Barac, S. Gouasmia, Z. Siketić, I. Bogdanović Radović
0.5 µm
Antti Hakola | WP PFC & JET2 Annual Meeting | VC | 9 Nov 2020 | Page 17AUG: exposure of nanostructured W to
He plasmas (FZJ, MPG, VTT, RBI)
• Also microscopy analyses of the J samples
largely completed
• Main results:
ü Fuzz with thickness up to 400 nm found,
consisting of tungsten with addition of Mo
and O; Mo found throughout the layer, O in
the top part
ü Distribution of fuzz not homogeneous along SEM image of the J3 sample surface together with TEM lamella
the surface. coming from marked region
ü Most of the samples covered with fuzz, but
some grains are nearly free of it
S. Brezinsek, A. Hakola, M. Balden, K. Krieger, M. Rasinski, M.
Brajković, M. Barac, S. Gouasmia, Z. Siketić, I. Bogdanović Radović
STEM image of the J3 sample surface together with EDX line scan
along red line. Enrichment in Mo and O is presented
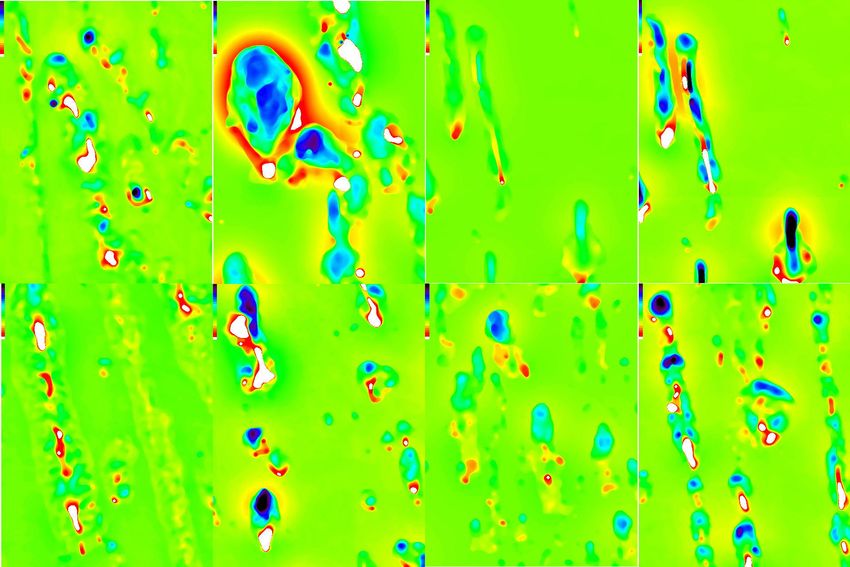
Antti Hakola | WP PFC & JET2 Annual Meeting | VC | 9 Nov 2020 | Page 18AUG: plasma loading in gaps of
castellated divertor (MPG, RBI)
• Goal: Study ELM-induced toroidal power loads to gaps
due to gyration of plasma species à experiment on AUG
in reversed Bt/Ip with Pt-coated gap samples in early 2020
• Main results:
ü Erosion of Pt coatings confirmed, erosion varies along gaps
ü Re-deposition of Pt and Mo together with deposition of W,
Ni, C, B and O from the plasma
ü Deep deposition into toroidal gaps top
bottom
upper
lower gaps, mid Pt-L Mo-K
2.0 1 mm gap, down
1 mm gap, top 0.5 mm gap 1 mm gap
0.5 mm gap, down
Pt-L 0.5 mm gap, top
lower
1.5
relative change
1.0 Positions of analyses Flush-mounted with tile surface
Mo-K before and after
0.5 exposure
3 / 15 mm
Depth into gap -10 10
0.0
30 keV r m l
0 1 2 3 4 5
20 30
nm/Pt
40layer
mm
depth into gap / mm
30 / 40 mm
K. Krieger, M. Balden, M. Barac,
I. Bogdanović Radović
Antti Hakola | WP PFC & JET2 Annual Meeting | VC | 9 Nov 2020 | Page 19W7-X: erosion/deposition patterns on
wall components (MPG, FZJ, IPPLM)
• Main goals in 2020: complete analysis of ion- Deposition on
beam data to determine erosion/deposition a TDU closure tile
profiles on various W7-X samples after OP1.2b
• Main results of the analyses:
Deposition (1018 atoms/cm2)
6
B
C
5
ü W-coated Inner Heat Shield tiles
N
O
Total
4
TD-Z512-8-M1
o W erosion small, tiles coated with B and C 3
ü Regular carbon tiles from Inner 2
Heat Shield and Baffles 1
0
o Sometimes deposits > 1 µm, mainly C and B -20 -10 0 10
Position (mm)
20 30
ü Various other parts (GDC electrode,
001
002
003
004
005
reflectometry mirrors, pumping gap closure
tiles,…) measured and evaluated
• Novel methods developed for data evaluation:
ü “Before” measurements analysed using
automated fits and artificial neural networks
ü “After” measurements analysed using artificial
neural networks
M. Mayer, S. Brezinsek, M. Rasinski, D. Zhao, E. Fortuna-Zalesna
Antti Hakola | WP PFC & JET2 Annual Meeting | VC | 9 Nov 2020 | Page 20W7-X: erosion/deposition patterns on
wall components (MPG, FZJ, IPPLM)
• Main goals in 2020:
ü Apply picosecond-LIBS for determining
erosion/deposition patterns on OP1.2a wall
components
ü Carry out microscopy analyses for OP1.2b wall
components
• Status of the work:
ü Clear erosion/deposition patterns observed for
C and Mo after the OP1.2a campaign
Erosion of C (a) and Mo (b) of the target element TM2v2 by
ü Analysis of the OP1.2b tiles ongoing – first ps-LIBS (OP1.2a campaign).
erosion data of C with Mo interlayer available
ü Set of OP1.2b samples delivered to Warsaw for
detailed microscopy studies à work started
SEM image of the A191 tile with
visible Mo marker interlayer and
erosion of deposited C
M. Mayer, S. Brezinsek, M. Rasinski, D. Zhao, E. Fortuna-Zalesna
Erosion/deposition of C during OP1.2a based on ps-LIBS.
Antti Hakola | WP PFC & JET2 Annual Meeting | VC | 9 Nov 2020 | Page 21W7-X: deposition patterns of 13C on wall
components (FZJ, MPG, VTT, VR)
S. Brezinsek, T. Dittmar, M. Mayer, A. Hakola, T. Vuoriheimo
• Main goal in 2020: determine deposition 5.0
1l
Lower TDUs 1u
Upper TDUs
profiles of tracer elements (including 13C) on
plasma-exposed W7-X samples 2.5
• 13CH4 puffed during the last discharges 0.0
2l
of OP1.2b through TDU 3l 5.0
2u
Results of ion-beam analyses: 2.5
Amount of 13C [1017 atoms/cm2]
• 13C deposition relatively uniform throughout
the analysed tiles but the pattern has a striped 0.0
50
3l 3u
nature (exception: vicinity of the injection hole) 40
30
20
10
0
5.0 4l 4u
2.5
13C deposition
TM1h
profiles on 0.0
TM2h TM2h6 5.0 5l 5u
of all TDUs
TM3h 2.5
TM4h
0.0
-400 -200 0 -400 -200 0
Position [mm]
Antti Hakola | WP PFC & JET2 Annual Meeting | VC | 9 Nov 2020 | Page 22W7-X: deposition patterns of 13C on wall
components (FZJ, MPG, VTT, VR)
S. Brezinsek, T. Dittmar, M. Mayer, A. Hakola, T. Vuoriheimo
• Main goal in 2020: determine deposition
profiles of tracer elements (including 13C) on
plasma-exposed W7-X samples
• 13CH4 puffed during the last discharges
of OP1.2b through TDU 3l
Results of SIMS analyses:
• 13C deposition results agree with ion-beam data.
NB! different wall tiles analysed
• Areas with 13C peaks show also complex
deposits with B, C, and metals (Cr, Fe, Ni, Mo)
Antti Hakola | WP PFC & JET2 Annual Meeting | VC | 9 Nov 2020 | Page 23SP5.8: Post-exposure analyses of WEST
plasma-facing units from deuterium and
helium plasma operations
Antti Hakola | WP PFC & JET2 Annual Meeting | VC | 9 Nov 2020 | Page 24WEST: status of post-exposure analyses
of plasma-facing units (CEA)
Analysis of test divertor sector exposed in C4
performed in CEA:
• Metrology: no large evolution of PFU misalignment
• Confocal microscopy: preliminary results indicate no
major propagation of top surface cracks between C3
and C4 (tbc)
• PFU emissivity: confirms strong spatial variations
consistent with complex erosion/re-deposition pattern
• X fluorescence analysis (for heavy impurities) and
Test divertor sector Q3B on the confocal test bed
optical microscopy ongoing
Analysis of erosion markers exposed in C3 and C4:
• Step #1: full-tile analysis at MPG (Garching) using broad-
beam RBS and NRA as well as SEM/EDX for two tiles
exposed in C3 (next slides)
• Step #2: tiles to be sent to VTT for sample cutting
(cutting scheme under discussion) and SIMS
• Step #3: samples to be sent to other EU labs involved
(IAP, RBI, VR, JSI, IPPLM, IST, UT…)
• Step #4: Repeat for tiles exposed in C4 (He campaign)
E. Tsitrone, E. Bernard et al.
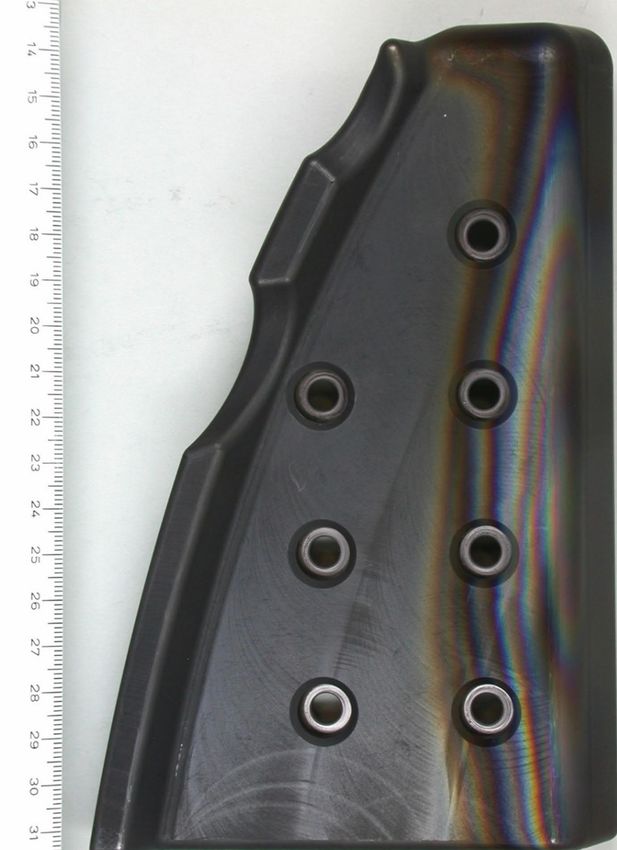
Antti Hakola | WP PFC & JET2 Annual Meeting | VC | 9 Nov 2020 | Page 25WEST: first results from two C3 plasma-
facing units (CEA, MPG)
Inner divertor graphite marker tile “no34”
Two marker tiles, removed from WEST after
the C3 campaign, became available for
analyses in 2020
• Analyzed using RBS, NRA, SEM and EDX Mo-layer
W-marker thickness
Thick deposits
10000 no34
(1015 Atoms/cm2)
(partly) at W-layer thickness
surface cannot be
determined
• Cutting of the tiles into smaller pieces for 5000
other analyses under discussion (by VTT) 0
• Tiles from the C4 campaign most likely no34 D
(1015 Atoms/cm2)
30000 B
Deposition
C
available in 2021 20000 O
Total
10000
Results of RBS and NRA analyses:
0
• no34
#005
D (Total)
(1015 Atoms/cm2)
600
ü Initial W layer thickness varies across tile D (Codeposited)
D Inventory
400
(unfortunately no pre-measurements) 200 #021
#026 #001
#010
#015 #019
ü Mo interlayer partly at the surface 0
300 250 200 150 100 50 0
(light grey), then areas with very rough Position (mm)
and thick deposits (dark grey)
ü D depth profile: surface peak (in deposit)
and tail (in W: 0.2-0.5%) extends also
beyond ~3 µm
M. Balden, M. Mayer
Antti Hakola | WP PFC & JET2 Annual Meeting | VC | 9 Nov 2020 | Page 26WEST: first results from two C3 plasma-
facing units (CEA, MPG)
Two marker tiles, removed from WEST after cross-sections tilted by -36°
the C3 campaign, became available for
analyses in 2020
• Analyzed using RBS, NRA, SEM and EDX
18 µm
• Cutting of the tiles into smaller pieces for
2.3 µm
other analyses under discussion (by VTT)
4 µm
0.6 µm
• Tiles from the C4 campaign most likely 0.25 µm 1.3 µm
available in 2021
x1.24
• Results of SEM, EDX and FIB analyses:
ü Cross-sections confirm Mo interlayer on
the surface à erosion several µm
ü Deposits: >10 µm with typical
“multilayer” structure; B-rich layer of
boronization present
2 µm
ü Traces of soft (no detectable erosion) and
strong arcing (trace depth >20 µm)
observed
M. Balden, M. Mayer
Antti Hakola | WP PFC & JET2 Annual Meeting | VC | 9 Nov 2020 | Page 27SP5.4: Development of mixed-material
reference coatings
Antti Hakola | WP PFC & JET2 Annual Meeting | VC | 9 Nov 2020 | Page 28Be films: production of reference
samples (IAP, VTT, RBI, IST, JSI, CEA)
• Focus points in 2020 – all samples at varying temperatures (from RT to 400°C)
ü Be-D samples with different thicknesses (up to 30 mm) and surface roughness (Ra=50-2000 nm)
ü Be-D-He and Be-D-Ne layers
C. Porosnicu, P. Dinca, B. Butoi, C. P. Lungu, O. G. Pompilian,
C. Staicu, V. Nemanic, M. Žumer
Antti Hakola | WP PFC & JET2 Annual Meeting | VC | 9 Nov 2020 | Page 29Be films: analyses of reference samples
(IAP, VTT, RBI, IST, JSI, CEA)
Example 1: TOF-ERDA results of D and Ne contents
• Analyses of mainly 2019 samples and partly a of different Be-Ne-D layers
subset of the 2020 samples
D Ne
ü Be-D samples with different thicknesses (up to Sample (at. %) (at. %)
30 mm) and surface roughness (Ra=50-2000 nm)
Be+D(5)+Ne(2.5), RT 11.1 1.1
ü Be-D-H, Be-D-He, Be-D-N, and Be-D-Ne as well Be+D(5)+Ne(2.5), T=100°C 10.0 0.59
as Be-O-C-D layers Be+D(5)+Ne(2.5), T=400°C < 0.01 < 0.01
• Main observations (as of 11/2020)
Be+D(5)+Ne(5), RT 11.9 2.0
ü D content generally decreases with deposition Be+D(5)+Ne(5), T=100°C 5.2 < 0.10
temperature Be+D(5)+Ne(5), T=400°C 12.7 2.7
ü Higher levels of impurities (N) increases Example 2: EBS and NRA results of D and N contents
retention (but more analyses needed) of different Be-D-N layers
D N
Sample (at. %) (at. %)
Be+D(5)+N(2.5), RT 0.98 ~0.5
Be+D(5)+N(2.5), T=100°C 0.19 ~0.5
Be+D(5)+N(2.5), T=400°C 0.09 ~1.0
Be+D(5)+N(5), RT 2.1 ~1.0
M. Brajković, Z. Siketić, I. Bogdanović Radović, R. Mateus, E. Alves Be+D(5)+N(5), T=100°C 2.1 ~1.0
Be+D(5)+N(5), T=400°C 0.18 ~2.0
Antti Hakola | WP PFC & JET2 Annual Meeting | VC | 9 Nov 2020 | Page 30Be films: analyses of reference samples
(IAP, VTT, RBI, IST, JSI, CEA)
• Analyses of mainly 2019 samples and partly a
subset of the 2020 samples
ü Be-D samples with different thicknesses (up to D~2.1 at.%, C~5.9 at.%, O~7 at.%
30 mm) and surface roughness (Ra=50-2000 nm) (EBS + NRA)
ü Be-D-H, Be-D-He, Be-D-N, and Be-D-Ne as well
as Be-O-C-D layers
• Main observations (as of 11/2020)
ü D content generally decreases with deposition
temperature
ü Higher levels of impurities (N) increases
retention (but more analyses needed)
ü Deposition using “JET-like” heat pulses indicates
increased retention compared to constant D~0.91 at.%, C~3.2 at.%, O~10 at.%
temperature (especially at the surface) (EBS + NRA)
A. Hakola, J. Likonen
Antti Hakola | WP PFC & JET2 Annual Meeting | VC | 9 Nov 2020 | Page 31Be films: analyses of reference samples
(IAP, VTT, RBI, IST, JSI, CEA)
• Analyses of mainly 2019 samples and partly a
subset of the 2020 samples
ü Be-D samples with different thicknesses (up to
30 mm) and surface roughness (Ra=50-2000 nm)
ü Be-D-H, Be-D-He, Be-D-N, and Be-D-Ne as well
as Be-O-C-D layers
Confocal
• Main observations (as of 11/2020) Raman
ü D content generally decreases with deposition
temperature
ü Higher levels of impurities (N) increases
retention (but more analyses needed)
ü Deposition using “JET-like” heat pulses indicates RT
increased retention compared to constant
temperature (especially at the surface)
ü Samples produced at the highest temperatures
show rough surfaces with lots of defects
ü No systematic dependence on retention as a
function of roughness observed (so far)
C. Pardanaud, M. Kumar, G. Giacometti, C. Martin, P. Roubin
400°C
Antti Hakola | WP PFC & JET2 Annual Meeting | VC | 9 Nov 2020 | Page 32W films: production of samples for LIBS
and MAGNUM (IAP, DIFFER, VTT, IPPLM)
Concentration W, Mo, D (at.%)
20 20
GDOES profile for W-Ta-D (5 at.%) GDOES profile for W-Ta-D (10 at.%)
Concentration W, Mo, D (at.%)
100 100
Concentration Ta (at.%)
Concentration Ta (at.%)
80 15 80 15
W W
D D
60 Mo 60 Mo
Ta 10 Ta 10
40 40
5 5
20 20
0 0 0 0
0 1 2 3 4 5 6 7 8 0 1 2 3 4 5 6
Depth (mm) Depth (mm)
1000
-9
• Goals in 2020:
-7 8.0x10
6.0x10
800 ü W-Ta and W-Ta-D coatings for LIBS and
Partial pressure (torr)
D
D-H -9 MAGNUM and PSI-2 plasmas
Temperature ( C)
6.0x10
Ar 0
4.0x10
-7
T
600
ü W-N-D coatings for LIBS studies (pending)
Properties of the W-Ta-D layers
-9
4.0x10
400 •
2.0x10
-7
TDS profile for W-Ta-D (10 at.%) -9
ü Ta content ~3.8-5 at.%, D content 4.6-4.8
2.0x10 200
at.% or 9-15 at.% à all close to the
desired targets
0.0 0.0 0
0 10 20 30 40 50 60 70 ü Layers exhibit uniform depth profiles
Time (min.)
E. Grigore, M. Gherendi, F. Baiasu
Antti Hakola | WP PFC & JET2 Annual Meeting | VC | 9 Nov 2020 | Page 33W films: production of samples for LIBS
and MAGNUM (IAP, DIFFER, VTT, IPPLM)
• Sample exposure in MAGNUM in early 2020 à investigate fuel retention and coating
behaviour in D or D+N plasmas with varying plasma temperatures
ü W-Ta and W coatings from 2019 and 2020 (IAP)
ü W coatings with different morphologies (ENEA)
• Samples sent for analyses: SIMS (VTT), LIBS (UT), and microscopy (IPPLM)
• Microscopy analyses:
ü Lots of blisters on the samples and surface morphology changes towards the sample edge
ü Thick re-deposits especially at the center of the beam spot
Black ring
Examples of SEM images from a W-Ta sample resulting from exposure to D plasma
H. van der Meiden, E. Fortuna-Zalesna, W. Zielinski, S. Szpilewicz
Antti Hakola | WP PFC & JET2 Annual Meeting | VC | 9 Nov 2020 | Page 34W films: production of samples for LIBS
and MAGNUM (IAP, DIFFER, VTT, IPPLM)
• Sample exposure in MAGNUM in early 2020 à investigate fuel retention and coating
behaviour in D or D+N plasmas with varying plasma temperatures
ü W-Ta and W coatings from 2019 and 2020 (IAP)
ü W coatings with different morphologies (ENEA)
• Samples sent for analyses: SIMS (VTT), LIBS (UT), and microscopy (IPPLM)
• SIMS analyses:
ü Re-deposited layers at the center of the beam spot, consist mainly of Mo and Ta
ü D retained typically in the deposit, can also show an implantation-like profile
Examples of SIMS depth profiles from W-Ta sample resulting from exposure to D and D+N plasmas
H. van der Meiden, A. Hakola, J. Likonen
Antti Hakola | WP PFC & JET2 Annual Meeting | VC | 9 Nov 2020 | Page 35SP5.7: Dust production mechanisms in
tokamaks
Antti Hakola | WP PFC & JET2 Annual Meeting | VC | 9 Nov 2020 | Page 36AUG: characterization of arcing patterns
on different wall tiles (MPG, JSI)
• Arcing patterns completely characterized on the Arcing on inner AUG heat shield tile
removed WN and central-column tiles of AUG
• Example 1: Tracking evolution of strong arcing
patterns on the central column of AUG
ü Dot-like arc traces (not moving) à during glow
discharges (without magnetic field)
1 mm
ü Erratic running arcs: direction diverging from
typical one during flat top phase à due to start-
up phases or disruptions?
ü New traces since 2018: old traces partially buried
under thick deposits
• Example 2: Arcing patterns on a polished W-
divertor tile, half-coated with WN
ü “Obvious arcing” visible by eye but activity not 22 µm
confirmed by microscopy
ü Thick deposits formed, even in nominally erosion-
dominated region and surface became rougher
ü WN layer partially delaminated possibly by arcing 250 µm
0
M. Balden
Antti Hakola | WP PFC & JET2 Annual Meeting | VC | 9 Nov 2020 | Page 37AUG: characterization of arcing patterns
on different wall tiles (MPG, JSI)
• Arcing patterns completely characterized on the
S10-6A
removed WN and central-column tiles of AUG W TZM
• Example 3: Polished inserts on inner baffle to A37 A38
study the effect of material properties on arcing
ü Magnetic steel (e.g. Eurofer, P92) exhibits much
higher erosion by arcing than non-magnetic
stainless steel
poloidal
ü Depth of arc traces depends mostly on
the melting temperature of the material
toroidal
• Example 4: Arcing patterns on bare and WN- A: A16 B: A17 C: A19 D: A20
W Cr Al Cu
coated W tiles after one year plasma exposure
ü On bare W tile, arcing causes W melting and 2mm 2mm 8mm 2mm
formation of ridges in the center of arc traces
ü On WN-coated areas, arcing mainly causes
-4 mm -4 mm -16 mm -4 mm
delamination of the coating E: A22 F: A23 G: A24 H: A24
TZM P92 SS SS
2mm 8mm 8mm 2mm
-16 mm -16 mm
M. Balden, M. Panjan, M. Čekada -4 mm -4 mm
Antti Hakola | WP PFC & JET2 Annual Meeting | VC | 9 Nov 2020 | Page 38W and Be dust generation in the presence
of air and water leaks (IAP)
• Main results on the W front: Dry Ar Ar + H2O 0.5%
ü Functional systems for W dust preparation
available - Magnetron Sputtering Gas
Aggregation (50-200 nm) and Microarc
Discharge (0.1-10 mm)
ü W dust production rates and particle
morphology influenced by gaseous impurities
and usage of different gases (Ar vs. He) and
humidity levels
• Main results on the Be front:
ü Agate ball mill applied to create various types of
dust from Be pebbles
o Air: dust size mainly >160 µm
o Water: dust size more evenly distributed in 36-
160 µm and >160 µm particles
ü O content increases in water (from 9 to 12 at%)
ü Be, Cr, Cu, Fe, Mo, Ni and W found in the
particles
o Less Be, Cu and Fe in water
ü Formation of insoluble oxides on the particles?
G. Dinescu, C. Lungu
Antti Hakola | WP PFC & JET2 Annual Meeting | VC | 9 Nov 2020 | Page 39Modelling dynamics of liquid metal pools
and droplet ejection (VR)
Numerical benchmark Effect of near-cathode processes
• Hydrodynamic ANSYS model with • Extra heat and pressure from ionized
prescribed plasma pressure and heat vapor and thermo-field emission
flux profiles established for Cu cathode • Thermo-field emission dominates vapor
ü Successful benchmark to experiments cooling and is essential to recover the
ü Prediction of droplet detachment proper cathode temperature response
consistent with experiments despite
missing near-cathode physics
Newly established collaboration with the
fluid dynamics group at KTH for alternative
L. Vignitchouk, S. Ratynskaia, L. Brandt, M. Crialesi Esposito
numerical implementation of the full model
Antti Hakola | WP PFC & JET2 Annual Meeting | VC | 9 Nov 2020 | Page 40Summary
q SP5.1:
v AUG: dedicated experiments carried out (under MST1) and post exposure analyses ongoing
v W7-X: erosion/deposition patterns on wall tiles clarified and determination of 13C concentrations on
various samples underway
q SP5.4:
v Be films: optimization of deposition recipes to reproduce JET-ILW results for D retention and simulate
exposure and baking conditions in ITER ongoing
v W films: films routinely produced for experiments on MAGNUM-PSI and for LIBS
q SP5.7:
v New approach to model arcing being introduced and numerically benchmarked
v AUG and W7-X tiles extensively analysed to better understand formation of arcing patterns
q SP5.8:
v Task finally started by surface analyses of 2 marker tiles originating from the C3 campaign
Antti Hakola | WP PFC & JET2 Annual Meeting | VC | 9 Nov 2020 | Page 41You can also read