Cal-Comp Technology (Philippines), Inc. ("CCPH") - Company Presentation September 2019 - Company Presentation
←
→
Page content transcription
If your browser does not render page correctly, please read the page content below
Cal-Comp Technology (Philippines), Inc. (“CCPH”)
                              Company Presentation
                                       September 2019

                     Page 0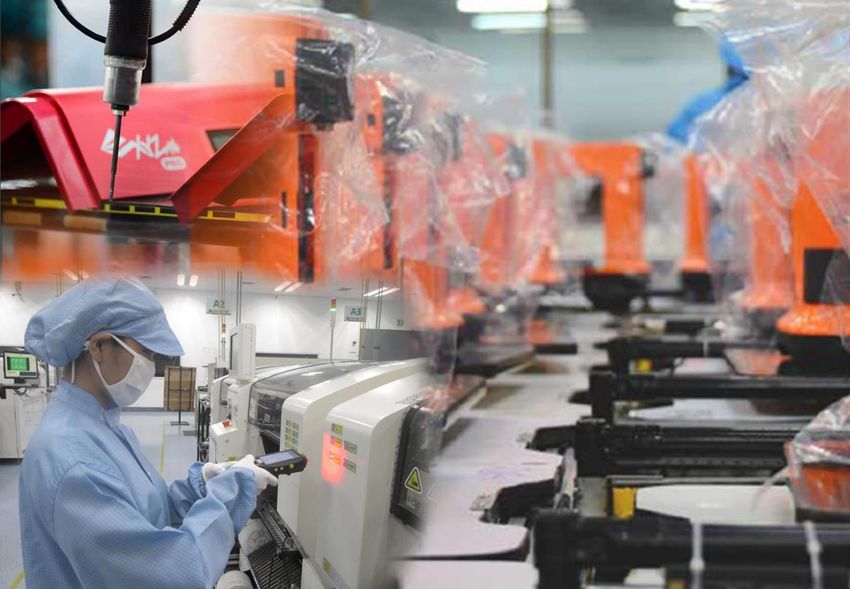
Disclaimer
This presentation has been prepared by Cal-Comp Technology (Philippines), Inc. (the “CCPH”) solely for use at the presentation regarding CCPH and its subsidiary, Kinpo
Electronics (Philippines), Inc. (“KPPH”) on a consolidated basis (collectively, the “Company”).

The information contained in this presentation has been taken from sources deemed reliable by the Group and the Company. However, no representation or warranty
(whether express or implied) is made as to the fairness, accuracy, completeness or correctness of, and no reliance should be placed on, such information or opinions
contained herein. None of the Company, any member of the Group, any of their advisors nor any of their respective affiliates or any of their directors, officers,
employees, advisers or representatives shall have any liability whatsoever (for negligence or misrepresentation or in tort or under contract or otherwise) for any loss
howsoever arising from any use of information presented at this presentation or otherwise arising in connection with this presentation.

This presentation may contain statements that reflect the current beliefs and expectations of the Group and the Company about the future as of the respective dates
indicated. These forward-looking statements are based on a number of assumptions about the operations of the Group and the Company and factors beyond the control
of the Group and the Company and are subject to significant risks and uncertainties, and, accordingly, actual results may differ materially from these forward-looking
statements contained in this presentation regarding past trends or activities should not be taken as a representation that such trends or activities will continue in the
future. There is no obligation to update or revise any forward-looking statements, whether as a result of new information, future events or otherwise. You should not
place undue reliance on forward-looking statements, which speak only as of the date of this presentation. The Company and its advisors have no obligation and do not
undertake to revise forward-looking statements contained in this presentation to reflect future events or circumstances.

By accepting this presentation, the recipient acknowledges and agrees that (1) it will hold in confidence the information contained herein; (2) it will not distribute or
reproduce this presentation, in whole or in part; and (3) the recipient is (a) located outside the United States, (b) is accustomed to receiving the type of information
contained in this presentation and (c) is a person into whose possession this presentation may be lawfully delivered in accordance with the laws of the jurisdiction in
which it is located.

The information contained in this presentation is not to be taken as any recommendation made by the Group or the Company or any of their advisors or any other
person to enter into any agreement with regard to any investment.

This presentation and any accompanying slides or other materials are strictly confidential and are not for release, distribution or publication, whether directly or
indirectly, and whether in whole or in part, into or in the United States, Australia, Canada, or any other jurisdiction in which such release, distribution or publication
would be unlawful. This presentation is not an offer for sale of any equity shares or any other security of the Company or any other member of the Group. This document
does not constitute a prospectus, offering circular, or offering document or form a part of any offer, invitation or solicitation to purchase or subscribe for securities in any
jurisdiction. Any securities referred to herein have not been and will not be registered under the U.S. Securities Act of 1933, as amended (the “Securities Act"), or the
securities laws of any state of the United States. Any securities mentioned herein or at the investor meetings may not be offered or sold within the United States absent
registration or an exemption from registration under the Securities Act.

No public offering of any securities is being made in the United States, or in any other jurisdiction where such an offering is restricted or prohibited.

By participating in this presentation or by accepting any copy of the slides presented, you agree to be bound by the foregoing limitations.

                                                                                     Page 1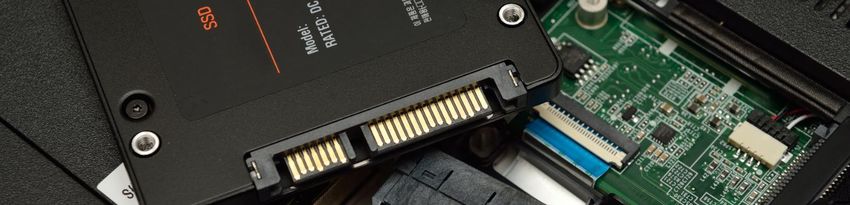
Table of Contents

Section                                       Appendix
1. Introduction to the Kinpo Group            A. Corporate Structure
2. Business Overview                          B. Supplemental General Information
3. Industry Overview and Outlook
4. Key Strengths of Our Business
5. Key Strategies Moving Forward
6. Financial Highlights

                                     Page 2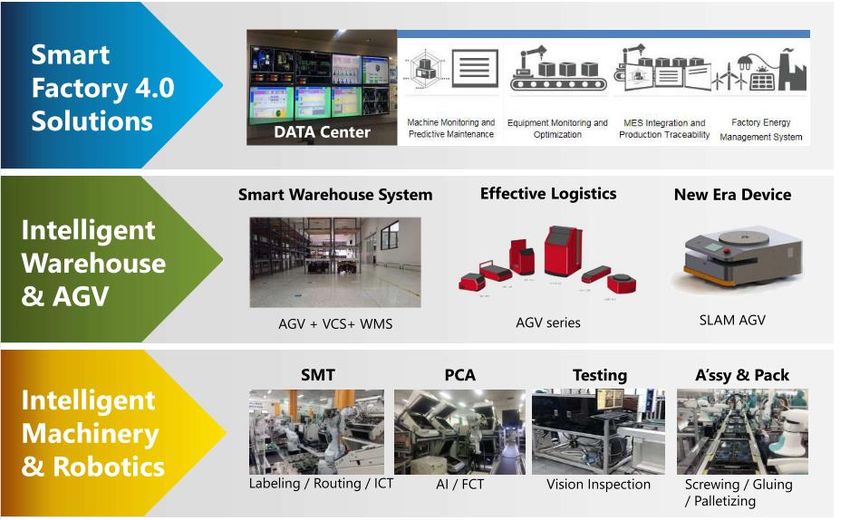
Introduction to the Kinpo Group

  Page 3
Kinpo Group of Companies

                   Established in 1973,
Kinpo Group is a Leading Global Technology ODM Company

                     38.6 B US Dollar Revenue    (1)

                     8 Publicly Listed Companies
                     24 Group Subsidiary Companies
                     69 Factories
                     120,902 Employees
Note:
1)    As of FY2018

                               Page 4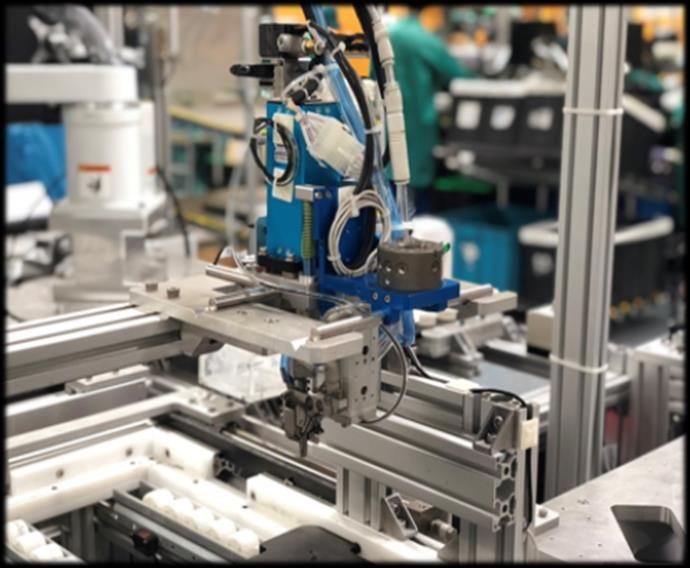
Kinpo Group of Companies (Cont’d)

                                                Kinpo Group
                                                Founder/Chairman: Rock Hsu

        New Kinpo Group (“NKG”)                                                  Compal Group
        CEO: Simon Shen                                                          CEO: Martin Wong

        Kinpo                                          Cal-Comp Precision         Compal
        Consumer Electronics / PC Peripheral           Precision Plastic          Notebook, PC, TV and Mobile

        Cal-Comp (Thailand)                            XYZ Printing               Arcadyan
        EMS                                            3D Printing                WiFi

        AcBEL                                          Cal-Comp Biotech           Allied
        Power Supply                                   Plant Factory              Bare PCB Manufacturing

                                                                                  Compal Broadband
        CastleNet                                      CCBS                       Networks
        Cable Modem                                    Semiconductor Packaging
                                                                                  Networking, Home Security

        CCPH
        EMS/ODM for Consumer                           Cal-Comp Big Data
        Appliances & Electronics                       Big Data

        QBit                                           New Era AI Robotic
        Semiconductor Design                           AI Robot

        Cal-Comp Automation and
        Industrial 4.0 Service                         Cal-Comp Yue Yang
        Automation and Industrial 4.0 Service          EMS

                                                             Page 5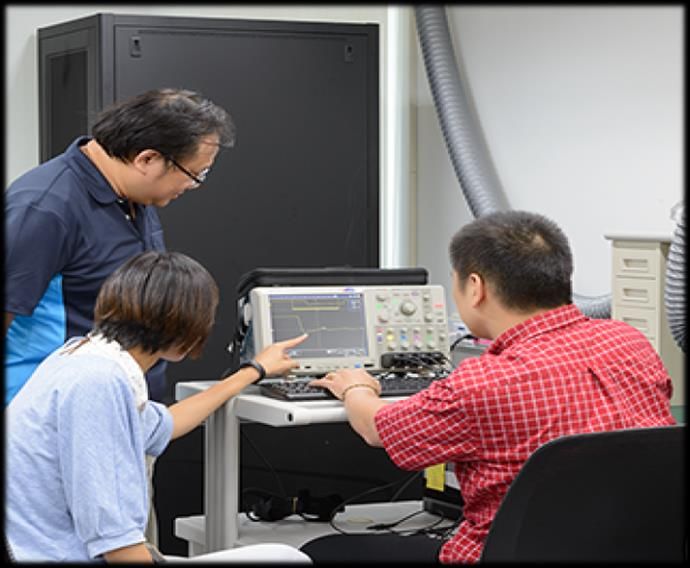
Overview of NKG’s Key Major Product Lines

 Calculators   HDD PCBA       External      Set-Top-        Printers
                              HDD/NAS       Boxes

 SSD            3D Printer    Gateway       Semiconductor   Smart Home
                                            Package         Appliance

                                   Page 6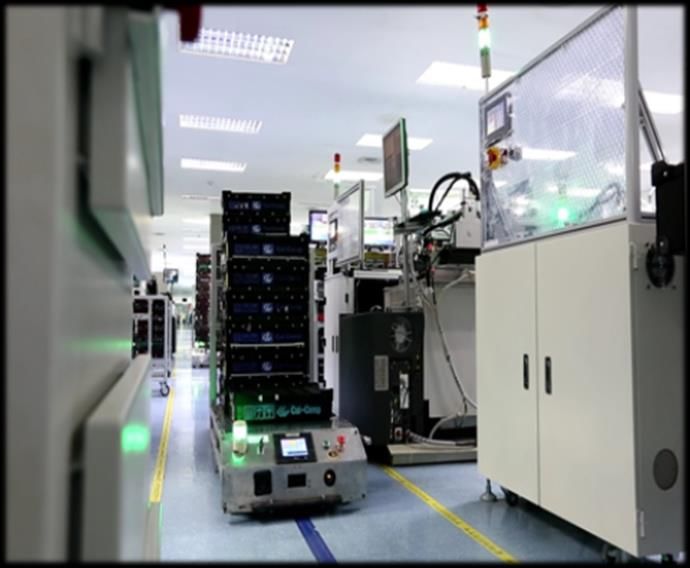
Overview of NKG’s Emerging Technologies/New Products

 3D Printer    Robot         Semiconductor   HiMirror   Beauty
                                                        Product

                                  Page 7
NKG is the Largest Contract Manufacturer in Southeast Asia

                                               We are proud that
         Thailand       Philippines
                                               NKG is the Largest
                                               Contract Manufacturer
            Malaysia                           in Southeast Asia
                                               NKG Group have factories in Thailand,
                                               Philippines and Malaysia, especially long history
                                               in Thailand for 28 years and Philippines for 20
                                               years.

                         Thailand                 Philippines                 Malaysia
  Land Area (m2)           444,736                   288,947                    12,667

  Floor Area (m2)          335,115                   213,925                    13,829

  Employees                24,783                     15,725                      631

                                      Page 8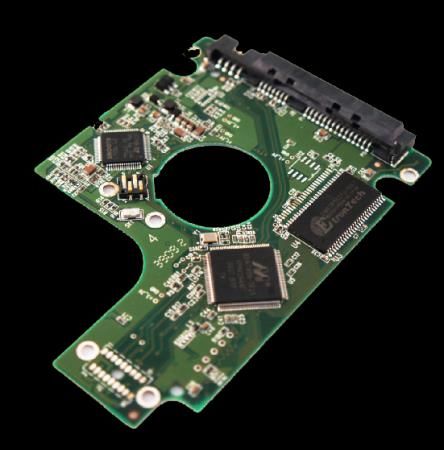
Business Overview

Page 9
Why the Philippines?
Sufficient supply of workforce Flourishing civil construction & stable infrastructures
Highly educated & skilled workers Tax benefits
Government support (PEZA) Shielded from impact of international trade conflicts
Thailand Philippines
Malaysia China
Page 10Why CCPH?
CCPH offers its customers lower costs, faster delivery
times, design capabilities and world-class product quality
Global Enhancing
End to End
Manufacturing Vertical
Service
Presence Integration
Long Term Real Time
Strong Automation Global On- Partnership Quality
Engineering Site Support with Customers Management
System
Page 11CCPH At a Glance
CCPH was incorporated in 2012 and is the Philippine EMS/ODM subsidiary of NKG, a private global
technology conglomerate based in Taiwan with listed subsidiaries in Taiwan and Thailand FY2018 CCPH Sale of Goods
NKG ranks in the top 10 EMS/ODM companies globally by revenue according to QYResearch with total Breakdown
revenues of US$6.7Billion in 2018
7%
CCPH manufactures over 70% of all scientific calculators globally
CCPH manufactures:
electronic storage products: HDDs, and
US$ 413M
consumer electronics products: calculators, smart home appliances and smart beauty products,
pachinko display, and solar junction boxes
93%
Storage Products Consumer Products
Product Segment Description FY2018 Sale of Products Key Customers
Goods Contribution
Calculators CCPH manufactures different types of ~27.6% Basic calculators (1)
calculators for the world’s best-known Scientific calculators
calculator brands Financial calculators (1)
Graphing calculators (1)
TI-Innovator Hub
Other Consumer Electronics CCPH provides final assembly services ~65.1% Smart home Leading UK-based
technology company
and manufacturing services for a range appliances
of other consumer electronics products Pachinko display (1)
(including products under its own brand Solar junction box
HiMirrorTM) Beauty products (2)
Robot products
Storage Products CCPH produces various types of HDD ~7.3% Hard drive disks
PCBA and external HDD products (HDDs) including PCBA
and external HDDs
Note:
1) Through Kinpo Electronics Inc., a related party
2) Through Cal-Comp Big Data, a related party
Page 12CCPH’s Ownership Structure
Kinpo International Cal-Comp Electronics
(Singapore) Pte. Ltd. (Thailand) Public
(Wholly owned by Kinpo
Electronics, Inc.) Company Limited
80.81% 19.19%
Cal-Comp Technology
(Philippines), Inc.
(Manufactures HDDs and PCBAs)
100%
Kinpo Electronics
(Philippines), Inc.
(Manufactures Calculators and
Smart Home Appliances)
Page 13Industry Overview & Outlook Page 14
Industry Size
   CCPH Primarily Operates in Fast-Growing Regions

The rapid rise in the                     Revenue Comparison by Region for 2014, 2018, 2025E
demand for consumer                                           (USDbn)
                              USA      Europe   China   Japan       Taiwan     Southeast Asia      ROW       Total            65.7
and smart electronic                                                                                                             5.1
devices across the globe
                                                                                                                                 7.1    10.7% share
is driving the EMS
market growth.                                                                   46.4                                            9.2
                                                                                  3.9
                                         38.7                                                                                    3.1
                                                                                  4.5           9.7% share
ASEAN is expected to                     3.2
                                         3.5       9.1% share                     7.3
continue to outgrow the
                                         6.0                                      2.3                                         24.4
broader industry due to                  2.1
lower labor costs and                                                            15.2
                                         12.3
improving talent in the
                                                                                                                                 7.5
region.                                  5.2                                      5.9

                                                                                  7.3                                            9.4
                                         6.4
NKG is committed to
                                         2014                                    2018                                        2025E
expanding its ASEAN
manufacturing base with        Country / Region                              2014 – 2018 CAGR                        2018 – 2025 CAGR
increasing operations in       USA                                                3.4%                                    3.8%
the Philippines (CCPH) in      Europe                                             3.3%                                    3.5%

particular, due to the         China                                              5.4%                                    6.9%
                               Japan                                              3.0%                                    4.2%
country’s      deepening
                               Taiwan                                             4.8%                                    3.4%
talent pool and good           Southeast Asia                                     6.5%                                    6.6%
labor relations.               ROW                                                5.0%                                    3.9%
                               Global Average                                     4.7%                                    5.1%
  Source: QY Research

                                                          Page 15
Industry Size
The Company’s Products are Primarily Focused on the Fastest-Growing Segment
Revenue Comparison by Application for 2014, 2018, 2025E
(USDbn)
65.7
Computer Communications Consumer Industrial Others
5.3
8.0
46.4
3.3 13.5 20.6% share
38.7 4.8
The Consumer segment 2.6
7.8 16.8% share
is projected to have 3.7
5.7 14.7% share
the fastest rate of 25.8
growth. 12.4
16.0
The Company is mainly
14.3 14.4 13.1
involved in the
manufacture of
2014 2018 2025E
consumer electronics.
End User / Application 2014 – 2018 CAGR 2018 – 2025 CAGR
Computer 0.2% -1.3%
Communications 6.6% 7.1%
Consumer 8.2% 8.2%
Industrial 6.9% 7.4%
Others 6.4% 6.9%
Global Average 4.7% 5.1%
Source: QY Research
Page 16EMS Market Players
NKG is a leading player regionally and globally
Share of Players in Global EMS Revenue in 2018
New Kinpo Group
Others 12.5% 14.5%
Total EMS revenue of
1.3%
USD46.4bn in 2018 is 1.8%
1.9%
shared largely by 2.5%
fifteen major players. 2.8%
3.3%
21.6%
Globally, New Kinpo 3.7%
Group is the second 4.1%
largest EMS company, 4.4%
with 14.5% market 4.7% 4.8% 5.6% 10.4%
share according to
revenue in 2018. Share of Players in Southeast Asian EMS Revenue in
2018
Others New Kinpo Group
NKG is also a leading 19.0% 21.9%
player in Southeast
Asia in 2018, holding 1.1%
1.0%
an equivalent to 21.9% 1.2%
2.2%
of the total market 2.4%
share according to 2.7%
revenue. 4.0% 18.4%
4.3%
3.7% 5.4% 4.1% 3.1% 5.4%
Source: QY Research
Page 17Key Strengths of Our Business Page 18
Strong Parent Support

As a member of NKG, CCPH benefits from NKG’s:

       Global Design,                                       Long Global
                                          Vertically
       Research and                                        Customer and
                                      Integrated Supply
       Development                                            Supplier
                                            Chain
        Capabilities                                       Relationships

                                                              Dynamic
      Stringent Quality                Strong Financial     Management
          Standards                       Resources        Team with Long
                                                          Global Experience

                                                Page 19
Fast Scalability
Total Units Produced (000's of units)
47,027 50,339
42,587
38,399
9,167
4,791
251
2012 2013 2014 2015 2016 2017 2018
Total Personnel(1)
6,813 7,390
3,959
3,169
1,632
95 173
2012 2013 2014 2015 2016 2017 2018
Note:
1) Includes both regular employees and seasonal workers sourced through third party manpower agencies
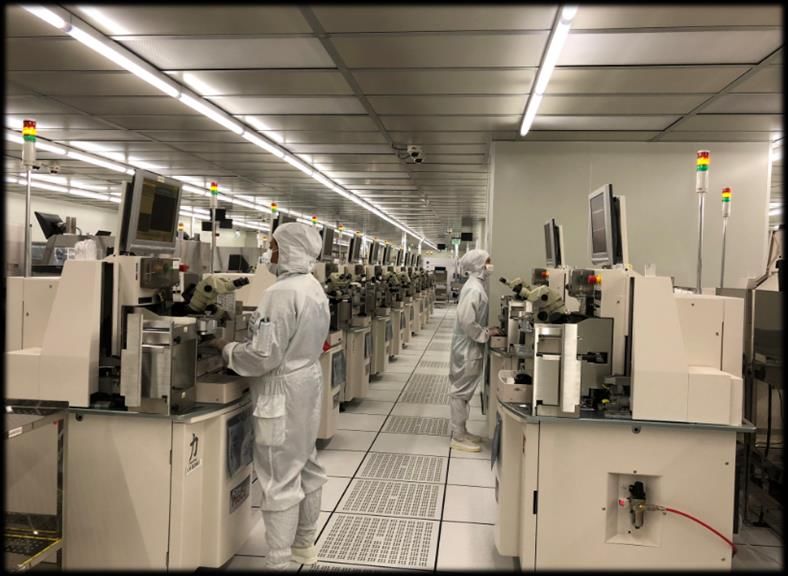
Page 20Smart Automation
Page 21Real-Time Quality Management
Page 22Globally Certified Standards
Safety
Electromagnetic Capability
Corporate Social Responsibility Quality
Page 23Strong Board and Management Team
Over 170 years of combined experience in Global Manufacturing :
Name Position Background
Simon Shen Chairman, CEO of the New Kinpo Group since 2008; led the Group’s transformation
President & CEO from a traditional EMS company to a vertically integrated company with
enhanced supply chain and R&D capabilities
Tony Chou Director & General CCPH Director since 2012 and General Manager since 2016
Manager COO of the New Kinpo Group
Director and Managing Director of Cal-Comp Electronic (Thailand) since
2006 with over 30 years of Manufacturing experience
Hugh Lo Director & Investor Over 30 years experience in the Manufacturing and Consumer fields
Relations Officer Masters in Industrial Engineering from the University of Massachusetts
Kirby Wong Director Over 20 years experience in Manufacturing, with strong technical
background and experience on program management
Naipuu You Director Over 20 years experience in EMS industry and Business development
Derek Khoo Director Over 20 years experience in the contract manufacturing industry,
establishing and developing new businesses with key international
customers
Page 24Strong Board and Management Team (Cont’d)
Name Position Background
Gregory L. Independent Former Secretary of DTI and Head of BOI
Domingo Director Former Director of SMIC, Belle Corp. & Carmelray-JTCI Corp., and
currently a Senior Advisor to SMIC and a board member of BDO Private
Bank
Cirilo P. Noel Independent Former Chairman & Managing Partner of SGV & Co.
Director Director of Globe Telecom, Security Bank, JG Summit & St. Luke’s
Medical Center
Emmanuel Independent Partner at SyCip Salazar Hernandez & Gatmaitan Law Offices
M. Lombos Director
Marlo P. Corporate Has served as external legal counsel for First Gen Corporation, First Gas
Arcinas Secretary Power Corporation & Meralco Industrial Engineering Services among
many others
Frank Yu Compliance Officer Senior Legal Manager of NKG since 2006
Over 20 years of experience in Legal Management and Regulatory
Compliance
Martin Lee Treasurer Has served as an independent auditor for Deloitte, and has 19 years of
Accounting and Finance experience
Page 25Key Strategies Moving Forward Page 26
Continuous Improvements & Innovation in our Manufacturing
Capabilities
Continuously innovate and improve technology, product quality and design
Capture business from customers looking to migrate manufacturing out of China by
expanding Philippine operations and capabilities
Constantly improve efficiency through automation for lower cost and better quality
Improve supply chain capabilities to improve raw material costs and reduce lead
times, through NKG’s Vendor Partnership Program
Design-for-manufacturing capabilities, designing their own manufacturing systems
tailored to the clients’ products
Page 27Develop Local Engineering Talent
As of June 30, 2019, CCPH has 429
engineers in the Philippines
Plans to further increase this number in
order to increase Research and
Development capabilities within the
country
On average, it takes three to five years to
fully train a new engineer
Page 28Develop Our Own Brands and the Philippine Domestic Market For
New Consumer-Focused Products & Emerging Technologies
The Company intends to leverage on NKG’s own-product designs and develop and
market these in the Philippines
The Company continuously negotiates with local players to determine the market
feasibility of manufacturing and introducing certain products, such as smart beauty
products, and robotics, into the Philippine market
Beauty Products Robotics
Page 29Financial Highlights Page 30
Historical Financial Performance
Total Revenue
500.0
415.2
400.0
Strong growth in revenue due to higher CAGR
YoY Growth
demand for smart home appliances and = 83.3%
= 45.3%
In US$ Millions
shift in manufacturing from China to 300.0 278.8
ASEAN
210.6
191.8
200.0
1H financial performance is not
representative of full year performance 123.6
due to typically stronger seasonal demand 100.0
in the 2H of the year
0.0
2016 2017 2018 6M 6M
2018 2019
Page 31Historical Financial Performance (Cont’d)
Gross margins continue to improve
due to manufacturing process Gross and Operating Margins
improvements 14.0% 12.6% 13.3%
12.0% 11.1%
10.0% 8.2% 11.3%
7.3% 10.1%
8.0%
Operating margins also improved 8.1%
6.0%
due to better gross margins and 4.0% 4.7%
continued cost-control initiatives 2.0% 2.2%
0.0%
2016 2017 2018 6M 2018 6M 2019
Gross Margin Operating Margin
Due to the improvement in margins,
net income grew strongly in the last Net Income
35.0
3 years and in the interim period of 31.4
28.5
30.0
In US$ Millions
2019 CAGR
25.0
Margins improved due to = 688.7%
20.0 18.7
increases in production
15.0
efficiency and utilization rate
10.0 7.2
Operating expenses did not
5.0
increase as fast as revenue 0.5
0.0
growth 2016 2017 2018 6M 2018 6M 2019
Page 32Robust Balance Sheet
Assets and Liabilities
500.0
406.6
In US$ Million
400.0 343.2
The Company maintains a stable 300.0 257.8
224.8
balance sheet by actively managing its 200.0 166.0 180.3
126.3
liquidity and equity position 100.0 41.6
0.0
2016 2017 2018 6M 2019
Assets Liabilities
Financial Ratios
1.6
1.29
1.3 1.15 1.24
As of June 30, 2019, the Company had 1.06 0.96 1.121.11
a total of US$94 million in bank debt, 1.0
(x)
with a healthy Debt to Equity ratio of 0.7
0.4 0.33
1.24x
0.1
2016 2017 2018 6M 2019
Current Ratio D/E Ratio
Page 33Thank You Page 34
Appendix A
          Corporate Structure

Page 35
Corporate Structure
Page 36Appendix B Supplementary General Information Page 37
CCPH Philippine Footprint

        Business                                    •    Electronic Manufacturing Services (“EMS”)
                                                    •    Original Design Manufacturer (“ODM”)

        Products                                    •    Calculators
                                                    •    Smart Home Appliances
                                                    •    External Hard Disk Drives (“HDDs”)
                                                    •    HDD Printed Circuit Board Assemblies (“HDD PCBA”)
                                                    •    Pachinko Displays
                                                    •    Solar Junction Boxes
                                                    •    Beauty Products
        Clients                                     •    Casio(1)                          •   UK-based smart-home appliance provider
                                                    •    Citizen(1)                        •   Tigo(2)
                                                    •    Texas Instruments(1)              •   Shinsei(1)
                                                    •    Toshiba
        Locations                                   •    Lima Technology Center, Lipa City, Batangas
                                                    •    First Philippine Industrial Park, Sto. Tomas, Batangas

        Total Leased Land Space                     •    286,434 square meters

        Total Manufacturing Space                   •    78,146 square meters

        Total Workforce                             •    Approximately 7,000 employees(3)

Notes:
1. Through Kinpo Electronics Inc., a related party
2. Through Cal-Comp Big Data, a related party
3. Includes regular and seasonal employees sourced through third party manpower agencies

                                                                              Page 38
Why NKG?
• Vertically-integrated supply chain
• Strong automation engineering and advanced
Competitive Cost automation capabilities
• Effective management of overhead costs
Experienced • Flexibility to satisfy customers’ On-Time Delivery (OTD)
Production Planning requirements
• Certified to the latest Safety, EMC, CSR and Quality
Quality Standard System Standards
• Applies Design for Manufacturing (DFM) and Design for
Cost Effective Assembly (DFC) to ensure product
Design Capabilities design is optimized for assembly, service, quality and
process
Page 39Product-Specific Initiatives
HDD PCBA and External HDD – Create higher capacity HDDs at lower cost
Calculators – Improve existing product capabilities and develop ultra-thin
stylish designs
Smart Home Appliances – Improve productivity and efficiency in order to
win orders for new product lines
Smart Beauty Products – Launched the “HiMirror” brand in 2017, and will
continue to develop and market new products in the category
Page 40You can also read