Adobe Digital Economy Index - Adobe Analytics | U.S. Feb 2021
←
→
Page content transcription
If your browser does not render page correctly, please read the page content below

Adobe Digital Economy Index
Adobe Analytics | U.S. Feb 2021

 ©2021 Adobe. All Rights Reserved.
Methodology

Most comprehensive report of its kind

• The DEI is powered by Adobe Analytics, which analyzes 1 trillion visits to retail sites and over 100 million SKUs.

• Adobe Analytics measures transactions from seven out of the top 10 U.S. airlines.

• Companion research based on a survey of 1,018 U.S. consumers (18 years or older) fielded between Feb 26 and March
 2, 2021.

 ©2021 Adobe. All Rights Reserved. 2
KEY FINDINGS
 • While we might never again see the 42% year-over-year (YoY) growth, we saw for 2020, 2021 is showing no signs of
 slowing down; Jan – Feb 2021 grew 34% YoY.

 • The elevated growth online spending experienced in 2020 has persisted in 2021, as consumer shopping online across
 electronics, home improvement goods, and groceries remains high, while apparel and home office sales have seen
 growth become far weaker.

 • With a year distance from the height of the online stock-piling surges, stock-out levels for online goods are still quite
 high as online retailers appear to still be facing logistical supply challenges in managing more optimal stocking levels.

 • Low-profile sales days like Presidents Day and Labor Day see weaker growth in a heavy online retail environment.

 • Curbside pick-up draws down from seasonal highs but remains a dominant mode of order acquisition.

 • Online inflation remains elevated for electronics, home goods, and groceries, digital purchase power is weaker, and
 prices are ticking up in the first few months of 2021 as they seasonally adjust from their holiday lows.

 ©2021 Adobe. All Rights Reserved. 3
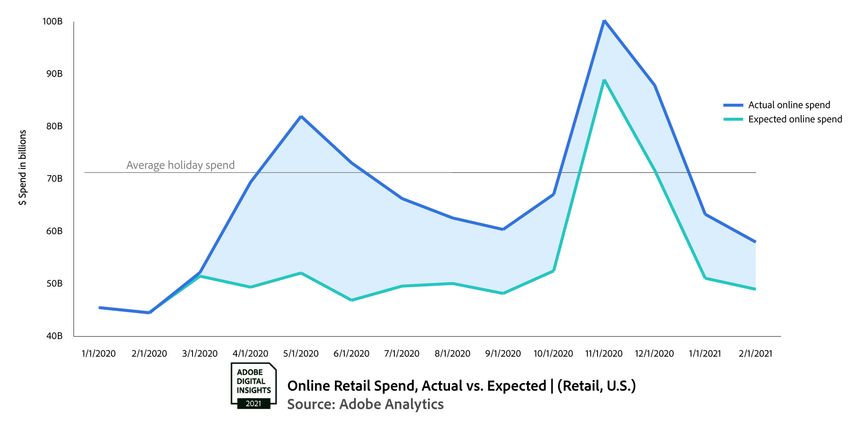
E-commerce got a permanent boost due to the pandemic

• An extra $183 billion has been spent online
 since March 2020, up to a total of $844B.

• We predict a full Q1 to grow at about +29% YoY.

• 2020 grew at 42% YoY, totaling $813 billion.

• E-commerce spend was bound to drop from the
 +80% YoY growth we saw in May, but it’s now
 evident that +20% of that boost is here to
 stay.

• While this year in total might not grow at the
 +42% that 2020 saw, online shopping is not
 slowing down — January and February grew
 at 34% YoY, amassing a total of $121 billion in
 online spend so far.

 ©2021 Adobe. All Rights Reserved. 4
Stockouts plagued e-commerce in April/May, and are still a common sight

• The percentage of out-of-stock products
 began surging in March as retailers struggled
 to keep up with the influx of new customers.

• The initial peak came in July, with consumers
 seeing 3 times as many out-of-stock
 products as they did pre-pandemic.

• Holiday shopping brought a second wave in
 out-of-stock products, and in January 2021
 out-of-stock levels were elevated to 4 times
 pre-pandemic.

• Consumers advised that in January 2021
 products within groceries, medical equipment
 and supplies, and pet product categories were
 out of stock online more often.

 ©2021 Adobe. All Rights Reserved. 5
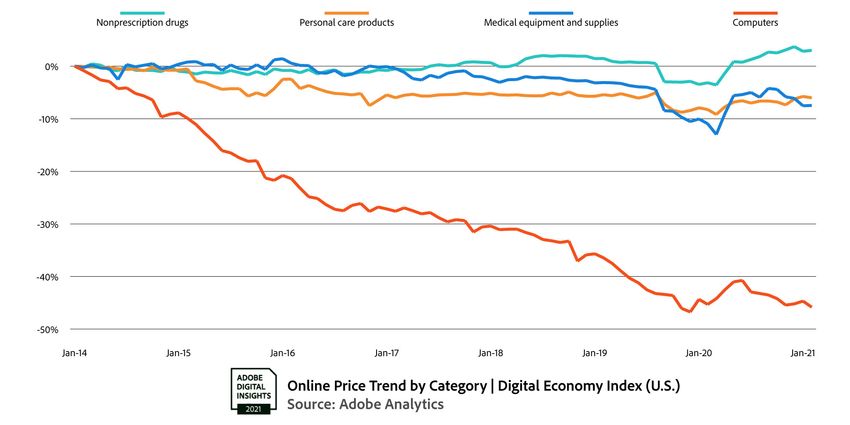
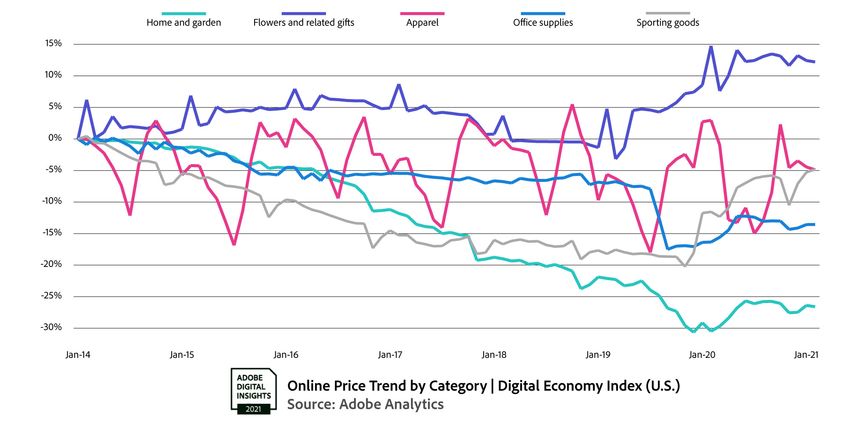
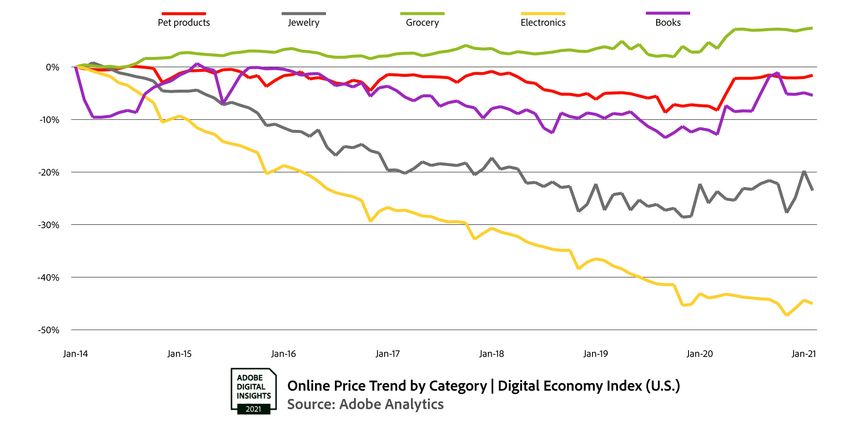
The sudden shift to e-commerce caused a price uptick, and it’s yet to recover

• Historically, e-commerce has benefited the
 consumer by giving them the power of easy
 price comparison.

• That competition drove prices down and
 continuously increased consumers’ purchasing
 power. Every year a consumer’s dollar gained
 4 cents in value when spent online.

• However, due to COVID and the strain on e-
 commerce from increased demand and resulting
 stockouts and shipping costs, consumers’
 purchasing power has slumped.

• Consumers feel price increases online: The top
 4 categories that consumers say* prices have
 gone up in the past month are groceries (51%),
 medical equipment and supplies (39%), media
 and entertainment (35%), and sporting goods
 (35%).

 *Insights based on consumer survey ©2021 Adobe. All Rights Reserved. 6
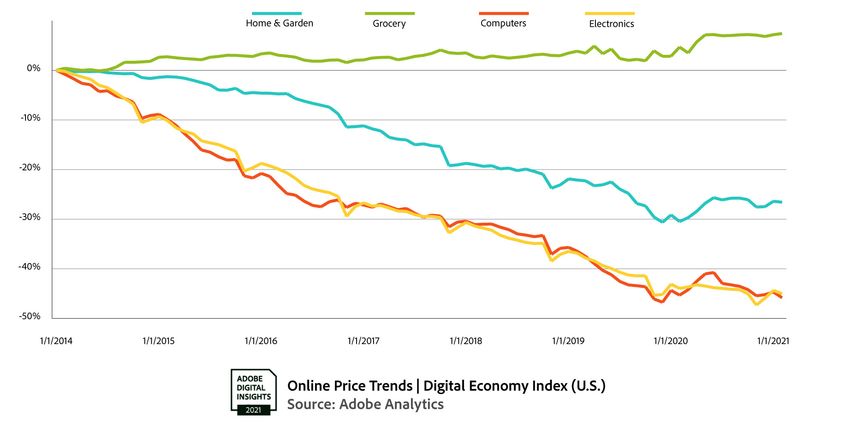
How digital purchasing power was weakened in 2020

• Uncommon inflation was observed across online categories, for the first time in
 years due to the pandemic.

• Typically, consumers see approximately a 4% increase in digital purchase power
 (DPP) each year — however, consumers saw a DPP decrease of -1% YoY in 2020.

• As COVID-informed demand spiked across products, logistical challenges
 produced limited supply. Consumers found themselves facing higher prices, across
 a host of goods, online (instead of an online buying environment where they
 normally enjoy value in terms of discounting on products).

• Key categories that saw strong online price shifts, over the course of 2020,
 compared to previous years included:
 - Electronics: -2.2% YoY (Jan 2020-2021) / -10.4% YoY (Jan 2019-2020)
 - Groceries: +4.2% YoY (Jan 2020-2021) / -.6% YoY (Jan 2019-2020)
 - Computers: -.6% YoY (Jan 2020-2021) / -13.5% YoY (Jan 2019-2020)
 - Home & garden: +3.9% YoY (Jan 2020-2021) / -9.3% YoY (Jan 2019-2020)

 ©2021 Adobe. All Rights Reserved. 7
Buy now, pay later reigns supreme

• A combination of new retailers offering buy now, pay later (BNPL)
 options and consumer financial stress has led to increased usage in this
 payment method — the first two months of 2021 have already seen
 215% YoY growth in usage.

• Consumers using this payment method place orders that are 18% larger
 than orders placed with other payment methods.

 ©2021 Adobe. All Rights Reserved. 8
The Northeast had the highest e-commerce peak, but the west is persisting

 Region YoY Growth

 West 34%

 Northeast 30%

 South 29%

 Midwest 25%

 • The Northeast U.S. showed the strongest reaction to the pandemic at its height in June 2020.
 • The Western states are showing the highest persistence in online shopping.
 • The Midwest e-commerce spend grew the least in 2020 and is only showing 31% so far this year.

 *Insights based on consumer survey ©2021 Adobe. All Rights Reserved. 9
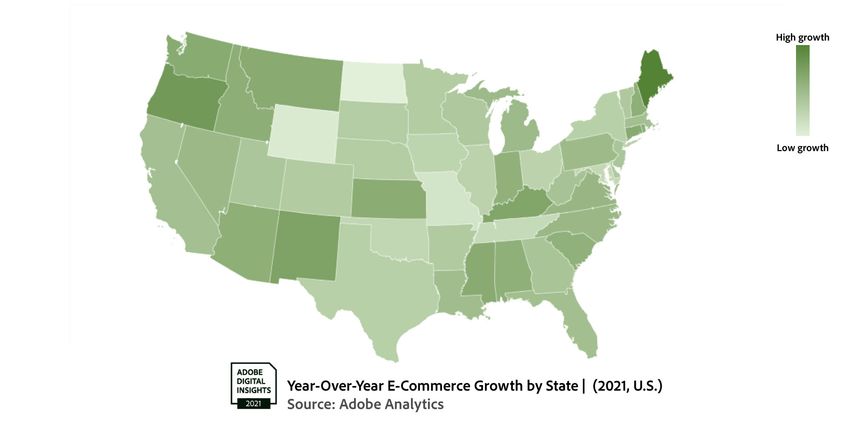
Maine is the highest-growing e-commerce state in 2021

 • The state* with the highest YoY (Jan – Feb)
 growth this year is Maine at +60% YoY.

 • Their online spend peaked in May, and never
 came back down fully like the other states.

 • North Dakota saw only +16% YoY e-
 commerce growth and market the bottom of
 the state's list, almost at the levels one would
 expect without the 2020 e-commerce
 acceleration.

 *In the contiguous US ©2021 Adobe. All Rights Reserved. 10
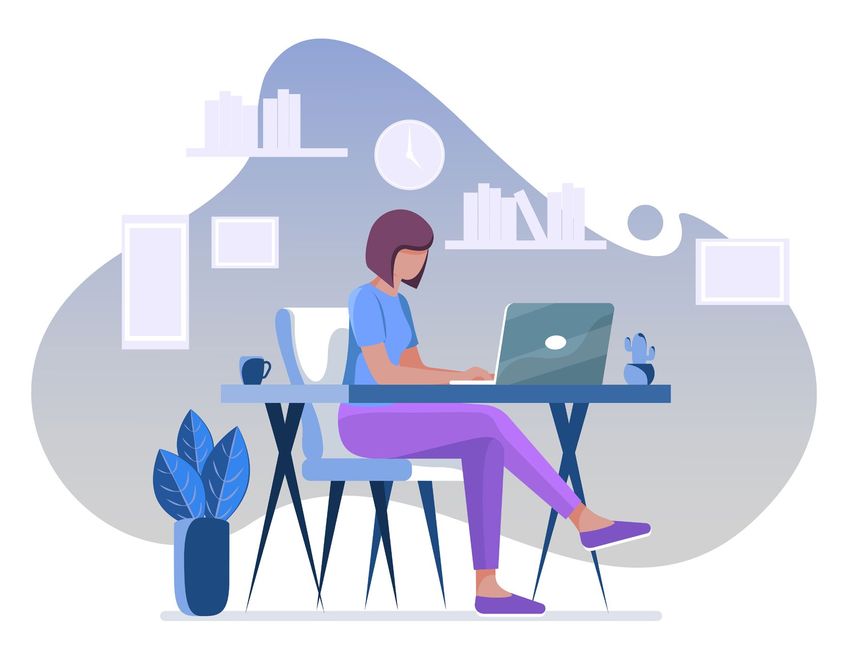
Consumers are shopping more and more during work hours

• While the pandemic has blended work life
 and home life for many people, more
 shopping has started during work hours.

• In 2021 this change in behavior resulted in
 consumers spending an extra $1.2 billion
 during work hours.

• BOPIS (buy online, pick up in store) might
 be playing a role in this as well, as some
 people might be ordering items to acquire
 their goods, on short jaunts, away from
 home.

 *Insights based on consumer survey ©2021 Adobe. All Rights Reserved. 11
Holiday days lose importance in e-commerce
• In 2020, Memorial Day was 9% less important
 than it was in 2019, Labor Day 16% less, and
 Presidents Day 2021 was 10% less important
 compared to the year prior.

• The decreased holiday spikes in revenue
 resulted in $32 million less online revenue on
 Memorial Day, $40 million on Labor Day, and
 $22 million on Presidents Day.

• Cyber 5 contributed 9% less to the holiday
 season this past year than the year prior.

• As e-commerce becomes ubiquitous, online
 shopping moves from being an “event” to a
 daily activity.

 ©2021 Adobe. All Rights Reserved. 12
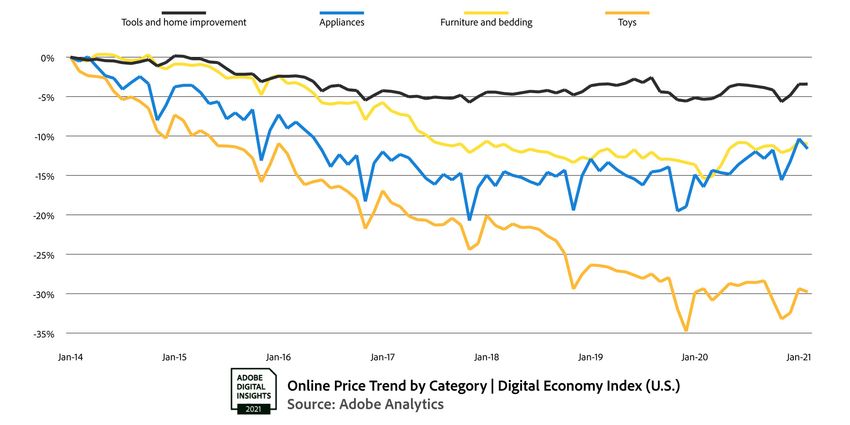
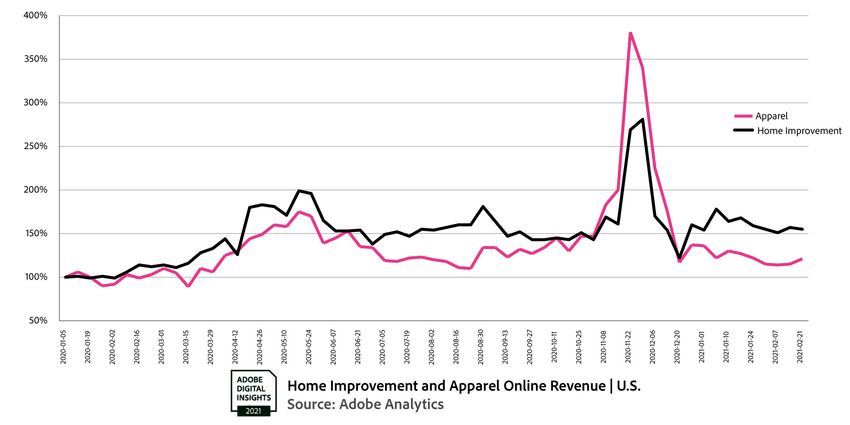
Home improvement boomed online in 2020, apparel lagged

• 2020 was a big fork in the e-commerce road,
 with some categories seeing big wins, while
 others lagged.

• From April – October 2020, home
 improvement received a 60% boost over
 January levels, while apparel lagged at 36%.

• This trend has continued in 2021, with home
 improvement seeing 60% YoY growth in
 January – February, and apparel at 22% YoY.

• Only 21% of survey respondents report* buying
 more clothing in the past four weeks compared
 to pre-pandemic, with 34% reporting they buy
 more home improvement products.

 *Insights based on consumer survey ©2021 Adobe. All Rights Reserved. 13
The pandemic has shifted what is bought online, permanently
• How people shop for groceries has changed forever
 o In late March 2020* online grocery surged in the shift online, hitting
 +350% compared to pre-pandemic* levels
 o Online grocery shopping has since recently* normalized and steadied
 out to levels +230% what was seen pre-pandemic
 o 42% of survey respondents report shopping more online for groceries
 in the past four weeks than pre-pandemic
• Consumers adjust to spending time and money outdoors
 o Sporting goods got a 230% boost over pre-pandemic levels in late
 March as people flocked outside
 o As summer* hit and consumers began to recreate outdoors more,
 sporting goods surged again to levels 120% higher than what was seen
 in March 2020
• New hobbies have been formed
 o In late March 2020, consumers showed interest in craft supplies and
 puzzles or games, which saw 370% and 250% pre-pandemic levels,
 respectively
 o With people staying indoors more as winter settles in, books have seen * Late March: March 23, 2020 – April 12, 2020
 a resurgence and recently hit levels 170% higher than late March Pre-pandemic: January 6, 2020 – January 26, 2020
 Summer: June 1, 2020 – June 21, 2020
 Recent: February 1, 2021 – February 21, 2021
 ©2021 Adobe. All Rights Reserved. 14
Curbside pickup shined last year, but has it peaked?
• Buy online, pick up in store (BOPIS) surged
 early in the pandemic as many shoppers tried
 to avoid shipping delays with the heavy shift to
 shopping online, peaking in May 2020 at 40%
 YoY growth.

• A second surge occurred during holiday
 shopping as shoppers tried once again to get
 their packages in time, with December 2020
 hitting the highest BOPIS usage levels yet.

• These levels have dropped in the post-holiday
 shopping craze, but remain elevated YoY —
 February 2021 grew at 67%.

• According to our survey, 30% of online
 consumers prefer using BOPIS or curbside
 over delivery.*

 *Insights based on consumer survey. ©2021 Adobe. All Rights Reserved. 15
Influx of new consumers is reshaping online shopping

 • 9% of consumers report* never purchasing
 an item online prior to the U.S. pandemic
 emergence in March 2020.

 • 47% of consumers agree* that the pandemic
 drove them to buy certain types of goods
 online, for the first time.

 • Bing's traffic driven to e-commerce
 sites increased 4 times faster than Google’s.

 • They don't have an established online
 footprint, so the search engines are driving
 7% more revenue share for online stores
 now, while emails drive 8% less.

 *Insights based on consumer survey. ©2021 Adobe. All Rights Reserved. 16
Scope and outlook

 U.S. March DEI April monthly refreshes begin Holiday Season trends

 Stay tuned for updates and data refreshes here:
 https://www.adobe.com/experience-cloud/digital-insights/digital-economy-index.html

 ©2021 Adobe. All Rights Reserved. 17
Appendix
The appendix contains a closer look at U.S. DEI categories, formula, and methodology, along with
the benefits to consumers, companies, and policy-makers.

 ©2021 Adobe. All Rights Reserved. 18
Why we’re introducing DEI in an evolving landscape
Before the COVID-19 pandemic: In today’s reality:
• The digital economy has been growing faster than the economy as a • Economic policy-makers need fast turnaround insights to manage a global
 whole. health and economic crisis.
• Inflation has been historically low—influenced by falling prices • Online shopping has become the primary means of commerce
 online. populations around the world as purchases made previously in person are
• Online shopping has been converging with offline as click-and-collect, shifted online.
 one-day shipping, and other services let people transact online for a • Shoppers' baskets have shifted toward items related to health, working
 wider variety of goods and services. from home, and social distancing.
• Mobile shopping has allowed people to shop and buy from anywhere • Companies are adjusting to daily changes in demand, supply, and labor
 at any time.
 availability.
• Online shoppers have become accustomed to being able to compare
 • With the global economy rapidly evolving, we need a metric and
 and buy products around the world and have them shipped to their
 supporting insights that can help consumers, citizens, companies, and
 door.
 policy-makers assess their economic world and make intelligent, informed
• Similarly, e-commerce companies have come to expect competition choices about how to help themselves and others.
 from around the world.
• In this growing global digital economy, we need a metric that can
 track online prices across nations and enables consumers, companies,
 and policy-makers to understand the trends, similarities, and
 differences across industries and countries.

 ©2021 Adobe. All Rights Reserved.
Measuring the 21st-century economy
A snapshot of the DEI Why we’re uniquely qualified to build the DEI
• It’s a measure of increasing consumer buying in the digital world, starting • Only we have the data from trillions of visits, tens of millions of products, and
 with the U.S. and growing to cover the world’s major economies. thousands of retailers needed to assess the global digital economy.
 • Our Adobe Sensei AI capability can take all this data and process it in near-real time to
• It uses this metric to explore our global digital lives, from when to buy a
 give high-speed insights.
 new TV to which countries pay most for organic produce.
 • We’re trusted by multiple companies to create this index.
• Through it we're able to establish the digital purchasing power (DPP) that
 • Only Adobe is trusted by the economists and academics that can use this data to make
 informs consumers' buying power online for various goods.
 a real difference in the world.
Why the DEI is important How DEI can help
• The world economy is interconnected, especially the digital economy, and • Consumers get a better understanding of their digital world—when to buy, what to
 it needs metrics that reflect that relationship. buy, and how digital commerce is changing their lives.
• Consumers, companies, and policy-makers need a high-speed, detailed, • Companies get a better understanding of local and global trends, allowing them to
 reliable, global source of insight to inform their choices. anticipate and manage across international businesses.
 policy-makers get a much-needed rapid read on the digital economy and key data that
What sets the DEI apart •
 can be used to anticipate broader economic trends.
• Its insights are fast and accurate.
• Its insights are based on what consumers actually purchase, rather than
 surveying respondents about products they've purchased without
 controlling for quantity (how BLS calculates CPI).
• Its data spans the globe.

 ©2021 Adobe. All Rights Reserved. 20
What the Digital Economy Index Measures

• The DEI calculates digital purchasing power (DPP) by country.
• DPP measures how much more people can buy online with a
 dollar, euro, real, pound, yen, etc. now versus a year ago.
• For example, if DEI for the U.S. is up by 2%, then $1 spent online
 now will buy you what $1.02 would have bought you a year ago.
• The DEI is always weighted by what people actually spend
 online:
 • As computers become less expensive, total online purchasing power
 will go up quickly because a good portion of what people buy online is
 computers.
 • But a rise in the price of pet products wouldn’t affect purchasing power
 much because people spend relatively little on pet products online.
• Economies with fast-growing DEIs are making more and better
 goods available to their online consumers more cheaply.
• Because Adobe’s DEI looks at what people actually buy, it allows
 reasonable comparisons between global economies.

 ©2021 Adobe. All Rights Reserved. 21
©2021 Adobe. All Rights Reserved. 22
©2021 Adobe. All Rights Reserved. 23
©2021 Adobe. All Rights Reserved. 24
©2021 Adobe. All Rights Reserved. 25
Methodology and partnerships We’ve partnered with economists Austan Goolsbee and Pete Klenow to contextualize and analyze the output from the DEI. Austan Goolsbee, University of Chicago Robert P. Gwinn Professor of Economics at the University of Chicago's Booth School of Business Formerly served as President Barack Obama’s chairman of the Council of Economic Advisers Pete Klenow, Stanford University Professor at Stanford University’s Department of Economics Currently visiting scholar, Federal Reserve Bank of San Francisco Member of editorial boards for Econometrica, American Economic Review, Quarterly Journal of Economics, and more ©2021 Adobe. All Rights Reserved. 26
Formula for the DEI

The base formulation for the DEI is informed by the Fisher Price Index:
 • The Fisher Ideal Price Index uses quantities purchased on the current period (month) and a previous period
 (previous month) to determine actual consumers’ preferences. Instead of assuming that consumers’ preferences
 for what goods to buy are constant over a certain number of years, it's able to account for the fact that they are
 constantly changing what they buy.

 ∑ =1 −1 ∑ =1
 Fisher πt = ∗
 ∑ =1 −1 −1 ∑ =1 −1

 ©2021 Adobe. All Rights Reserved. 27
How the DEI benefits consumers

• Consumers can get valuable guidance from the DEI, like
 the best times to buy appliances, TVs, or cameras. Our
 holiday report already featured DEI insights during the
 Q4 shopping season, and it provides guidance on the
 best days to buy hot-selling items.

• The DEI initiative will expand the product categories
 and geographic scope of our pricing data, which will
 allow consumers to tap into the best days to buy a wider
 assortment of goods — wherever they are in the world.

• Lastly, the DEI will help contextualize the pricing that
 consumers are observing on certain goods, as well as
 how these price changes may fluctuate and impact
 them in the future.

 ©2021 Adobe. All Rights Reserved. 28
How the DEI benefits companies
• Companies can gain valuable insights from the DEI, like how digital economies are different in the U.S. versus
 the UK, especially when it comes to apparel, grocery items, and a host of other product categories.

• The DEI shows movement in global prices that require context and comprehensive tracking so that
 companies can gain visibility into the market forces that are impacting their consumers and clients.

• Companies will be able to see how their pricing strategies will impact and be reflected in global pricing trends,
 both inside and outside their own product and goods categories.

• Quantitative data that the DEI initiative uncovers will illuminate how product demand is being impacted by
 price, and how consumers are substituting one type of good for another.

• The speed at which DEI data is populated will allow them to be more reactive to emerging pricing trends. In
 some cases the data will be predictive, which will be even more valuable to organizations everywhere.

 ©2021 Adobe. All Rights Reserved. 29
DEI data for leading thinkers and institutions

• We will make our DEI data feeds available to governmental institutions and organizations that develop
 policy and provide economic guidance.

• Organizations that are looking for ways to more accurately understand the digital economy will be able
 to use real-time data to analyze the rapid-impact events like COVID-19 that are happening both
 domestically and globally.

• This data will be a combination of pricing and product-level category data to help economic institutions
 better determine which parts of the digital economy can best predict inflation, as well as how consumer
 baskets are shifting.

• These data feeds will be provided on a biweekly cadence to most organizations so that they can be more
 responsive to shifts happening within different sectors.

 ©2021 Adobe. All Rights Reserved. 30
How the DEI benefits policy-makers

• Policy-makers can get guidance from the DEI, especially in categories where digital data predict changes
 in the broader economy.

• The DEI can look at prices mapped across a national census framework. This allows for pricing and product
 sales insights across urban and rural regions, high- and low-income segments, and diverse and non-
 diverse populations. Ultimately, this allows policy-makers to understand the pricing effects being experienced
 by different constituencies.

• policy-makers can develop plans based on the DPP metric we’re tracking to determine the buying power
 consumers are experiencing over time.

• The DEI will be trended against the CPI to help paint a clear picture of whether consumers are experiencing
 better pricing offline or online. As a result, policy-makers will be able to make the case to expand broadband
 and bring connectivity to regions in need of favorable pricing on goods that were not accessible online before.

 ©2021 Adobe. All Rights Reserved. 31
You can also read