2021'S MAIN STREET BUSINESS SURVIVOR STUDY - PYMNTS.com
←
→
Page content transcription
If your browser does not render page correctly, please read the page content below
MARCH 2021

                                                                                                                                                                                   2021’S
                                                                                                                                                  MAIN STREET BUSINESS
                                                                                                                                                        SURVIVOR STUDY
                                                                                                                                                  UNDERSTANDING THE PROFILE OF MAIN STREET SMBS THAT
                                                                                                                                                             HAVE WEATHERED THE PANDEMIC’S FALLOUT

PYMNTS.com is where the best minds and the best content meet on the web to learn about “What’s Next” in payments and
commerce. Our interactive platform is reinventing the way in which companies in payments share relevant information about
the initiatives that shape the future of this dynamic sector and make news. Our data and analytics team includes economists,
data scientists and industry analysts who work with companies to measure and quantify the innovation that is at the cutting
edge of this new world.

This study series measures the COVID-19 pandemic’s impact on consumer and merchant behavior and explores the accelerated
shift to a digital-first world. Pandenomics is a proprietary research and analytic framework and series of insights that measures
the shift away from a primarily physical world toward one that is digital-first. This framework makes it possible to accurately
profile the characteristics of these digital shifters as consumers place priority on preserving their personal and familial health
and safety when making decisions about doing business in the world.
01   |   Introduction

                                                                                                                              INTRODUCTION
TABLE OF CONTENTS

                                                                                                                               F
                                                                                                                                                riday, March 19, 2021, will mark the one-year anniversary of the first
                                                                                                                                                statewide shutdown in the United States. California Governor Gavin
                                                                                                                                                Newsom issued executive order N-33-20 that day, instructing all non-
                                                                                                                                                essential businesses to close their doors and for residents to keep
                                                                                                                               to their homes.1 Other state governors soon followed suit, and by March 29,
                                                                                                                               2020, 26 states had implemented similar measures. It was not long before
Introduction . . . . . . . . . . . . . . . . . . . . . . . . . . . . . . . . . . . . . . . . . . . . . . . . . . . . . . 02
                                                                                                                               the once-bustling Main Streets across the nation were deserted as consumers
                                                                                                                               hunkered down and businesses shut their doors.
PART I: Driving sales  . . . . . . . . . . . . . . . . . . . . . . . . . . . . . . . . . . . . . . . . . . . . . . . 03

PART II: Managing costs  . . . . . . . . . . . . . . . . . . . . . . . . . . . . . . . . . . . . . . . . . . . . 09
                                                                                                                               Many states have eased their restrictions in the last year, and some consumers
                                                                                                                               have even returned to stores, but many of the small to mid-sized businesses
PART III: Looking forward  . . . . . . . . . . . . . . . . . . . . . . . . . . . . . . . . . . . . . . . . . . . 15            (SMBs) down Main Street are gone for good. PYMNTS’ latest research shows that
                                                                                                                               12 percent of all Main Street SMBs have permanently closed since the pandemic
Conclusion . . . . . . . . . . . . . . . . . . . . . . . . . . . . . . . . . . . . . . . . . . . . . . . . . . . . . . . 19    began, in fact, and 45 percent of those that remain feel they could be at risk of
                                                                                                                               closing in the near future.

Methodology  . . . . . . . . . . . . . . . . . . . . . . . . . . . . . . . . . . . . . . . . . . . . . . . . . . . . . 20      These “Main Street Survivors” may not all be on solid financial ground, but their
                                                                                                                               resilience and resourcefulness have already helped them weather a year of uncer-
                                                                                                                               tainty. Many have even emerged as more adaptable and technologically innovative
                                                                                                                               than ever before. So, who are the Main Street Survivors, and what can their lessons
                                                                                                                               in managing cash flow shortages and keeping operations afloat teach their peers
                                                                                                                               as the nation continues to grapple with the ongoing crisis?

                                                                                                                               PYMNTS has been tracking the pandemic’s impact on the SMBs of Main Street
                                                                                                                               U.S.A. since the very beginning, fielding our first survey on March 24, 2020. In our
                                                                                                                               latest research, we surveyed more than 2,700 Main Street SMBs from across 28
                                                                                                                               industries to get a firsthand account of how they have adapted their operations to
                                                                                                                               weather the rapidly shifting economic tides and which tactics they have adopted
                                                                                                                               to help keep them afloat, even in the face of unprecedented economic uncertainty.

                                                                                                                               This is what we learned.

                                                                                                                               1 Author unknown. About COVID-19 restrictions. California All. 2021. https://covid19.ca.gov/stay-home-except-for-essential-needs/. Accessed March
                                                                                                                               2021.

                                                                                                                                                                                                                                                                © 2021 PYMNTS.com All Rights Reserved
2021’s Main Street Business Survivor | 04
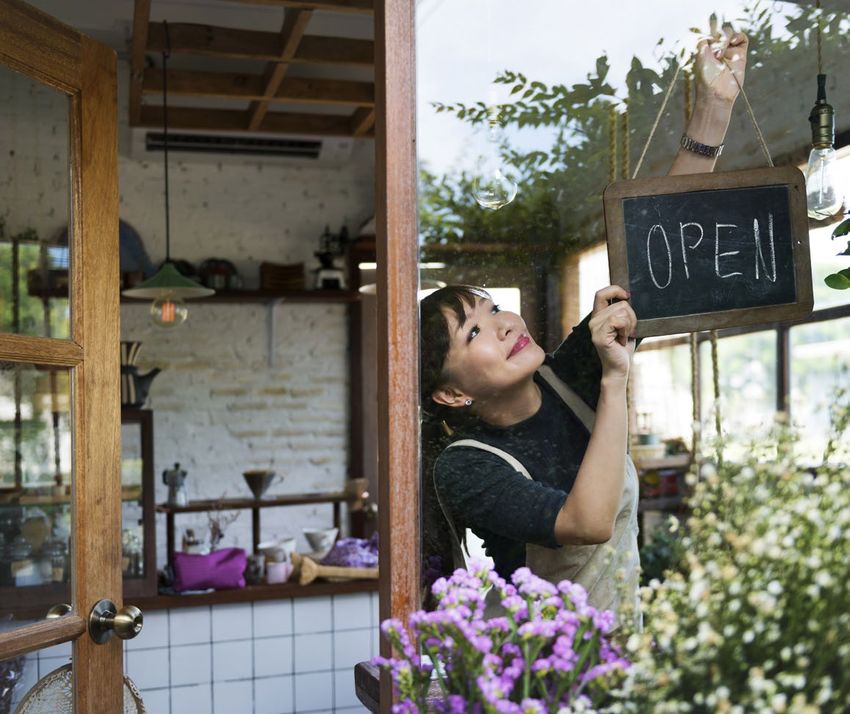
PART I: DRIVING SALES
One-third of all Main Street Survivors now sell on digital FIGURE 1:
WHERE MAIN STREET SURVIVORS GENERATE THEIR SALES2
platforms and marketplaces. Digital channels are 1A: Share with sales that are are generated via select purchasing channels
1B: Share that have experienced select changes in their revenue streams since the pandemic began
the biggest driver of sales growth for the Main Street
Survivors that use them. In my physical store/in person with the costumer Physical
61.4% 61.9% 0000000000
22.2% 0000000000
15.8% 0000000000
Online via our own website
Online sales have become integral to many Main Street Survivors’ businesses, 58.6%
Online via own website
whether they are made on SMBs’ own websites or via third-party digital platforms. 33.1% 0000000000
Online via third-party marketplace or aggregator
23.0% 0000000000
Fifty-nine percent of all Main Street Survivors now generate at least some of their 32.8% 43.9% 0000000000
sales on their websites and 33 percent generate them on digital marketplaces or Via telephone Marketplace or aggregator
32.1% 28.7% 0000000000
third-party aggregators. Brick-and-mortar stores are still the most common way 24.3% 0000000000
47.0% 0000000000
Main Street Survivors generate sales, however, as 61 percent do so. Only 15 percent Other
7.9%
of Main Street Survivors generate all their sales online, and they may operate out Telephone
34.3% 0000000000
of physical locations on Main Street but only accept online orders for delivery or 0% 20% 40% 60% 80%
28.1%
37.6%
0000000000
0000000000
in-person pickup. Source: PYMNTS.com Lower
About the same
Most Main Street Survivors rely on multiple channels to generate sales, but digital Higher
platforms stand out the most. Forty-seven percent of the Main Street Survivors Source: PYMNTS.com
that sell via digital platforms say those sales have increased since the pandemic
began. Website sales are in second place, with 44 percent of Main Street Survivors
saying the sales made on their websites have grown since the pandemic began.
Brick-and-mortar sales have unsurprisingly been the slowest in terms of growth,
with only 16 percent of Main Street Survivors saying their brick-and-mortar sales
are up compared to their pre-pandemic levels. Sixty-two percent of them have
witnessed their brick-and-mortar sales decrease in that time.
2
In Figure 1, the label “other” refers to Main Street SMBs that generate sales over the phone in addition to selling items online or in store. The label can also refer to Main Street SMBs that use rarer
purchasing channels, with the most common being door-to-door sales.
© 2021 PYMNTS.com All Rights Reserved
2021’s Main Street Business Survivor           |       06

                              PART I: DRIVING SALES

     Main Street Survivors have adapted their product                                    FIGURE 2:
                                                                                         HOW MAIN STREET SMBs HAVE SOUGHT TO BOOST THEIR SALES DURING THE PANDEMIC
  offerings to meet consumer demand. Those that opted                                    2A: Share that have taken select actions to increase sales
                                                                                         2B: Share that have taken select actions to increase sales, by risk of closure
 to compete by lowering their prices are at higher risk of
                  going out of business.
                                                                                                   Started advertising on marketplaces                                             Started advertising on marketplaces
                                                                                           37.9%                                                                          40.5%
                                                                                                                                                                          34.8%
                                                                                                                                                                                   Lowered prices
The Main Street SMBs that have managed to stay in business have adapted their                      Lowered prices
                                                                                          35.8%                                                                           31.4%
approaches to market to sell their products and sidestep any potential cash flow                                                                                           41.1%

                                                                                                   Changed products sold to sell high-demand items                                 Changed products sold to sell high-demand items
crunches. Fifty-two percent began advertising or selling on digital marketplaces          33.3%                                                                           36.3%
                                                                                                                                                                          29.6%
during the last year: 38 percent started to advertise on digital marketplaces to
                                                                                                   Changed products sold to be considered essential business                       Changed products sold to be considered essential business
boost their sales and 31 percent began selling on digital marketplaces.                   29.0%                                                                           32.4%
                                                                                                                                                                          24.9%

The second-most common strategy to drive sales has been to switch up product               27.4%
                                                                                                   Started selling on marketplaces                                                 Started selling on marketplaces
                                                                                                                                                                          31.0%
offerings. Fifty-one percent of all Main Street Survivors now sell entirely different                                                                                     22.9%
                                                                                                   Other                                                                           Other
products than they did before the pandemic began. Thirty-three percent have                10.7%                                                                          10.5%
                                                                                                                                                                           11.1%
switched to selling products they feel are in higher demand, hoping that doing so
will convince more consumers to buy them. We also found that 29 percent of Main                    0%               10%              20%         30%             40%           0%                      20%                   40%                       60%

Street Survivors that have switched now sell products that can help them qualify                                                                     Source: PYMNTS.com              Not at risk

as “essential” businesses, allowing them to stay open in the face of regulations that
                                                                                                                                                                                     At risk

call for the closure of all “nonessential” businesses.
                                                                                                                                                                                                                                      Source: PYMNTS.com

The third-most common approach that Main Street Survivors have employed to
drive sales is to lower their prices in the hopes that consumers will be more likely
to buy their products if they are cheaper. Thirty-six percent of the Main Street
SMBs that are still in businesses sell their products at lower prices now than they
did before the pandemic began for just this reason.

Our research suggests that Main Street Survivors that use lower prices to drive
sales are on shakier financial footing than the rest. Forty-one percent of Main
Street Survivors that have lowered their prices to boost sales are at risk of closing,
whereas just 31 percent that are not at risk of closing did the same.

                                                                                                                                                                                                                     © 2021 PYMNTS.com All Rights Reserved
07 | Introduction 2021’s Main Street Business Survivor | 08
PART I: DRIVING SALES
Main Street Survivors in the services sector are using FIGURE 3:
HOW MAIN STREET SMBs IN DIFFERENT INDUSTRIES HAVE
digital platforms to advertise and promote their services. SOUGHT TO BOOST THEIR SALES DURING THE PANDEMIC
Share that have taken select actions to increase sales, by
Those in the manufacturing sector have adjusted their industry
product mix to be considered essential businesses. Started advertising on marketplaces
46.3%
40.0%
30.2%
37.8%
33.3%
Main Street Survivors’ strategies for boosting sales vary depending on the type of
Lowered prices
products and services they sell. Those in the services industry, including construc-
38.9%
tion and retail trade businesses, are among the most likely to use digital platforms 40.0%
30.2%
to promote their businesses. Forty-six percent of Main Street Survivors in the con- 40.5%
16.7%
struction and contracting industry have started advertising on digital marketplaces
Changed products sold to sell high-demand items
and aggregators since the pandemic began, and 24 percent have begun selling 25.9%
45.3%
products on digital marketplaces and aggregators in that time. Our research also 37.2%
39.2%
found that 38 percent of Main Street Survivors in retail trade began advertising on 13.3%
digital marketplaces and aggregators while 41 percent began selling on digital mar- Changed products sold to be considered essential business
ketplaces and aggregators during the past year. 24.1%
38.7%
41.9%
Main Street Survivors in the technology and manufacturing industries have taken 21.6%
20.0%
a very different approach. They are among the most likely to be selling entirely dif-
Started selling on marketplaces
ferent products than they did before the pandemic began. Some sell products that
24.1%
they feel are more in line with their customers’ demands and some do so because 34.7%
25.6%
they want to be considered essential Forty-five percent of Main Street Survivors 40.5%
30.0%
in the technology industry have switched to offering more high-demand products,
Other
and 42 percent of manufacturing firms have since switched to producing products 11.1%
4.0%
that can help them qualify as essential businesses. 11.6%
12.2%
33.3%
Many Main Street Survivors are taking a less fortuitous strategy of lowering prices
to boost sales. This is especially common among those in the retail trade and 20% 30% 40%
0% 10% 50%
technology industries: 41 percent and 40 percent of these firms have lowered their
Construction or contracting
prices to drive sales since the pandemic began, respectively, but evidence sug- Technology
gests that lowering prices is linked to lower financial stability. Manufacturing
Retail trade
Professional services
Source: PYMNTS.com
© 2021 PYMNTS.com All Rights Reserved09 | Introduction 2021’s Main Street Business Survivor | 10
PART II: MANAGING COSTS
Main Street Survivors are taking steps to improve the 29.7%
I relied on my personal financial assets to cover cash flow gaps FIGURE 4:
HOW MAIN STREET SURVIVORS ARE MITIGATING
efficiency of their operations and preserve cash by 24.7%
PANDEMIC-RELATED FINANCIAL FALLOUT
I applied for a loan under the Paycheck Protection Program Share that have taken select protective measures during the
replacing full-time workers with temporary staff and 21.4%
15.9%
past three months versus in the year since the pandemic
began
renegotiating rent and vendor payments. I reduced payroll by cutting staff
Since the pandemic began
18.0%
16.4% During the last 3 months
I temporarily closed my business Source: PYMNTS.com
16.4%
Main Street SMBs that have managed to stay in business have numerous ways 13.7%
of keeping their spending in check, with the most common being using personal I reduced payroll by cutting salaries
funds to supplement their businesses’ cash flows. Thirty percent of all Main Street 14.8%
14.4%
Survivor business owners report having used their own money to support their I applied for a regular Small Business Administration loan
businesses since the pandemic began. This practice has grown less common in 14.8%
16.0%
the past three months, however, with 25 percent of owners reporting doing so in I reduced payroll by hiring temporary workers instead of full-time
employees
that time frame.
14.8%
15.3%
Business owners are not the only ones bearing the brunt of the pandemic’s financial I negotiated a lower rent
impact, either. Many of their employees are also feeling the sting of the mid-pan- 14.2%
16.0%
demic cash flow crunch. Eighteen percent of Main Street Survivor business owners I closed my physical location and operated out of my home
have cut their full-time staff and 15 percent have lowered their workers’ salaries. 12.6%
14.2%
Both of these practices have grown less common in the last three months, but I hired temporary workers
that is partly because many Main Street Survivors have less full-time and more 11.2%
15.9%
part-time workers. I hired gig workers
10.8%
Main Street Survivors are now hiring more temporary workers than they had in the 10.3%
I did not pay monthly bills
year since shutdowns began. Sixteen percent of business owners hired temporary 6.7%
workers in the last three months — up from the average 11 percent who did so 7.4%
during the year prior to the pandemic. Fifteen percent have specifically reduced I did not pay rent
5.9%
full-time staff to hire temporary workers instead. This strongly suggests that Main 5.4%
Street Survivors will continue to favor temporary workers over full-time employees I did not pay suppliers
3.8%
going forward. 7.0%
Other
1.6%
1.6%
I did not take any action because my business was not impacted
13.0%
16.6%
0% 10% 20% 30% 40%
© 2021 PYMNTS.com All Rights Reserved11 | Introduction 2021’s Main Street Business Survivor | 12
PART II: MANAGING COSTS
Nearly eight in 10 Main Street Survivors chose not to apply of this size have not applied in the last three months because they feel they are financially
for Paycheck Protection Program (PPP) loans in the last stable enough to not need PPP loans. In comparison, 14 percent of Main Street Survivors that
generate less than $500,000 in annual revenue that did not apply in this time frame say the
three months. Many of the smallest Main Street SMBs that
same.
have not applied in the last three months said they laid off
It should perhaps come as no surprise that many of these businesses feel they are at less risk
their employees instead.
of going out of business. Twenty-seven percent of all Main Street Survivors that feel they are
not at risk of closing in the near future have enough cash available to keep them open in case
of emergency — three times as many that say they are at risk of going out of business. These
PPP loans can provide financial support to Main Street Survivors struggling to make businesses report having enough funding on hand to remain operational for an average of 75
ends meet, but the second round of PPP funding, which was rolled out in January, days in the event of an emergency.
placed tighter restrictions on applications than the first, initially only accepting ap-
plications from businesses that could demonstrate that they had suffered at least This is in stark contrast with Main Street Survivors that have not recently applied for PPP loans
a 25 percent loss in revenue. This resulted in far fewer applications. Only 16 percent because they were worried about tax implications or chose to lay off employees. Those that
of Main Street Survivors report having actually applied for such assistance in the chose to not apply because of tax concerns report having funds to remain open for just 35 days
last three months compared to an average 21 percent that had done so since March while those that chose not to apply because they laid off employees have just 28 days’ worth
2020. The 84 percent of Main Street Survivors that have not applied for PPP loans of funds available.
cite several reasons as to why. Our research shows that 19 percent of Survivors did
not apply for PPP loans in the last three months because they worry about the im-
plications it might have on their future taxes. Another 11 percent are simply unsure
whether they will make enough revenue to return the funds they might receive
from such programs.
There are also many Main Street Survivors — especially smaller ones — that do not
realize PPP loans are available at all. Seventeen percent of all Main Street Survivor
business owners who have not applied for PPP loans in the last three months were
unaware that such loans were available. One of the other reasons Main Street Sur-
vivors did not apply for these loans is that they laid off their staff instead. This is
especially common among those generating less than $500,000 in annual revenue,
14 percent of which opted to lay off their employees instead of applying for a loan.
Not all Main Street Survivors see financial aid as a priority, however. Nine-
teen percent of Main Street Survivor business owners who have not applied for
PPP loans in the last three months feel they do not need the money. This rea-
soning is particularly common among Main Street Survivors that generate more
than $2.5 million in annual revenue. Thirty-one percent of Main Street Survivors
© 2021 PYMNTS.com All Rights Reserved13 | Introduction 2021’s Main Street Business Survivor | 14
FIGURE 5:
WHY SOME MAIN STREET SURVIVORS HAVE NOT APPLIED FOR PPP LOANS
5A: Share citing select reasons for not applying, by annual revenue
5B: Share citing select reasons for not applying, by annual revenue, by risk of closure
5C: Share citing select reasons for not applying, by annual revenue, by average days of liquidity
I did not need the money
I did not need the money I did not need the money
18.6% 26.8% 75.3
30.8% 8.6%
18.4%
I was worried about about future tax implications I was worried about about future tax implications
14.4%
17.1% 34.8
I was worried about about future tax implications 21.0%
18.8% I was not aware that it was available I was not aware that it was available
20.0% 15.2% 52.9
21.5% 19.5%
14.9%
The program was too complicated The program was too complicated
I was not aware that it was available 12.5%
41.2
13.3%
17.1%
10.8% I did not qualify I did not qualify
17.0%
11.3% 68.4
19.3%
13.8%
The program was too complicated I did not trust that I would not have to pay back the money I did not trust that I would not have to pay back the money
12.8% 7.4%
50.0
9.2% 15.7%
14.3%
I laid off employees instead I laid off employees instead
12.7%
7.8% 28.4
I did not qualify 4.8%
Other Other
12.4%
1.9% 47.1
6.2%
10.8% 3.3%
17.1%
0% 20% 40% 60% 0 20 40 60 80
I did not trust that I would not have to pay back the money
Not at risk Source: PYMNTS.com
11.1% Days of revenue
6.2% At risk
9.9%
Source: PYMNTS.com
14.4%
I laid off employees instead
6.4%
13.8%
6.3%
3.9%
Other
2.6%
3.1%
1.8%
3.3%
0% 5% 10% 15% 20% 25% 30% 35%
Sample
2.5M or more
$500K - $2.5M
Less than $500K
Source: PYMNTS.com
© 2021 PYMNTS.com All Rights Reserved15 | Introduction 2021’s Main Street Business Survivor | 16
PART III: LOOKING FORWARD FIGURE 6:
HOW LONG MAIN STREET SURVIVORS BELIEVE IT WILL TAKE BEFORE CONSUMERS FEEL COMFORTABLE
Main Street Survivors are optimistic that consumers will RETURNING TO STORES
How many days the average Main Street Survivor believes will elapse before consumers feel comfortable versus how many
return to the outside world in late fall 2021, even though days the average consumer believes it will take, by date
consumers believe that it will take until February 2022 for MARCH 17 138
Consumers
things to get back to normal. MARCH 24 177 Main Street Survivors
MARCH 27 145
APRIL 6 150
Main Street SMBs continue to be more optimistic about how long the pandemic will
APRIL 11 178
continue to reduce their foot traffic than consumers — and their outlook is growing
APRIL 20 199
rosier. The average Main Street Survivor now believes consumers will feel comfort-
able reengaging in the physical world by late October 2021 — just seven months APRIL 27 213
from now. This is the first time since April 2020 that Main Street Survivors’ expecta- MAY 8 193
tions for how long it will take for the pandemic to subside have improved. MAY 23 270
The trouble is that consumers do not see themselves going back to stores until mid- JUNE 18 218
to late-February 2022. This leaves a roughly four-month gap between the time when JUNE 22 326
Date when SMBs were asked
Main Street Survivors believe their foot traffic will recover and the time when their JULY 17 371
customers expect the pandemic’s impact on their lives to end. It is thus clear that
AUG 10 248
Main Street Survivors’ optimism could lead to more financial woes down the road if
AUG 12 370
they are not careful.
AUG 31 357
SEP 15 385
OCT 01 367
NOV 11 423
NOV 16 385
NOV 18 253
DEC 7 394
JAN 4 388
JAN 22 400
FEB 17 245
M 20
M 20
M 22
O 20
N 20
D 20
S 20
A 20
A 20
M 21
M 21
A 22
J 20
J 20
F 22
J 22
O 21
N 21
D 21
S 21
A 21
A 21
F 21
J 21
J 21
J 21
Date when pandemic is estimated to end
© 2021 PYMNTS.com All Rights Reserved17 | Introduction 2021’s Main Street Business Survivor | 18
PART III: LOOKING FORWARD
Main Street Survivors plan to stick with what works, with FIGURE 7:
HOW MANY MAIN STREET SURVIVORS PLAN TO
three out of four of them planning to keep the digital and KEEP THE CHANGES THEY HAVE MADE DURING
SHUTDOWNS AFTER THE PANDEMIC IS OVER
operational changes made as a result of the pandemic. Share that plan to maintain all, maintain some or get rid of
select changes after the pandemic has passed, by changes
in sales
Reverse to pre-pandemic levels
25.9%
29.2%
Main Street Survivors see the light at the end of the proverbial tunnel when it comes 30.1%
24.3%
to shutdowns, but most have no intention of ever reverting back to “business as 26.8%
29.2%
usual.” Roughly three out of four of them plan to keep at least some of the digital and Mantain some
22.4%
operational changes they have made since shutdowns began. 45.3%
41.7%
44.6%
The most common change that Main Street Survivors plan on keeping is their usage 40.7%
35.4%
of temporary workers, with 76 percent of Main Street Survivors planning to contin-
Mantain at current level
ue using temporary workers at least somewhat as often as they do now after the 51.8%
25.5%
pandemic has subsided. Leveraging digital marketplaces followed this change: 75 28.2%
31.1%
percent of Main Street Survivors anticipate that their increased digital marketplace 32.5%
35.4%
sales will continue long into the future. Many also intend to keep operating with
reduced staff and keep salaries lower than they were prior to the pandemic. 0% 10% 20% 30% 40% 50% 60%
Increased marketplace sales (N = 52)
This new post-pandemic Main Street will likely look very different than it did before Close physical location and operate from home (N = 106)
the pandemic, however. Many of the Main Street SMBs that are still open plan to Lower rent expense (N = 103)
Use temporary workers (N = 148)
reduce their reliance on brick-and-mortar sales. Only 29 percent of Main Street Sur- Reduce staff (N = 123)
vivors’ owners who have begun running their businesses from home plan to reopen Lower salaries (N = 113)
Source: PYMNTS.com
their stores on Main Street as they once did, in fact. The remaining 71 percent plan
to keep operating from home at least somewhat as much as they do now, signaling
that many of the storefronts once lined Main Street U.S.A. may never return.
© 2021 PYMNTS.com All Rights ReservedCONCLUSION
METHODOLOGY
M
any of the small to mid-sized Main Street businesses across PYMNTS issued a survey to 555 SMBs From Feb. 17,
the nation have found resourceful ways to stay afloat — and 2021, to Feb. 23, 2021, for this installment in our Pan-
their successes offer unique insights into how others can denomics survey series, which examines how small
turn around their businesses. These Main Street Survivors U.S. firms are coping with the financial challenges
have made sweeping changes to adapt to rapidly shifting related to the ongoing public health crisis. SMBs in
conditions, investing in digital innovations that can help them reach more our sample hailed from 21 industries, and our analysis
customers while also reforming their financial operations to boost their ef- focused on how they are planning to stay in business
ficiency and resilience. It is impossible to say how many of the SMBs that in the event of a second shutdown period, how the
form the core of the nations’ local economies will make it to the end of the availability of vaccines impacts their future outlooks
crisis, but it is clear that only those that take active measures to reform their and how they believe their operations will change in
operations stand a chance. the post-pandemic future. We have surveyed 2,702
Main Street SMBs to date.
© 2021 PYMNTS.com All Rights Reserved21 | Introduction 2021’s Main Street Business Survivor | 22
DISCLAIMER
The Pandenomics series may be updated periodically. While reasonable efforts are made to
keep the content accurate and up to date, PYMNTS.COM: MAKES NO REPRESENTATIONS OR
WARRANTIES OF ANY KIND, EXPRESS OR IMPLIED, REGARDING THE CORRECTNESS, ACCURA-
CY, COMPLETENESS, ADEQUACY, OR RELIABILITY OF OR THE USE OF OR RESULTS THAT MAY
BE GENERATED FROM THE USE OF THE INFORMATION OR THAT THE CONTENT WILL SATISFY
YOUR REQUIREMENTS OR EXPECTATIONS. THE CONTENT IS PROVIDED “AS IS” AND ON AN “AS
AVAILABLE” BASIS. YOU EXPRESSLY AGREE THAT YOUR USE OF THE CONTENT IS AT YOUR SOLE
RISK. PYMNTS.COM SHALL HAVE NO LIABILITY FOR ANY INTERRUPTIONS IN THE CONTENT THAT
IS PROVIDED AND DISCLAIMS ALL WARRANTIES WITH REGARD TO THE CONTENT, INCLUDING
THE IMPLIED WARRANTIES OF MERCHANTABILITY AND FITNESS FOR A PARTICULAR PURPOSE,
AND NON-INFRINGEMENT AND TITLE. SOME JURISDICTIONS DO NOT ALLOW THE EXCLUSION OF
CERTAIN WARRANTIES, AND, IN SUCH CASES, THE STATED EXCLUSIONS DO NOT APPLY. PYMNTS.
COM RESERVES THE RIGHT AND SHOULD NOT BE LIABLE SHOULD IT EXERCISE ITS RIGHT TO
MODIFY, INTERRUPT, OR DISCONTINUE THE AVAILABILITY OF THE CONTENT OR ANY COMPONENT
OF IT WITH OR WITHOUT NOTICE.
PYMNTS.COM SHALL NOT BE LIABLE FOR ANY DAMAGES WHATSOEVER, AND, IN PARTICULAR,
SHALL NOT BE LIABLE FOR ANY SPECIAL, INDIRECT, CONSEQUENTIAL, OR INCIDENTAL DAMAGES,
OR DAMAGES FOR LOST PROFITS, LOSS OF REVENUE, OR LOSS OF USE, ARISING OUT OF OR
RELATED TO THE CONTENT, WHETHER SUCH DAMAGES ARISE IN CONTRACT, NEGLIGENCE, TORT,
UNDER STATUTE, IN EQUITY, AT LAW, OR OTHERWISE, EVEN IF PYMNTS.COM HAS BEEN ADVISED
OF THE POSSIBILITY OF SUCH DAMAGES.
SOME JURISDICTIONS DO NOT ALLOW FOR THE LIMITATION OR EXCLUSION OF LIABILITY FOR
INCIDENTAL OR CONSEQUENTIAL DAMAGES, AND IN SUCH CASES SOME OF THE ABOVE LIMITA-
TIONS DO NOT APPLY. THE ABOVE DISCLAIMERS AND LIMITATIONS ARE PROVIDED BY PYMNTS.
COM AND ITS PARENTS, AFFILIATED AND RELATED COMPANIES, CONTRACTORS, AND SPON-
SORS, AND EACH OF ITS RESPECTIVE DIRECTORS, OFFICERS, MEMBERS, EMPLOYEES, AGENTS,
CONTENT COMPONENT PROVIDERS, LICENSORS, AND ADVISERS.
Components of the content original to and the compilation produced by PYMNTS.COM is the
property of PYMNTS.COM and cannot be reproduced without its prior written permission.
© 2021 PYMNTS.com All Rights ReservedYou can also read