November 2020 - cloudfront.net

Page created by Zachary Schroeder
 
CONTINUE READING
November 2020 - cloudfront.net
November 2020
November 2020 - cloudfront.net
Forward-Looking Statements

Statements in this presentation that are not historical are considered “forward-looking
statements” and are subject to change based on various factors and uncertainties that may
cause actual results to differ significantly from expectations. Those factors are contained in
Enerpac Tool Group’s Securities and Exchange Commission filings.
All estimates of future performance are as of September 30, 2020. Enerpac Tool Group’s
inclusion of these estimates or targets in the presentation is not an update, confirmation,
affirmation or disavowal of the estimates or targets.
In this presentation certain non-GAAP financial measures may be used. Please see the
supplemental financial schedules at the end of this presentation or accompanying the Q3
Fiscal 2020 earnings press release for a reconciliation to the appropriate GAAP measure.

 2
November 2020 - cloudfront.net
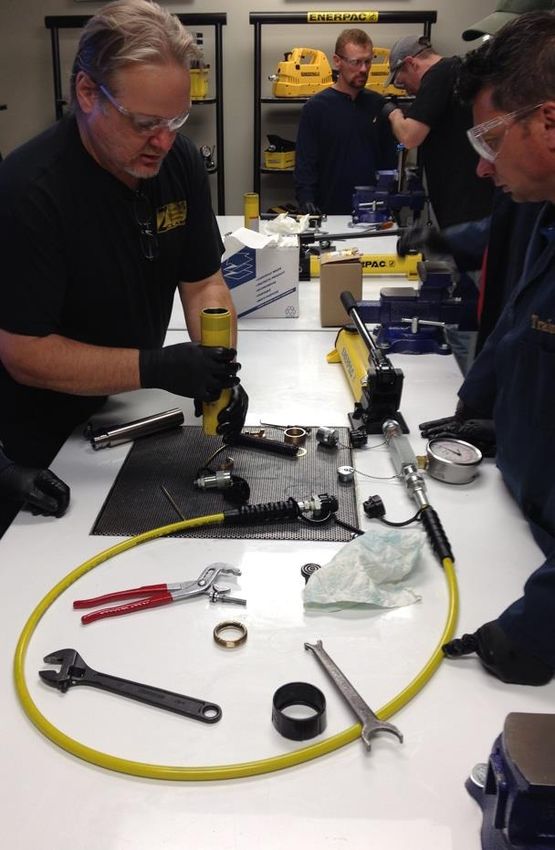
A Global Leader in Industrial Tools and Services

                                                                                                         Global leader in high
110               Menomonee
                  Falls, WI
                                       ~2,300                    100+                  100+              precision tools, controlled
YEARS OF
                  HEADQUARTERS
                                       EMPLOYEES                 MANAGEMENT TEAM       # OF COUNTRIES    force products and
                                                                                                         solutions for precise heavy
HISTORY                                                          YEARS EXPERIENCE      PRODUCTS SOLD
                                                                                       INTO
                                                                                                         lifting.

    Products                   Service and             Extensive Global             Diversified
                               Rental                  Distribution                 Customer Base
    Cylinders/Jacks,
    Pumps, Bolting tools,      Bolting,                1,500+ long-standing         Specialty Dealers
    Presses, Pullers,          machining and           distribution relationships
    Tools, Heavy Lifting       joint integrity                                      National
    Technology                                         3,500+ distributor           Distribution
                                                       locations
                                                                                    Large OEMs

    STRONG
    BRAND                   Premium Industrial Tools         Service                  Medical
    RECOGNITION             Heavy Lifting                    Rental                   Industrial Ropes
                                                             Training

3
November 2020 - cloudfront.net
Positioned to Deliver Long-Term Value

    Sustainable business model
    built on well recognized brands, robust global
    distribution and broad reach of end markets

    Clear strategy
    to drive core growth above market and expand     BEST IN
    margins
                                                     CLASS
                                                     RETURNS
    Disciplined capital deployment
    powered by strong balance sheet and free cash
    flow conversion

    Experienced leadership team
    capable of executing to win

4
November 2020 - cloudfront.net
Delivering Profitable Growth

NET SALES                                                                 ADJUSTED OPERATING PROFIT
 $660                                                  $655               $100
                                                                                                                                 $78
 $650                              $641                                    $80                               $65
 $640
                                                                           $60
 $630                                                                                    $43
               $617
 $620                                                                      $40
 $610                                                                      $20
 $600
 $590                                                                      $-
              2017                2018                2019                              2017                2018                 2019

ADJUSTED EBITDA MARGIN                                                    RETURN ON INVESTED CAPITAL
 16%                                                  15%                   16%
                                                                                                                                  14%
 14%                              13%                                       14%
 12%                                                                        12%                               11%
              10%
 10%                                                                        10%
                                                                                          8%
     8%                                                                         8%
     6%                                                                         6%
     4%                                                                         4%
     2%                                                                         2%
     0%                                                                         0%
              2017                2018                2019                               2017                 2018                2019

 5        Note: Fiscal 2020 is not included above as results are not representative of the business due to impact of COVID-19. We anticipate to
          return to normal growth patterns post COVID.
November 2020 - cloudfront.net
Macro Industry Dynamics Support Growth

       Growth in Alternative Energy                                 Increasing Product Complexity

Products and services span multiple alternative markets        Products are high precision matched to the increasing
including nuclear, wind, oil & gas                             standards and tolerances.
Mission critical tools are required for difficult conditions   The right tool makes all the difference when precision
                                                               and safety are of the highest importance

            Infrastructure Demand                                           Growth in Aerospace

Heavy lifting technology provides reliable solutions to        Tools are used throughout the Aerospace industry for
match challenging infrastructure demands                       the building and on-going maintenance and repair of jet
                                                               engines
Aging infrastructure demands products to safely build
and repair infrastructure across the globe                     Highest reliability and precision in critical functions

6
November 2020 - cloudfront.net
Broad Global End Markets

    13 VERTICAL END MARKETS

    Civil Construction   Power Gen        Diverse verticals provide
                         & Utility        reduced cyclicality and
                         Off-Hwy          increased predictability
    Oil & Gas
                         Vehicle Repair

    Industrial MRO       On Hwy
                         Vehicle Repair
    Manufacturing
    and Machine          Paper/Wood
    Tools
                         Military
    Mining

                         Steel & Metal
    Aerospace

    Rescue

7
November 2020 - cloudfront.net
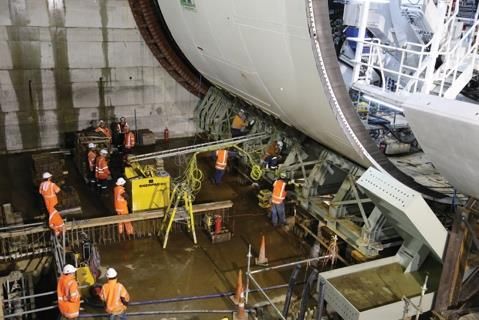
Wide Array of Products

                                                       Heavy Lift
            Bolting              Cylinders                             Presses

    Pumps             Work Holding           Pullers       Spreaders     Cutters

8
November 2020 - cloudfront.net
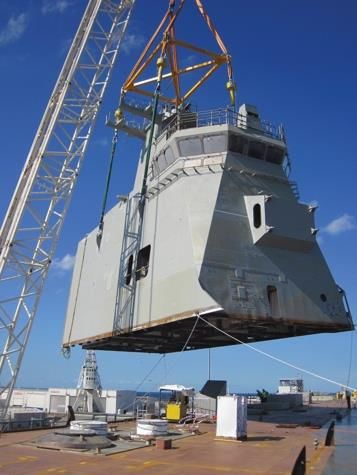
Serving a Wide Variety of Geographic Regions

Enerpac Tools and Services
benefit from having a diverse
geographic customer base
                                                          37%
                                                                                      Geographic
                                                                      United States
                 Australia                                                            diversification of sales
                                                                                      reduces overall
                                     4%
        Mexico/Canada                                                                 exposure to regional
                                4%                                                    economic downturns
        South America                            Sales of
                                                $493m in
                                4%

                                4%             Fiscal 2020
                 Other

                                     11%                        24%

                         Asia                                            Europe
                                                    12%

                                      Middle East

9
November 2020 - cloudfront.net
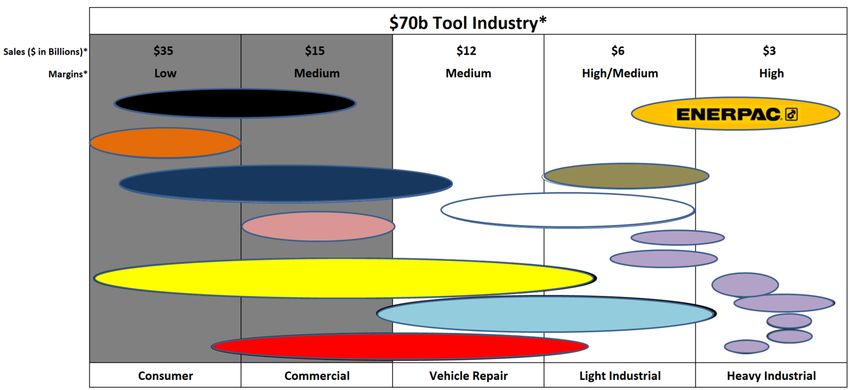
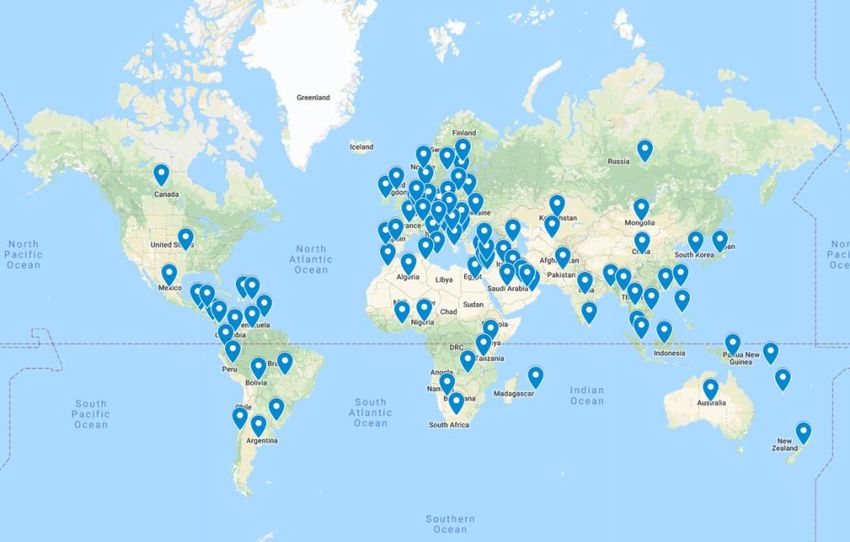
Extensive Global Footprint

                                                                                           Our Global Footprint Allows
                                                                                           Us To Better Serve Our
                                                                                           Customers and Shareholders

                                                                                           • Producing near our
                                                                                             customers leads to a
                                                                                             quicker response time
                                                                                           • Understanding local
                                                                                             market needs and demand
                                                                                           • Some projects require in-
                                                                                             country production
                                                                                           • Low cost country
                                                                                             manufacturing/sourcing
                                                                                             drives competitive margins

 Corporate Headquarters   Manufacturing Location   Enerpac Tool Center   Service Center and/or Sales
                                                                         Office

10
Extensive Global Distribution

                                             Global Distribution Network
                                             is a competitive advantage

                                             • Most robust distribution
                                               network in the
   1500+            3500+          100+        competitive space
distributors    points of sale   countries   • Application experts with
                                               hands-on product
                                               demonstrations
                                             • Local access to world-
                                               class tools quickly and
                                               conveniently
                                             • Buy or rent the right tools
                                               when & where you need
                                               them
                                             • Ability to support Global
                                               customers
                                               in all regions

11
Clear Value Creation Model – 5 Year Vision

         CORE GROWTH ABOVE MARKET                                                DRIVING EFFICIENCY AND PROFITABILITY

         ~5%      CORE GROWTH CAGR OR                                            ~25%       EBITDA MARGINS

         200-300bps               CORE SALES GROWTH > MARKET                     ▪   35%-45% incremental             ▪    Completion of service &
                                                                                     margins                              product line restructuring
         ▪   Product innovation               ▪   Commercial effectiveness                                                exits
                                                  & share capture                ▪   Optimized manufacturing
         ▪   Expand industries and                                                   footprint                       ▪    Strategic sourcing
             regions                          ▪   Incremental growth
                                                  through strategic M&A          ▪   Structural cost reduction       ▪    Proprietary products

         STRONG CASH FLOW GENERATION                                             BEST-IN-CLASS RETURNS AND DISCIPLINED
                                                                                 CAPITAL DEPLOYMENT
         +100%         FCF CONVERSION = FUEL FOR GROWTH
                                                                                 ~20% RETURN ON INVESTED CAPITAL
     ▪   Margin expansion                 ▪   Drive working capital          ▪   Organic growth: products,       ▪       Debt reduction; maintain
                                              velocity                           services & people                       strong balance sheet
     ▪   Low capital intensity
         (Capex ~2% of sales)                                                ▪   Strategic acquisitions          ▪       Leverage target of
                                                                                                                         1.5x – 2.5x
                                                                             ▪   Opportunistic share
                                                                                 repurchases

12
Driving Organic Growth: New Product Development

NEW PRODUCT DEVELOPMENT                                NEW PRODUCT SALES                                                  NEW PRODUCT VITALITY
▪     Focusing on innovation through Centers
      of Excellence (CoE) and Vertical Market                                                                                FY15            FY19   FY20           FY21+
      teams                                                                                                                  3.5%             7%    10%            10+%

▪     Bringing new products to market faster

▪     Improving utilization of resources
      between CoE’s, supply chain and regions                                                                              Investment in NPD which began in FY’16
      to drive launch execution                                                                                            has driven acceleration in new products as a
                                                                                                                           percent of sales

                                                          FY15   FY16   FY17   FY18   FY19   FY20   FY21   FY22   FY23

    E-Pulse Hydraulic Pump   New Self Locking Cube   XC-Torque Wrench Pump                   Clamshell Cutters           RSL Torque Wrench          Lock-Grip Pullers
                             Jack

    13
Driving Organic Growth: Commercial Effectiveness

CHANNEL DEVELOPMENT                                        COVERAGE
▪    Leveraging new products through entire channel        ▪       Increasing distributor support from Product
     footprint and owned service centers                           specialists and Vertical Market teams

▪    Strengthening distributor relationship via expanded   ▪       Expanding key / national account coverage
     product offerings                                             combining Enerpac and Hydratight relationships

▪    Offering Enhanced Distributor programming for new
     products

EXPANDED NETWORK OF VALUE                                      ENERPAC TOOL CENTERS
ADDED DISTRIBUTORS
                                                               ▪   Opened pilot ENERPAC Tool Center with launch in
▪    Enhancing distributor capabilities and coverage               Deer Park, TX

                                                               ▪   Selling and renting more through existing network of
                                                                   Service Centers

                                                               ▪   Enhances distribution coverage

                                                               ▪   Drives additional rental of Enerpac tools

    14
Driving Operational Excellence

                                                                              Philosophy of continuous
                                                                              improvement
     Opportunity to                   Manufacturing Excellence
     Drive Profitability
                                      ▪       Facilities/locations
     •   Enhancing EBITDA growth
         through operational          ▪       Employing lean techniques and
         improvements                         continuous operational
                                              improvements/SQDC
                                      ▪       Optimized manufacturing,
                                              service and distribution

     Value Added Service                  Strategic Sourcing &
     ▪   Focus on value-add               Supply Chain
         service – joint integrity,       ▪    Proven competency of
         custom machining,                     leveraging global supply
         bolting                               chain
     ▪   Eliminating commodity            ▪    Sales & operations
         service creates profit                planning (S&OP)
         improvement
15
Incremental Growth - Disciplined M&A Strategy

                                                                                                     Investing in strategic
                                                                                                     acquisitions through a
                                                                                                     disciplined process to
                                                                                                     capture new growth
                                                                                                     opportunities

DISCIPLINED                      DRIVING GROWTH                     STRONG
STRATEGY                         THROUGH M&A                        BALANCE SHEET
▪    Targeting bolt-on and       ▪   Goal is to become larger,      ▪   Will maintain strong
     strategic acquisitions of       more meaningful provider           financial position
     small to mid-sized
     companies                   ▪   Any acquisition must           ▪   Current liquidity gives us
                                     support the extension of           ample capacity between
▪    Any target must meet            product lines and/or provide       our cash on hand,
     our financial and               technology, which gives            existing credit facilities
     operational criteria            Enerpac a competitive              and access to debt
                                     advantage                          markets
▪    Margins in line with
     Enerpac line average

    16
Significant Market Opportunity

Enerpac Today*                                                     Tool Industry Market*
Strong Market Position in Key Segments                             Targeting Growth in High Margin Segments

                                      Heavy Industrial
                                                          Heavy Industrial
                                                          Sales: $3B
                                                                                                                Consumer
                                                          Margins: 50%+
                                                                                                                Sales: $15B

                                                         Light Industrial             $70B Tool                 Margins: 45%

                                                         Sales:   $6B                  Industry
                                      Light Industrial   Margins: 45%+

                                                         Vehicle Repair                                       Commercial

                                                          Sales: $12B                                         Sales: $35B
                                                                                                              Margins: 40%
                                                          Margins: 45%+

     *Based on management estimates
17
Tools Industry — Consumer to Heavy Industrial

18    * Based on management estimates
Tools Industry – Consumer to Heavy Industrial

  19
People & Culture

OUR VISION                                       OUR VALUES
Is to be our customers’ preferred partner        ▪ We put safety and integrity first
through relentless innovation of industrial      ▪ We focus on our customers
tools and services that help them safely and
reliably tackle their toughest jobs around the   ▪ We work collaboratively
world.                                           ▪ We deliver on our commitments
                                                 ▪ We support our employees and
                                                   communities

OUR PEOPLE
Our talented teams across the globe are
our most valuable asset. We recognize
their hard work and dedication to make
Enerpac Tool Group what it is today. We
are focused on employee development and
retention of our talent.

  20
Appendix
COVID-19 – Executing on Key Priorities
     Employee Safety is #1 Concern
     ▪ Plants are operating with additional safety measures in place
     ▪ Non-production personnel have started to return to the office with some still working from home
     ▪ Travel is slowly returning to customer/project sites
     Cost Control Measures
     ▪ Temporary/COVID-19 related measures generating ~$9M in savings in fourth quarter
     ▪ Permanent cost measures – actions announced in March 2019 and 2020 accelerated to eliminate ~$33 million of
       structural and redundant costs post EC&S divestiture (as announced in the third quarter)
     ▪ Enerpac footprint rationalization in process
     Employee Engagement
     ▪ Weekly global safety briefings
     ▪ Bi-weekly global communications
     ▪ Continue to support the communities in which we live
     Operational Preparedness
     ▪ Will follow guidelines from local governments related to maintaining safe work environments
22   ▪ Preserving our ability to capitalize on a market recovery
Market Update
     Product Order Rates
     ▪  Overall order rates improved in Q4 but continued to be volatile with August 2019 being a tough
        comparable, with IT&S product core sales declines improving sequentially to 20% from 36% in
        Q3

                                                                                 Top Graph - IT&S standard
                                                                                 product orders in actual
                                                                                 dollars; demonstrates that
                                                                                 order dollars are trending
                                                                                 positively.

                                                                                 Bottom graph - The year-
                                                                                 over-year % change of IT&S
                                                                                 standard product orders.

     Services
     ▪  Spending on maintenance and tools has been very conservative but starting to see
23      service projects pick up
Fourth Quarter 2020 Summary
       Financials
        ▪   Sales: $111M
        ▪   Adjusted EPS: $0.02
        ▪   Core sales decline of 27% (Product down 23% and Service down 45%)
        ▪   Free Cash Flow: $10M of cash compared to $50M in the comparable prior
            year period
        ▪   Leverage of 1.8x
        ▪   Temporary cost actions provided ~ $9M in benefits in the quarter
        ▪   Adjusted EBITDA decremental margins of 28%, an improvement over our
            target range of 35-45%

        Regional Core Sales Declines
        ▪   Europe: ~mid teens%
        ▪   Americas: ~mid 20%
        ▪   Asia Pacific: ~low 30%
24      ▪   Middle East: ~high 30%
Strategy Progress

     Invest in Ourselves - Organic Growth
     ▪ New Product Development
           Q4
           ▪ 6 new product families
           ▪ New products as a percent of product sales +10%
           Full year
           ▪ 22 new product families and over 370 new tools
           ▪ +10% of product sales from new products
     ▪   Commercial effectiveness
           ▪ Ensuring strong coverage for both our distributors and customers
           ▪ Focusing commercial and marketing support on virtual training, e-
             commerce and digital marketing

     M&A
     ▪ Continues to be an important part of the strategy but waiting for market
         conditions to stabilize

25
Regional/Vertical Markets – IT&S Products
       Americas / Europe
       ▪ Sequential month on month improvement as the quarter progressed with Europe’s recovery ahead of the Americas
       ▪ Solid quarter for our HLT sales especially in Europe
       ▪ Significant marketing activity focused on both retail and wholesale campaigns
       ▪ Key Verticals
              ▪   Positive trends continued in Power Generation (Wind/Nuclear), Construction, Rail and Aero (non-commercial)
              ▪   During the quarter, continued to be challenged in O&G and Infrastructure
              ▪   Late Q4/early Q1 - emerging signs of activity in Mining (copper and iron ore)
       ▪   Distribution
              ▪   Distributors shifted focus to PPE and other inventory that sold well during the pandemic to generate cash flow
              ▪   Difference in rate of recovery among distributor types
              ▪   Drop ship activity remains high while distributors are working off inventories and waiting for more clarity in a recovery. We
                  believe inventory levels are low and we see some willingness to selectively take on stocking packages
              ▪   Normal year end motivation for distributors to take on inventory did not take place (volume/marketing) which drove a portion
                  of the sales shortfall

       Asia Pacific
       ▪ Excluding China, the region was impacted by trend of easing/tightening of restrictions due to COVID-19 infection levels.
         Expect improving trends in upcoming months as travel restrictions are eased
       ▪ China continues to improve with sales near prior year levels

  26
Service and Operations

      Service
      ▪ Service continued to be challenged during the quarter with projects put on hold or pushed out into Q1
      ▪ Generally a slow quarter in the Middle East due to summer heat but COVID-19 contributed to further
        challenges with borders closed
      ▪ Europe saw sequential improvement from Q3 but continued to be down vs prior year
      ▪ We have begun to see some restarts of jobs put on hold due to COVID-19 as well as emergent work
        to spend budgets before the end of the calendar year

      Operations
      ▪ Safety performance continues to be world class and we ended fiscal 2020 with the majority of our
        sites at zero harm
      ▪ Our teams around the world did a great job managing variable spend to match lower demand
      ▪ We saw meaningful reductions in inventory levels while continuing to meet our customers’ lead time
        demands

 27
Fourth Quarter 2020 Comparable Results
                                                                                      NET SALES*
 (US$ in millions except EPS)

        $158                                                                          •       Core sales decreased 27% - product -23% and service -45%
                                                                                              • IT&S product sales -20%
                                                      14.8%
                                                                                                  • Heavily impacted by COVID-19 pandemic
                              $111                                                                • Rate of decrease improved from -36% in Q3
                  $102                                                         9.4%
                                                                                              • Other product -39%
                                                                    6.5%
                                                                                      •       New Product Development (NPD) – 6 new products families launched
                                                                                                   • NPD % of product sales >10% for the 4th consecutive quarter
                                                                                      •       Strategic exits ~$9M
     Q4 2019 Q3 2020 Q4 2020                         Q4 2019 Q3 2020 Q4 2020
                                                                                      •       HTL acquisition ~$2M
                Net Sales*                             Adjusted EBITDA %*

                                                                                      ADJUSTED EBITDA*
     12.1%                                                                            •       Decremental margins of ~28%

                                                     $0.21                                ADJUSTED OPERATING PROFIT*
                                4.2%                                                      •   Year-over-year decline due to significantly reduced volume
                   0.1%
                                                                 -$0.06      $0.02
                                                                                      ADJUSTED DILUTED EPS*
    Q4 2019 Q3 2020 Q4 2020                        Q4 2019 Q3 2020 Q4 2020
                                                                                      •       Year-over-year decline as the result of significantly reduced
  Adjusted Operating Profit %*                       Adjusted Diluted EPS*                    volume due to COVID-19
        *Adjusted Operating Margin, EBITDA Margin and EPS excludes
        restructuring, impairment and other charges identified in the accompanying
        reconciliations to GAAP measures. In addition, see reconciliation of net
   28   sales to core sales in the appendix.
Net Sales Waterfall*
(US$ in millions)
        $165

        $160                            $0.1

        $155          $158.3                              $8.6

        $150

        $145                                                             $149.6     $26.8                                        Planned strategic exits, the
                                                                                                                                 impact of the COVID-19
        $140                                                                                                                     pandemic, and the sharp
                                                                                                                                 drop in Oil & Gas prices
        $135                                                                                                                     resulted in lower sales year-
        $130                                                                                                                     over-year

        $125

        $120                                                                                   $13.9
        $115

        $110                                                                                               $2.5
                                                                                                                     $111.4
        $105

        $100

         $95
                    Q4 FY19 Net     Fx                 Strategic        Q4 FY19    Volume -   Volume -   HTL Group Q4 FY20 Net
                       Sales    Translation              Exits          Adj. Net   Product    Service    Acquisition  Sales
       29                                                                Sales
            * See the reconciliation of net sales to core sales in the appendix.
Adjusted EBITDA Waterfall*
(US$ in millions)

$40

$35
                                                                      $4.4          $15.2                                                       Adjusted EBITDA
                                                                                                                                                decreased year-over-year
$30
                                                       $9.2                                                                                     primarily due to
                                                                                                                                                COVID-19 product/
$25                                                                                                                                             service volume
                          $1.8                                                                                                                  decreases, partially offset
          $23.4                                                                                                                                 by restructuring and other
$20                                     $21.6
               12.3%                                                                                 $5.7                             13.3%     cost savings initiatives
                                                                                                                                                resulting in decremental
$15                                                                                                                                             EBITDA margins of 28%,
                                                                                                                   $6.7                         an improvement over our
$10                                                                                                                                             target range of 35-45%
                                                                                                                              $2.8
                                                                                                                                       $10.4
$5

$0
         Q4 FY19     Fx Translation Q4 FY19 Adj.     COVID-19     Restructuring    Volume -       Volume -    Mfg Variances   Other   Q4 FY20
         EBITDA                       EBITDA         Initatives     Savings        Product         Service                            EBITDA

         30
   * Includes certain Non-GAAP financial measures. See the accompanying reconciliation tables for additional details.
EBITDA Margin Expansion – Controlling What We Can Control
                            Fiscal 2019                                   Fiscal 2020                                  Fiscal 2021-2024+ (assuming normal conditions)

                                                                                                                                          Incremental Profit         EBITDA   ~25%
                                                                                                                                                 Incremental Profit on
                                                                                                                                              on Growth
                                                                                                                                               Growth
                                                                                                         Footprint Optimization           ~275-325bps*           ▪   Based on structural
 Strategic Vision

                                                                                                                                                                     actions taken and when
                                                                                    Structural             ~150-200bps*
                                                                                  Cost Reduction                                                                     markets return to
                                                                                                                                      ▪    Profitability on
                                                                                                                                            Incremental Profit
                                                                                                                                           incremental product
                                                                                                                                                                     growth, positioned to
                                                                                                       ✓ Cortland plant                                              generate EBITDA
                                                                                  ~200-300bps*           consolidation                      on Growth
                                                                                                                                           sales  from 35-45%
                                                                                                                                                                     margins of 25% or
                                                                                                       ▪ Enerpac plant                ▪    Focus on value            better.
                                                                              ✓ Eliminate EC&S                                 ~$5M
                                                                                                                                           added service and
                                                                                                   ~$3M  optimization
                                                                                stranded costs                                             rental
                                                      ~200-300bps*
                                                                              ✓ Redundancy in segment                                 ▪    Growth from market
                                                                                vs corporate costs
                                                   ✓ Enerpac/Hydratight                                   ~$10M                            and NPD
                                                     Consolidation            ✓ Reduced third party
                                                                                support costs                                                                         Impacted by
                              EBITDA ~15%                                                                                                                              COVID-19

                                                                                             Cost structure progression in Fiscal 2020
 Actions to Date

                                                           $15M                      $13M                            $5M                                $33M Structural Cost Out
                                                  ✓ Enerpac/Hydratight       ✓ Eliminate redundancies       ✓ Cortland plant
                                                                                                                                                           ✓ Operational structure
                                                    restructuring            ✓ Eliminate EC&S stranded        consolidation
                                                                                                                                                             positioned for growth
                                                                               costs

                    31   *based on 2019 Adjusted Revenue and EBITDA
Liquidity – Positioning for Success
(US$ in millions)

             $50                                                              $460
                                            $211
                                                                                                                        1.8      1.8
                                                      $164                                                      1.7
                                                                  $152                  $286
                                                                                                  $255

                         $11         $10

        Q4 2019 Q3 2020 Q4 2020            Q4 2019 Q3 2020 Q4 2020           Q4 2019 Q3 2020 Q4 2020         Q4 2019 Q3 2020 Q4 2020
                    Free Cash Flow                 Cash Balance                      Gross Debt                  TTM Financial Leverage

   Cash Preservation                                                     Capital Structure
   • Significantly reduced Working Capital in the quarter                • Completed redemption of senior notes on June 15, 2020
   • Proactively managing Receivables and Inventory                            • Funded by drawing on revolving credit facility
   • Interest payment of ~$8M in Q4                                            • Annual interest expense savings over $10 million at
                                                                                  current rates
   Capital Allocation                                                    • Debt covenants
   • Q1 - $18 million in share buybacks                                        • Proforma interest coverage ratio 7.5x on forward
   • Q2 - $33 million acquisition of HTL                                          interest expense
   • Q3 - $10 million in share buybacks                                        • Leverage at 1.8X
   • Q4 - $32 million in debt reduction                                        • Extended the 3.00x minimum interest coverage
                                                                                  through fiscal 2021
        32
Primary Working Capital

                        Primary Working Capital Trend                                                       •   Primary working capital
160,000               Primary Working Capital       Primary Working Capital %                       35.0%       improved by $17M
                                                                                                                quarter-over-quarter
                                                                                                            •   Proactively managed
150,000
                                                                                                    30.0%
                                                                                                                inventory and
                                                                                                                receivables
140,000                                                                                                     •   Compared to May 31,
                                                                                                                2020:
                                                                                                    25.0%
130,000                                                                                                            • AR decreased
                                                                                                                      $12M
120,000                                                                                                            • Inventory
                                                                                                    20.0%
                                                                                                                      decreased $13M
110,000                                                                                                            • Offset by $8M
                                                                                                                      decrease in AP
                                                                                                    15.0%
100,000

 90,000                                                                                             10.0%
          Q1 2019   Q2 2019   Q3 2019     Q4 2019     Q1 2020     Q2 2020       Q3 2020   Q4 2020

    33
Thoughts on Fiscal 2021
               ▪      Slow market recovery with typical seasonality in first half of fiscal 2021 with potential for growth in the
                      second half of the fiscal year
               ▪      Continued cost management to deliver comparable decremental margins - may need additional cost
                      actions if recovery is slower than expected as short-term cost actions no longer benefit P&L
               ▪      Invest in long-term growth through new product development and commercial effectiveness
               ▪      Manage liquidity and maintain strong balance sheet

                     Near-term Industrial Production Estimates (Annualized q/q %)                                *

                                                                    Low     High                                                   Chart shows high and
Calendar                                                                                                                           low estimates of
Q3 20              -19.3%                                                                                                          industrial production
                                                                                                             10.0%
Q4 20               -18.9%                                                                                                         from certain
                                                                                               3.0%
Q1 21                          -14.7%                                                                                              economists.
                                                                                                      6.0%
Q2 21                                                          -4.5%                                                               Continues to be a
                                                                                                                           15.2%
Q3 21                                                                  -1.9%                                                       wide disparity of what
                                                                                                                      13.0%
Q4 21                                                                                   0.5%
                                                                                                                     12.7%         the near future looks
                                                                                                                                   like

           Due to continued uncertainty and lack of forward visibility into market conditions, Enerpac Tool Group
           is not providing fiscal 2021 guidance at this time
    34     *Source: Bloomberg. Data used includes estimates updated on or after 06/12/2020.
Capital Allocation Priorities Remain Unchanged

                                                           • Given the volatility in the
         Reduce Debt and Maintain a Strong Balance Sheet     market, our current capital
                                                             allocation priorities are
                                                             focused on maintaining a
                                                             strong balance sheet and
                                                             financial flexibility
         Invest in Ourselves to Drive Organic Growth       • Investing in ourselves is a key
                                                             priority
                                                           • We have suspended share
                                                             repurchases until we have
                                                             greater clarity
         Opportunistic Share Buybacks
                                                           • We will continue to cultivate
                                                             our M&A pipeline to act
                                                             opportunistically when
                                                             markets stabilize
         Disciplined M&A within Tool Space

35
You can also read