Coca-Cola Bottlers Japan Holdings Inc - Full-year 2020 Earnings Presentation February 12, 2021 - Coca-Cola Bottlers Japan Holdings.
←
→
Page content transcription
If your browser does not render page correctly, please read the page content below

Full-year 2020
                                                     Earnings Presentation
                                                     February 12, 2021

                 Coca-Cola Bottlers Japan Holdings Inc.

Calin Dragan, President
Bjorn Ulgenes, Vice President & Chief Financial Officer
(Posted to CCBJH website on February 10, 2021)
Forward-looking statements
 The plans, performance forecasts, and strategies appearing in this material are based on the assumptions and judgment of the management
 of Coca-Cola Bottlers Japan Holdings Inc. (CCBJH or Company) in view of data obtained as of the date this material was released. These
 forecasts may differ materially from actual performance due to risks and uncertain factors such as those listed below.
 Risks and uncertain factors are not limited to the items listed below. They are also included in our annual securities report, or “Yuka Shoken
 Houkokusho”.
 • Agreements with The Coca-Cola Company and Coca-Cola (Japan) Company Limited.
 • The quality and safety of products
 • Market competition
 • Natural environment, such as climate, disaster, water resources, etc.
 • Legal environment
 • Leakage or loss of information
 • Change of economic conditions, such as personal consumption, currency exchange rates, prices of raw materials, fair value of assets, etc.
 • Business integration, streamlining and optimization of business processes, etc.
 • Uncertain factors other than those above
 The information in this presentation is provided for informational purposes and should not be construed as a solicitation of an investment in
 our securities.
 CCBJH undertakes no duty to update any statement in light of new information or future events. You should rely on your own independent
 examination of us before investing in any securities issued by our company.

                                                                                                                                              2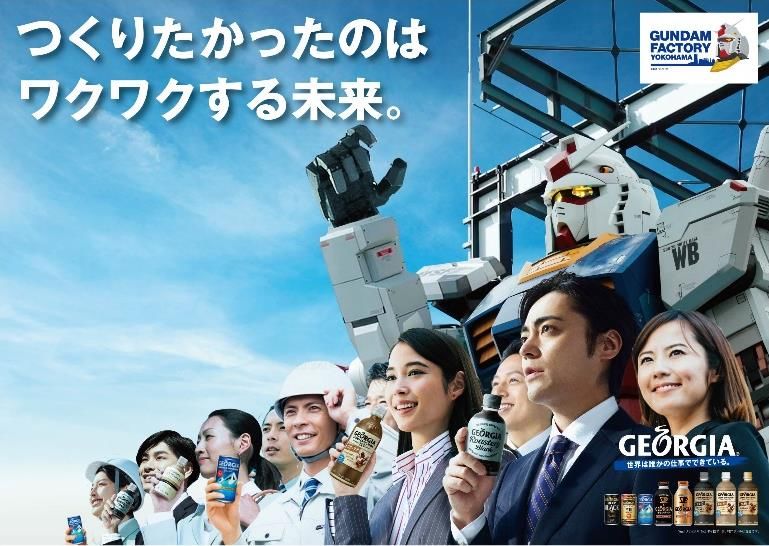
Coca-Cola Bottlers Japan Holdings Inc. (CCBJH)
Full-year 2020 earnings presentation

    Overview and situational analysis

    Full-year results and 2021 outlook

    Q&A

                                                 3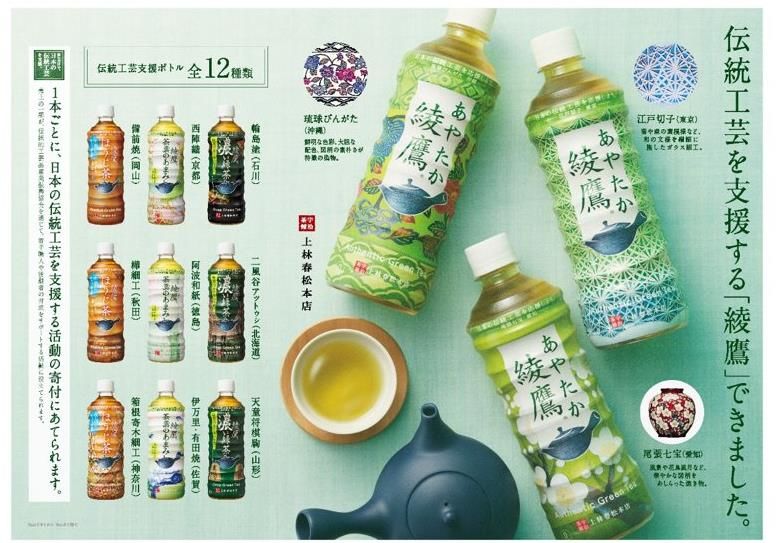
Overview and
Situational Analysis
“Business as usual is not an option”
              - Our focus areas during uncertain times -

  SAFETY & SECURITY                     AGILITY                     RESILIENCE

The safety and security of     Agile and flexible business   Accelerating transformation
our consumers, customers,      planning, ready for the       to build a resilient
partners, employees and        future                        foundation
communities are our priority

                                                                                           5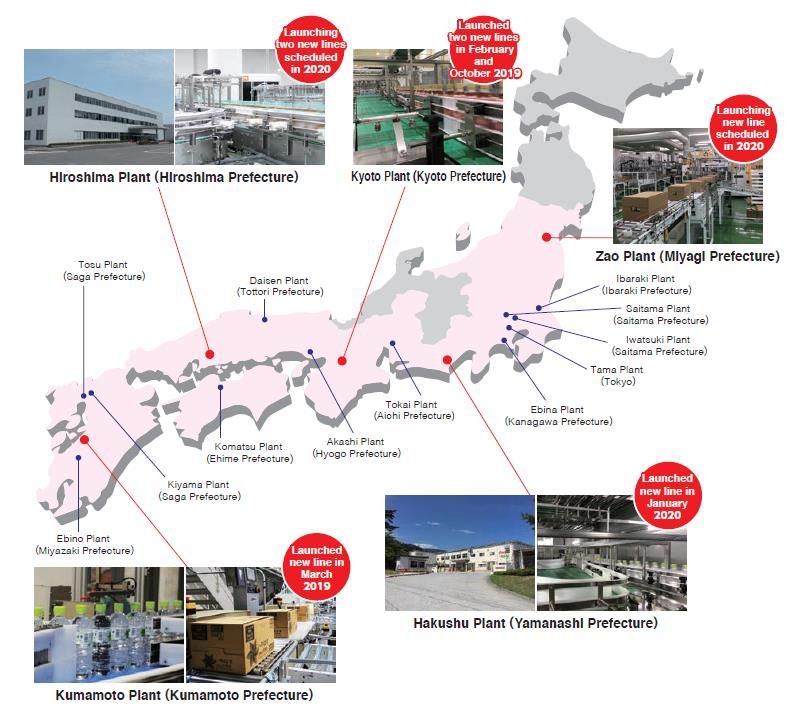
2020 Highlights
Business Income ahead of plan; Building agile & flexible foundation for the future

      Business Income ahead of            Grow & recover market share          Transformation
      plan                                •Continued momentum on vending       •Vending/sales route transformation
      •Flat Business Income despite 100    value share growth and recovery      complete. Optimized organization
       billion yen revenue decline         trend in over-the-counter value     •Progress toward ESG goals; Integral
      •Over 35B yen cost savings           share                                to business planning & execution

       100              Revenue
                 B. Yen contraction        21    Consecutive
                                                 months
                                                               Vending value
                                                               share growth
                                                                               -20%        Vending service route

                                                                                           -10%
                                                                                                         Annualized
                                                                                                         vending fixed
                                                                                                         cost savings
           Business
           Income        200 M. Yen        Q4 OTC
                                           value share growth     Even                Recycled PET & plant-
                                                                                      based PET usage ratio   33%
      Over 35B. Yen cost savings            Winning in the market                 Foundation for future

                                                                                                                         6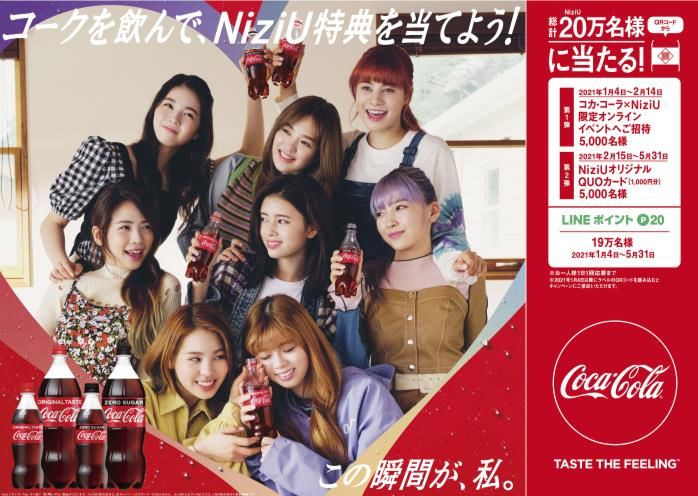
2020 Highlights (Continued)
Business Income ahead of plan; Building agile & flexible foundation for the future
      Growth initiatives                                        Supply capacity expansion                  Good stewardship of capital
      •Focus on innovative products &                           •Completion of major manufacturing         •Focus on core business; Divestment
       packages to meet new consumer                             capacity recovery and expansion            of Q’sai, selling idle assets and cross
       demand                                                   •Solid progress on logistic/distribution    share holdings
      •Exploring white space; Alcohol                            optimization; Saitama Mega DC             •Strong balance sheet
       business continues to perform well                        operational and ramping up in 2021        •Stable credit rating
      •Strengthen winning presence online

       7.9       Million cases    Lemon-dou
                                                                 7new manufacturing lines 15                      B. Yen
                                                                                                                  Cash-in
                                                                                                                             Selling idle assets &
                                                                                                                             cross share holdings
                                                                                                                             in 2020
                 #1           Market share
                              (Lemon sour 350 CAN)

          Online channel growth
                             Over             +30%               Aseptic production
                                                                 capacity vs. 2018  +20% Selling Q’sai in 2021 45                            B. Yen
                                                                                                                                             Cash-in

                                                                       End-to-end                              AA- / Stable outlook
      Grow where the growth is
                                                                   supply chain network                             JCR rating
           Market share source: Intage SRI, Jan. to Dec. 2020

                                                                                                                                                       7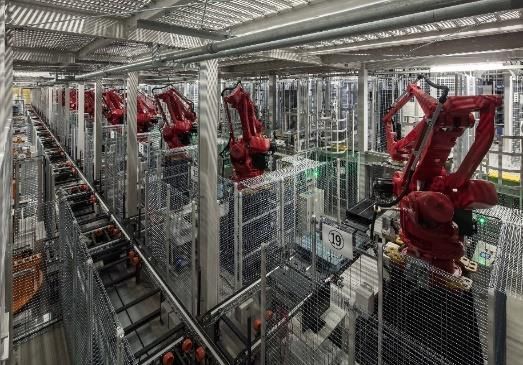
Focusing on what’s in our control

2020 situation                          Delivering results in a tough year
• 100B yen revenue decline vs. PY   ✓   2020 Business Income 4B yen better than
                                        plan
• Rapid consumer behavior shift     ✓   Accelerated transformation of cost structure,
  amid COVID-19                         organization, people, processes and systems
• Delay and re-plan of marketing    ✓   More agile planning and execution to
                                        respond in real time to market changes
  due to postponement of Tokyo
                                    ✓   Demonstrated ability to flex cost savings to
  2020 Olympic and Paralympic           offset topline uncertainty
  Games
                                        Over 35B yen cost savings in 2020

                                                                                        8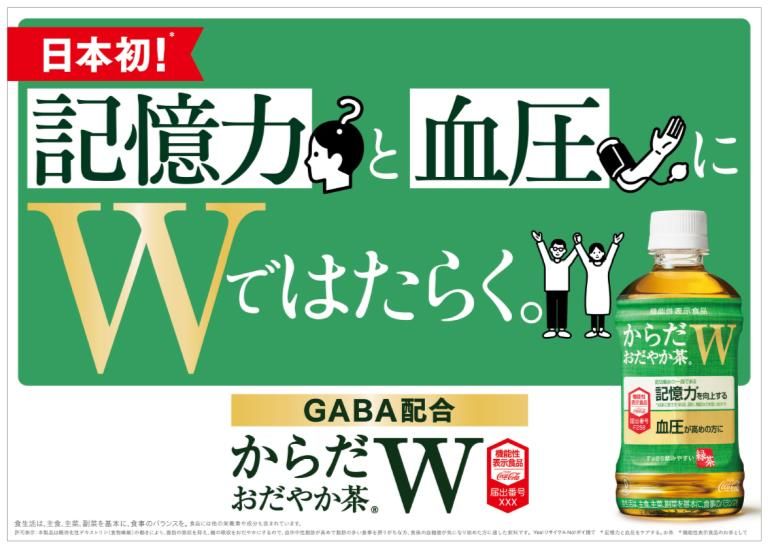
White space expansion – Success in ready-to-drink alcohol

  Lemon-dou sales volume reached ~7.9
  million cases in 2020, well ahead of plan
  Launched dry taste “Kamisori Lemon” in
  December 2020. Now offering 5 SKUs
  “Teiban Lemon” won #1 market share in
  350ml lemon sour category in 2020

     Market share source: Intage SRI, Jan. to Dec. 2020   Each case contains 24 x 350ml can

                                                                                              9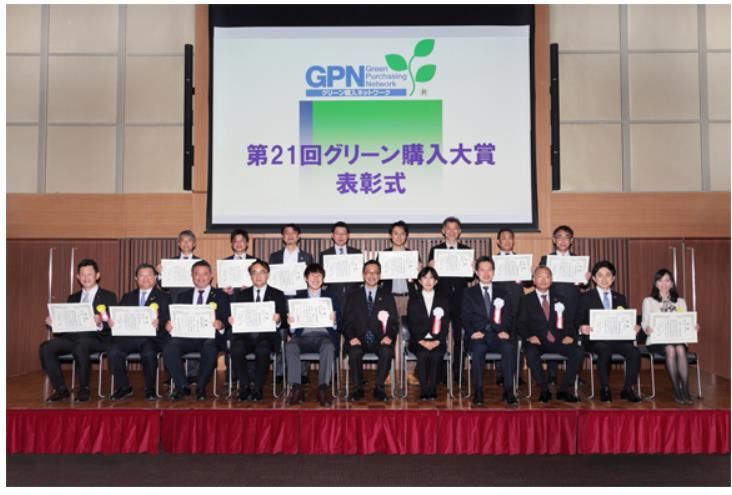
Agile and flexible supply infrastructure
                                                            CCBJI supply chain footprint
  Seven new manufacturing lines up and running
  since 2019. 20% additional aseptic production                      2           2
                                                                    lines        lines
  capacity vs. 2018 to meet consumer demand
                                                                                                            1
  Expanding in-house alcohol production capacity as                                                         line

  category continues to grow
  Shinsei logistic/distribution optimization project
  ongoing; closed 14 sales/distribution centers in
  2020; Completion of Saitama Mega DC
                                                                                                1
                                                                                                line
                                                                      1
                                                                     line

                                                                            Alcohol lines:
                                                                            Kyoto and Saitama          2
                                                                                                    lines
             Saitama Mega DC and automated picking system

                                                                                                                   10
Full-year 2020 results
Full-year 2020 results vs. 2019
Business Income better than revised plan driven by significant cost savings.
Operating income improved versus prior year, cycling one-time expenses.
Divesting health and skincare business, now treated as discontinued operations.
                                                                                        2020 Actual              2020 Revised plan       2019 Actual    YoY (%)
Continuing Operations (Beverage Business)
  Revenue                                                                                       791,956                       794,500        890,009       -11.0%
  Beverage Sales Volume (Million Cases)                                                                 458                       459             505         -9%
   NARTD (Non-alcoholic ready to drink) Beverage Volume (Million Cases)                                 450                       451             503        -11%
  COGS                                                                                          429,040                              -       468,785        -8.5%
  Gross Profit                                                                                  362,916                              -       421,224       -13.8%
  SG&A                                                                                          359,645                              -       407,510       -11.7%
  Business Income (Loss)                                                                                169                    (3,600)        11,447       -98.5%
  Operating Income (Loss)                                                                      (11,722)                       (13,300)       (58,904)             -
Net income (loss) attributable to owners of parent                                                (4,715)                      (7,000)       (57,952)             -
(Total of continuing and discontinued operation)
 Unit: Million JPY

                                              Some inconsistencies with the volume data provided in past presentations may                                            12
                                              be expected as a result of standardization of volume and revenue calculation.
Full-year 2020 Drivers of Business Income
Topline pressure offset by significant cost savings and transformation; Flat Business Income
Volume, Price DME Commodity Manufacturing Others
& Mix* (Direct Marketing
Expense, fixed only)
11.4 -45.3
(Full-year)
0.2
Full-year 2019 Q3 -14.5 • Reduced • Cost reduction Full-year 2020
Business marketing spend thorough efficiency
Business
during peak +27.6
Income COVID-19 impact
improvement offset
Income
by lower production
(Continuing • Replan of volume, higher (Continuing
operations) Q2 -18.5 marketing depreciation, etc.
operations)
+1.5
• Reflects cost
-2.4 savings in labor,
Q1 -1.9 +7.3 IT, T&E, etc. and
lower logistics/
distribution
• Vending volume -13%, CVS -11%,
R&F -28%
• Lower variable expense (vending Beverage volume YoY (%)
commission, deductions from Q1 Q2 Q3 Q4 2020
revenue, etc.)
• Alcohol contribution -2 -18 -10 -6 -9
Unit: B JPY
(Rounding off less than unit)
*Volume, Price & mix represent marginal profit of our commercial activities including variable costs and deduction from revenue in IFRS.
13Full-year 2020 NARTD beverage performance
Growth in D&D, Online channels; Package mix and case size impacting revenue per case
By channel Wholesale
Vs. PY Volume revenue
Winning where the growth is 1% per case
Capturing bulk purchase demand Supermarket (SM) +1% -54Yen
Online channel volume growth over 30% 19% 25% Drug & Discounter (D&D) +8% -46Yen
vs. PY
Convenience Store (CVS) -11% -23Yen
Continue to gain vending value share
24%
Mix & wholesale revenue per case trend 16% Vending (VM) -13% -44Yen
At-home consumption increase 15% Retail & Food (R&F)
-28% +48Yen
Includes Online
New configuration of bottles per case for
1.5L PET (From 8 to 6 bottles per case) in
Q4 decreased average revenue per case
Retail pricing trend NARTD OTC Retail Price
Observing growth in retail price premium
OTC Retail Price Vs. Market
vs. market in small PET by new products, (Jan. to Dec. 2020, JPY per bottle) Average
Vs. PY
continued premium in large PET
Small PET +2.7 -1.3
Large PET (2L PET) +19.6 -4.9
NARTD: Non-alcoholic ready-to-drink
Retail price data source: Intage
Note: Volume doesn’t include alcohol. Revenue per case doesn’t include DFR (deduction
from revenue). Some inconsistencies with the volume data provided in past presentations 14
may be expected as a result of standardization of volume and revenue calculation.Full-year 2020 our NARTD category volume performance
Continued, but moderating impact from COVID-19
Sparkling driven by decline in R&F and VM, partly
offset by Coca-Cola Zero renewal, launch of Fanta
By category Premier series
Vs. PY Volume
NST decline driven by CVS, R&F and VM. Slight decline in
8% Sparkling -9% green tea partially offset by new Ayataka Koi Ryokucha.
6%
26% Non-sugar tea (NST) -9% Sports impacted by category decline & weak large PET.
Sports Includes contribution of newly-launched 950ml PET
21% -12%
Water decline driven by small PET as immediate
21% Water -3% consumption channels declined despite growth of large
9% Coffee -7% PET in SM and D&D
9% Coffee can & bottle can decline offset growth in PET
Juice -24%
packages driven by Georgia Latte Nista and Japan
Craftsman. Bottle can growth in Q4 led by Georgia
European
Juice declined due to sharp drop in R&F demand
NARTD: Non-alcoholic ready-to-drink
Note: Volume doesn’t include alcohol. Revenue per case doesn’t include DFR (deduction
from revenue). Some inconsistencies with the volume data provided in past presentations 15
may be expected as a result of standardization of volume and revenue calculation.NARTD channel/category/package volume performance
Q4 2020 (Oct. to Dec.) volume: -6% By package
By channel Wholesale Full-year 2020
Vs. PY Volume revenue vs PY Volume
1% per case 2% S-PET -10%
Supermarket (SM) +8% -108 Yen 7%
20% L-PET +6%
25% Drug & Discounter (D&D) +11% -90 Yen 10%
5% 39% Can -16%
Convenience Store (CVS) -8% -50 Yen
13% Bottle Can -2%
24% 14% Vending (VM) -10% -23 Yen
Syrup -34%
16% Retail & Food (R&F) 24%
Includes Online
-20% +33 Yen Powder -28%
By category Q4 2020 vs PY Volume
Vs. PY Volume 3% S-PET -6%
9% 6%
6% Sparkling -3% L-PET +13%
27% 11%
Non-sugar tea (NST) -5% 39% Can -12%
5%
23% Sports -18% Bottle Can +5%
13%
Water +5%
21% 23% Syrup -25%
9%
5% Coffee -5%
Powder -26%
Juice -22%
S-PET: PET under 600ml/L-PET: PET above 1.5L
NARTD: Non-alcoholic ready-to-drink
Note: Volume doesn’t include alcohol. Revenue per case doesn’t include DFR (deduction
from revenue). Some inconsistencies with the volume data provided in past presentations
16
may be expected as a result of standardization of volume and revenue calculation.Building a foundation for value growth in 2021
Recovery in OTC value share, vending share growth momentum continues
OTC – Back to growth from December Vending – Share growth momentum continues
• Q4 OTC value share getting back to 2019 levels, • 21 consecutive months of value share growth since April
supported by Q4 return to more normalized marketing 2019, maintain momentum amid COVID-19
investments; Momentum continues in early 2021 • Winter portfolio assortment and Coke On promotion
supported value share growth momentum in Q4
OTC Market Share (YoY) Vending Value Share
Market Share (vs. PY, PP) Value Volume
Full-year (Jan. to Dec.) -0.4 -0.3
Q4 (Oct. to Dec.) 0.0 +0.7
2018 2019 2020
Value Volume
Q1 2020 Q2 2020 Q3 2020 Q4 2020
Source: Intage
17Accelerated transformation and mitigating actions deliver over 35B
cost savings in 2020
Transformation
• Vending operational model
• OTC sales route
Supply chain recovery and expansion, normalizing
logistics and distribution
Over • New aseptic manufacturing lines, Hiroshima plant
Labor
35B yen • Bonus payment and overtime reduction, early retirement,
paid temporary leave
Cost savings in 2020 Marketing
• Re-plan product launches, marketing/sales promotion
• Minimize price promotions/discounts
Other
• Tight controls on travel, entertainment, general back-
office and support functions given COVID-19 restrictions
18Continued priority on good stewardship of capital
Focus on shareholder value creation and appropriate cash position given macro uncertainty
Shareholder value creation
Balance sheet and
Dividends Capex and depreciation
cash flow
2020 - Solid financial position: JCR 2020
No change to reinstated year-end rating AA- with stable outlook, Capex reduced 26 billion yen
dividend plan 53.4% equity ratio at 2020 end versus plan
2021 - 15 billion yen cash-in in 2020 by 2021
Return to stable dividend selling idle assets and cross-held Restrained new capex during
shares ongoing COVID-19 uncertainty
2020 2021 plan
- 45 billion cash-in with 12.5
50 Yen/share billion yen pre-tax profit in Q1 (Billion JPY) 2020 actual 2021 plan
CAPEX 69.3 45 to 50
25 Interim Year-end 2021 by divesting health &
Yen/share skincare business Depreciation 59.6 55 to 60
25 25
Yen/share Yen/share
19Marketing and branding update
Update from Coca-Cola (Japan) Company

               2020 Q4 Initiatives Highlight

                 2021 Q1 Business Plan

                                               21
2020 Q4 Initiatives Highlight:
Georgia Coca-Cola Zero Sugar Cross Category
“Try Your Luck” Promotion Full Renewal Winter Campaign
1.5MM applicants Achieved new users 1.1MM applicants
Contributing to Georgia share growth and high repeat rate
Coke ON Lemon-dou 1st Anniversary Coca-Cola New Year Countdown from
Buy 1 Get 1 Free Promotion Kamisori Lemon Launch Space
Achieved 1MM users First Dry taste from Lemon-dou 9MM Viewers
Rocket start
22Accelerating Sustainability:
ILOHAS “Green Purchasing Network Award” Grand Prize
232021 Q1 Business Plan (January)
Coca-Cola Georgia x Gundam Aquarius “Mamoru”
“Open to Happiness” Campaign Campaign Lactobacillus Water
Pop Girls Group NiziU Georgia share gain 10 billion “Shield Lactobacillus”
Support the precious moments Hot topic on SNS per bottle
of new normal Support health of family
24 242021 Q1 Business Plan (February to March)
Ayataka “Traditional Crafts Donation
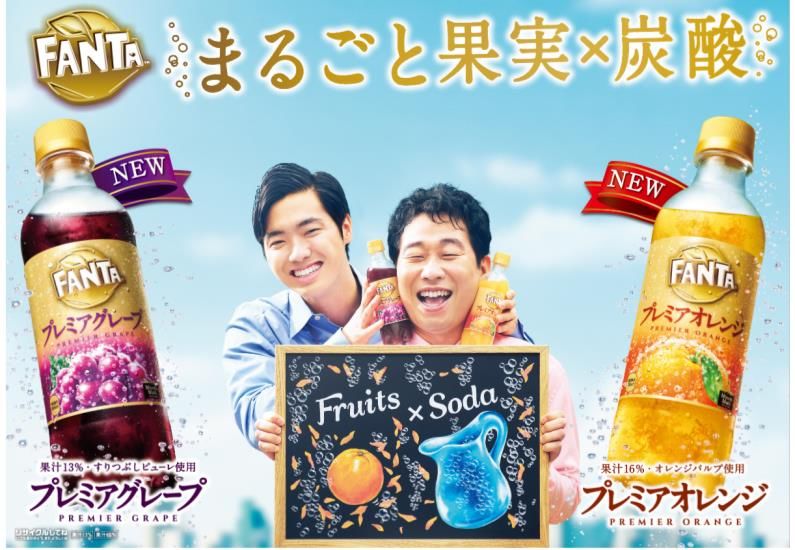
Karada Odayakacha W Fanta Premier Renewal
Bottle”
Japan’s first ever Help support young Further strengthen the
Functional beverage with double craftspeople by donating a “Premium Sparkling”
benefit on memory and blood portion of revenue from positioning for adult consumers
pressure Ayataka green tea
252021 Business Plan:
Continue flexible and timely actions to adapt to changes
FEWER, BIGGER STAY@ HOME
PIVOT TO CORE
INNOVATIONS
コアへの原点回帰 家庭内需要の獲得
選択と集中
262021 Direction / Outlook
Strong uncertainties due to resurgence of COVID-19 & 2nd State of Emergency
                                                                                       Traffic movement has declined due to SoE, but better
                        Macro economy                                                                      than 2020
      • GDP down -5.1% in 2020 and                                                            Number of new coronavirus cases (per day)
        recuperating +3.1% in 2021
      • “After COVID-19” moderate growth

                                 Source: IMF World Economic Outlook Jan. 2021

                   Key consumer trends
                                                                                                                   Source: Ministry of Health, Labor and Welfare, Area: All Japan
       • Health consciousness and hygiene                                                                 Traffic in Food channel (% vs. LY)
       • Digital acceleration                                                    0
                                                                                -10                             2020                                                       2021
       • Affordability versus indulgence                                        -20                              SoE                                                        SoE

         polarization                                                           -30
                                                                                -40
                                                                                -50
                                                                                -60

     SoE: State of Emergency declaration                                        -70
                                                                                      Jan,'20 Feb   Mar   Apr    May   Jun    Jul   Aug    Sep      Oct    Nov      Dec Jan,'21
                                                                                                                                                 Source: unerry, Month: 445 calendar

                                                                                                                                                                                       28
Strong uncertainties in 2021 triggered by 2nd state of emergency
Easing Resur- 2nd
Pre-Crisis 1st SoE
restrictions gence SoE
CCBJI NARTD volume YoY
(Jan. 2020 to Jan. 2021)
1 2 3 4 5 6 7 8 9 10 11 12 1
• Prolonged COVID-19 impact, though gradually improving volume trend through end of 2020
• Continued stabilization was expected in Q1 2021, but declaration of 2nd state of emergency in
January has introduced significant uncertainty to outlook. January volume down mid teens
• Evaluating multiple scenarios. No full-year guidance provided at this moment
SoE: State of Emergency declaration
292021 Outlook
Unable to provide 2021 guidance now in light of renewed COVID-19 uncertainties. Focus on what we can control;
Agile & flexible business planning based on multiple scenarios as situation evolves
Product portfolio and Commercial Initiatives Transformation
innovation •Revenue recovery and value •Vending operation
•Innovation and “Big Bet” share growth transformation
product launches •Focus on ROI •Shinsei logistic/distribution
•Pivot to core, stay @ home •Capturing “New normal” optimization project
•Leverage digital consumers’ behavior •Digitalization/DX
Cost savings & investment Good stewardship of capital ESG initiatives: Creating
• Recurring cost savings target 7 •Stable dividend: 50 yen per shared value
to 9 billion yen share annually •Progress in sustainable
• Reconsidering near term •Strong balance sheet, cash-in packaging
investment plan; Capex 45 to from divestment •Raising diversity & inclusion
50B, depreciation 55 to 60B target
30Commercial initiatives to drive revenue recovery
Revenue recovery
Value share growth
Focusing more on ROI
Focus on where growth is Vending Disciplined investment
Growing channel/categories Maximize transaction and quality Selective sales promotion
Core and big bets products placement Equipment placement and
White space New, vending-exclusive products new rack placement
Coke ON promotion
Expand space to sell Capabilities and
Profitable column expansion
digitalization
Cost saving through ongoing transformation
Resilience / Agile Foundation
31Agile adaption to “New normal”
Driving initiatives to capture consumers’ behavior change
Launching label less SKUs and Expand 350/700ml PET offerings Market execution responding Cross-channel promotion by
new package configuration, in supermarket and drug & Coke ON smartphone app to
discounter channel. Bundle and
to demand. New rack
growing revenue from development in OTC (over- drive vending traffic,
multi-pack new launch, 950ml
subscription consumers in PET offerings exclusively in the-counter) channel outlets increasing cashless enabled
Online channel convenience store channel, machines to drive transaction
32Ongoing transformation across our supply network
End-to-end transformation; from supply chain to field operations
• Transform warehouse operations
• Optimize sales centers as new logistic/distribution
infrastructure is up and running
• Digitalize planning and field operations
• Further accelerating transformation of
vending operations by Mega DC
33ESG – More important than ever
Steady progress toward WWW (World Without Waste) goals to create shared value
2020 achievement Inclusion in leading market indices
Usage of recycled PET and plant-based PET: 33%
Launch of iLohas 555ml with 100% recycled PET resin
Selective launch on Ayataka 525ml with plant-based PET
2021 plan
Expand 100% recycled PET bottle offerings Diversity award from Tokyo Metropolitan Government
"Grand Prize" in the industrial category of Tokyo
Metropolitan Government Women's Participation Awards
Action on water source replenishment
Agreement for forest management with Nippon Paper
and Marunuma Kogen Resort
Supporting our communities
Donated Coca-Cola
products to medical
institutions and food
banks to support
local communities
34Creating shared value
Updated our CSV goals to raise management diversity and inclusion target
20% Female managers by 2030
352021 Outlook KPIs
Shift from “Resilience” to “Recovery toward Growth”.
Market share Recurring cost savings Annual dividends
7 to 9 50
Bil. Yen Yen/Share
Recurring cost savings
Value share growth to
target through Return to stable dividend
drive revenue recovery
transformation
Capex Depreciation Content of
recycled PET
45 to 50 55 to 60 40%
Bil. Yen Bil. Yen
Restraint in new capex Driven by supply Expand recycled PET
during ongoing COVID- capacity investment usage, on track to meet
19 uncertainty through end of 2020 ambitious 2030 goals
*Not including IFRS16 non cash items
36In closing
Sustainable growth, creating shared value
Good
Win in the Continue
stewardship of
market place transformation
capital
37Q&A
Appendix
We are part of the global Coca-Cola system
An enduring and effective partnership

     Coca-Cola (Japan) Company
         •   Brands                     •   Customer focus
         •   Innovation                 •   Local expertise
         •   Global perspective         •   Best-in-class execution
         •   Consumer focus             •   Finished goods production
         •   Superior insight           •   Logistics and distribution
                                        •   Cost optimization

                                                                         40
Glossary of key terms
Business A measure of our underlying or recurring business performance after the adoption of IFRS. Business Income deducts cost of goods and SG&A from revenue, and
Income includes other income and expenses which we believe are recurring in nature.
DME Abbreviation of Direct Marketing Expenses. Sales promotion-related expenses, including advertisement, rebates, sales commissions, etc.
FC Abbreviation of Future Consumption. Purchase or sell beverage for future consumption in home, etc. It also means the products / SKUs for FC (for example, single
packages 1L or more and multi-pack of IC packages) and channels that consumers purchase the beverages for FC. (for example, supermarket, drug & discounter channels,
etc.).
HORECA Abbreviation of Hotel, Restaurants and Cafeteria. Generally means sales channels of these kinds.
IC Abbreviation of Immediate Consumption. Purchase or sell beverage for consuming it immediately. It also means the products / SKUs for IC (for example, single packages
less than 1L as well as fountain) and channels that consumers purchase the beverages for IC (for example, vending machines, convenience store channel, etc.).
PTC Abbreviation of Price, Terms and Conditions, an internal guideline for setting appropriate transaction conditions with customers, frequently used in conjunction with
RGM.
RGM Abbreviation of Revenue Growth Management, an overall strategy and process to achieve profitable revenue growth.
RTM Abbreviation of Route-to-Market. A framework, a process, a philosophy, a proven approach for driving profitable growth.
Channel definitions Vending Retail sales to consumers through vending machine
Supermarket Wholesale to supermarket chains customers
Drugstore & Discounter Wholesale to drugstore and discounter chains customers
Convenience Store Wholesale to convenience store chains customers
Wholesale to grocery store, liquor store, eating & drinking establishments (HORECA),
Retail & Food
online sales channels customers, etc.
Others Wholesale to customers other than above
41THANK YOU Investor Relations Coca-Cola Bottlers Japan Holdings Inc. ir@ccbji.co.jp https://en.ccbj-holdings.com/ir/ facebook: https://www.facebook.com/ccbji/
You can also read