Investor Presentation - January, 2019 - Mexichem

Page created by Debra Medina
 
CONTINUE READING
Investor Presentation - January, 2019 - Mexichem
Investor Presentation

January, 2019
Investor Presentation - January, 2019 - Mexichem
Forward-Looking Statements
    In addition to historical information, this presentation           Mexichem has implemented a Code of Ethics that rules its
    contains     "forward-looking"     statements    that    reflect   relationships with its employees, clients, suppliers and
    management's expectations for the future. The words                general groups. Mexichem’s Code of Ethics is available for
    “anticipate,” “believe,” “expect,” “hope,” “have the intention     consulting in the following link:
    of,” “might,” “plan,” “should” and similar expressions             http://www.mexichem.com/Codigo_de_etica.html.
    generally indicate comments on expectations. The final
    results may be materially different from current expectations      Additionally, according to the terms contained in the
    due to several factors, which include, but are not limited to,     Securities Exchange Act No 42, Mexichem Audit Committee
    global and local changes in politics, the economy, business,       established a mechanism of contact, which allows that any
    competition, market and regulatory factors, cyclical trends in     person that knows the un-fulfilment of operational and
    relevant sectors; as well as other factors that are highlighted    accounting records guidelines and lack of internal controls of
    under the title “Risk Factors” on the annual report submitted      the Code of Ethics, from the Company itself or from the
    by Mexichem to the Mexican National Banking and                    subsidiaries that this controls, file a complaint which is
    Securities Commission (CNBV).                                      anonymously guaranteed. The whistleblower program is
                                                                       facilitated by a third party. The telephone number in Mexico
    The forward-looking statements included herein represent
                                                                       is 01-800-062-12-03.
    Mexichem’s views as of the date of this press release.
    Mexichem undertakes no obligation to revise or update              The website is: http://www.ethic-line.com/mexichem and
    publicly any forward-looking statement for any reason unless       contact e-mail is: mexichem@ethic-line.com.
    required by law.”
                                                                       Mexichem’s Audit Committee will be notified of all complaints
                                                                       for immediate investigation.
2
Investor Presentation - January, 2019 - Mexichem
Mexichem’s Growth Strategy
       Mexichem at a Glance                                pg. 4

       Adding Specialty Products and M&A                   pg. 12

          Acquisition for the Fluent Business Group
          Acquisition for the Vinyl Business Group
       Margin Growth vs Organic Volume Growth              pg. 20

       Backward Integration to Reduce Cost of Production   pg. 24

       Vinyl and Fluor Business Group Outlook              pg. 28

          Improving Outlook for PVC
          Fluor Business Group
       NAFTA impact on Mexichem                            pg. 34

       Lower Capex Cycle and Solid Balance Sheet           pg. 37

       Mexichem of the Future                              pg. 40

       Management Team                                     pg. 45

3
Investor Presentation - January, 2019 - Mexichem
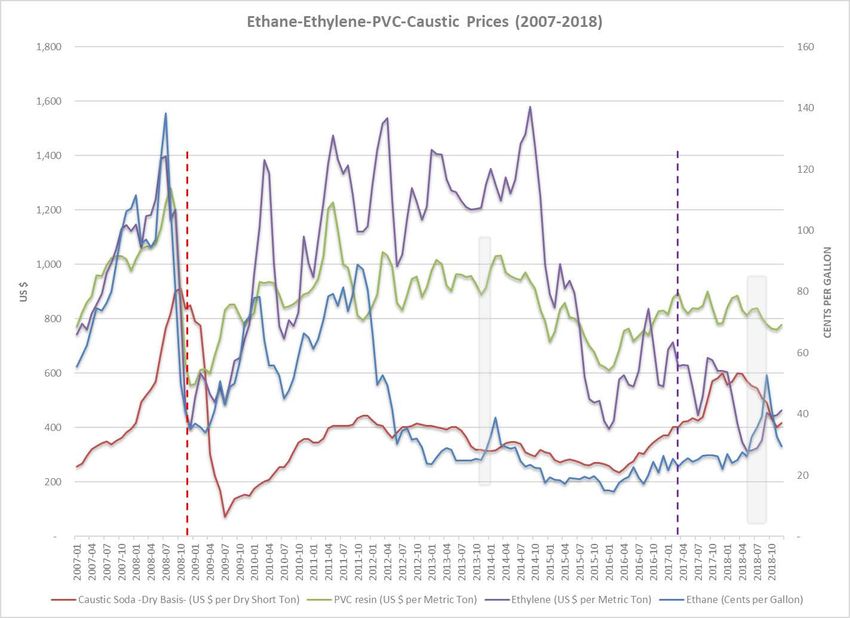
Mexichem at a Glance

4
Investor Presentation - January, 2019 - Mexichem
Business Snapshot

 Operations
 41 countries

 Sales
                                                                                                                            >22,000
                                                                                                                             employees
 >100 countries

                                                                                                                      >$6.7 billion*
                                                                                                                      Consolidated Annual
                 137                                                                                                  Revenues
     production plants
                                                                             17                           2
                                                                        R&D labs                     fluorite mines
     * Note: Includes sales of Netafim as of 2017 (Proforma). All numbers includes Netafim figures
 5   .
Investor Presentation - January, 2019 - Mexichem
A major transformation over the past 15 years...

                 2003                                                                                                                                       TODAY
                Revenues(1)
                $312 million                                                                  21x                                                           Consolidated Revenues
                                                                                                                                                            $6.7 billion*

                EBITDA(1)
                $50 million
                                                                                              24x                                                           Adjusted EBITDA
                                                                                                                                                            $1.2 billion*

                Market Cap(2)                                                                                                                               Market Cap(2)
                $167 million                                                                  32x                                                           $5.4 billion

 Notes:
 1) Reported figures under Mexican GAAP and converted into dollars using an FX of 10.8 MXN/USD
 2) 2003 market cap figures as of 12/31/2003; Market cap as of 01/07/2019. *All figures are as of 2017 and includes the integration of Netafim (Proforma)
   8
Investor Presentation - January, 2019 - Mexichem
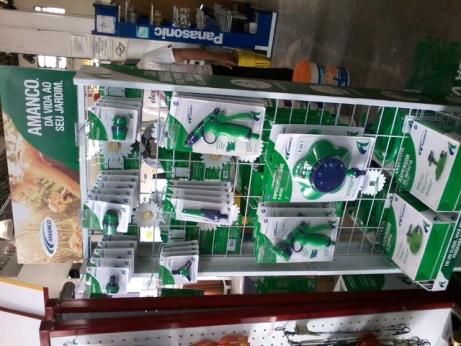
Strong Track Record of Disciplined Acquisitions
(27 acquisitions since 2003)
                                                                                                                                                                                                             4
                                                                                                                                                                                        Sylvin Technologies

                                                                                                                                                        Specialty PVC resins

                                                                                                                         Fluorita de Mexico

                     Camesa trade name becomes Mexichem

     43% of Mexichem (Camesa subsidiary)

            Quimica Fluor
                                                                      Fluorita de Rio Verde                                                                                                             1
                                                                                                                                                                                           2     1,405
                                                                                                                                                                                   1,106
                                                                                                             830          962         899                      910        926
                                                                                                                                                   818
                                                                                                 645
                                                            392         472          457
                                   189          228
         50            72

       2003           2004        2005        2006         2007        2008         2009        2010        2011         2012        2013         2014        2015       2016      2017        LTM 3Q'18
        1.9x           2.5x        0.5x        0.7x         1.6x        1.2x         1.0x        1.3x         1.1x        0.7x         1.0x        2.2x         1.0x       1.8x     1.2x          1.91x

                   Success at integrating new acquisitions has boosted sales and EBITDA and has made                                                                     EBITDA (US$mm)
                                    Mexichem a leader within the industries it operates                                                                                                    3
                                                                                                                                                                          Net debt/EBITDA
               Source: Company filings. 1) 3Q18 considers Netafim’s integration since February 7th, 2018. 2) Figures for 2017 do not consider EBITDA from Netafim.
               3) Net debt in 3Q’18 and 2017 includes US$0.6 million and US$0.9mm, respectively; in 2016 includes US$1.4mm and in 2015 US$21.4mm,
7              corresponding to letters of credit and suppliers’ credits exceeding 180 days, which, only for the purposes of the covenants of the Cebures and our
               revolving credit facility, are considered financial debt, although they are not recorded as debt in our balance sheet 4) Acquired in 2018.
Investor Presentation - January, 2019 - Mexichem
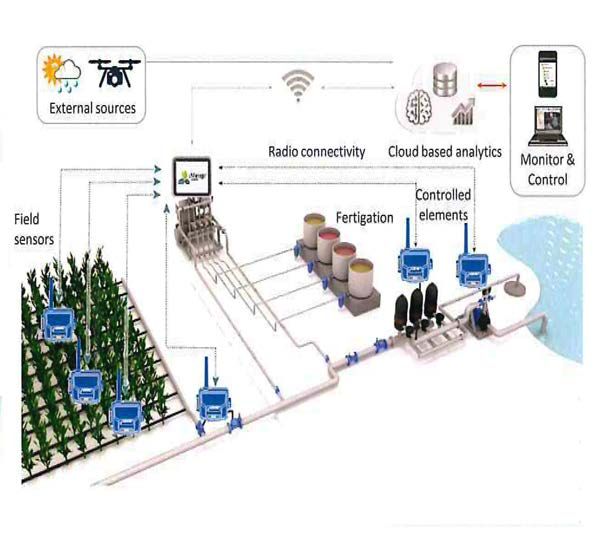
Mexichem Business Groups
 Global Leader in Plastics and Chemicals

                                       Fluor                                                                                                  Ethylene
                                    Value Chain                                                                                              Value Chain

                             Fluorspar                                                                                                                   Pipes and fittings
                                                                                                                      PVC & Specialty Resins
                             Hydrofluoric acid                                                                                                           Irrigation systems
                                                                                                                      Compounds &
                             Refrigerants                                                                             Plasticizers                       Datacom
                             Aluminum fluoride                                                                       Derivatives                        Geosynthetics

                                                                        JV with

                                 Revenues: $830 mm                                                     Revenues: $2,476 mm                                 Revenues: $4,158 mm
                                 EBITDA: $351 mm                                                       EBITDA: $614 mm                                     EBITDA: $534 mm
LTM 3Q18                                                                                               EBITDA margin: 24.8%                                EBITDA margin: 12.8%
                                 EBITDA margin: 42.3%
Proforma                         24% of consolidated EBITDA                                            43% of consolidated EBITDA                          38% of consolidated
                                 Specialty products EBITDA 13% of                                      Specialty products EBITDA 12%                       EBITDA
                                 Consolidated                                                          of Consolidated

       Note: Revenues and adjusted EBITDA margin correspond to LTM 3Q18. All figures are before intercompany eliminations.
     * Includes Netafim figures proforma (12 months of results). For statutory purposes, Netafim is consolidated since February 7th, 2018.
 8
Investor Presentation - January, 2019 - Mexichem
Vertical Integration
    Ensuring Supply to Mitigate Volatility & Increase Cost Competitiveness
    Ethylene Chain Overview
       -   One of the largest PVC resin and leading player in piping worldwide

                                                                                               Compounds
                                      Chlorine &
                   Salt
                                       Caustic
                                                                              PVC Resin
                                                            VCM
                                                                                               Sylvin Technologies   63% of LTM
                                                                             Specialty Resin
                                                                                                                     consolidated
                  Ethane              Ethylene
                                                                                                                     proforma EBITDA* in
                                                                                                  Fluent             3Q’18

                  Mexichem products                On-going joint ventures

                                                              VOLATILITY
              +                          VERTICAL INTEGRATION THROUGHOUT THE VALUE CHAIN
                                                                                                                           –
                Commodity companies trade at an average                         Specialty material companies trade at an
                   EV/EBITDA multiple of 5.8x to 8.0x                         average EV/EBITDA multiple of 9.0x to 13.8x

9
Investor Presentation - January, 2019 - Mexichem
Vertical Integration: Fluor Business Group

                                               40% Sold to Market         100% Sold to Market
                             Sulphuric
                               Acid

                                                        HF                     Refrigerant
                                                                                 Gases

                             Fluorspar
                                                         Aluminum                               Strategy:
                                                           Fluoride                             Downstream integration to
                                                                                                higher value added
                          60% Sold to Market                                                    products

                                                         100% Sold to Market

                          +                                    VOLATILITY
                                         VERTICAL INTEGRATION THROUGHOUT THE VALUE CHAIN
                                                                                                            –
                                                  Commodity/Chemical Companies trade at an
                                                  average EV/EBITDA multiple of 9.0x to 11.0x
Source: Company filings

      10
Mexichem’s Markets and Product Categories
                                                                                                                                            Netafim’s contribution

     BUSINESS UNITS                   MARKETS SERVED                                             PRODUCT CATEGORIES                      EXAMPLES
                                                              Others                                     Pipes & Fittings (PVC,
                                                                             Infrastructure
                                                     Energy
                                                                10%                                       Polyethylene, Polypropylene)
                                                              4%    15%
                                              Telecom                                                    Geosynthetics (woven &
                                                           12%                                            non-woven)
                                                                         32%                             Datacom & Infrastructure
                                            Agricultural                                                 Irrigation systems
                                                               27%                  Housing
                                 From 3% to 27% if we                                                                                      Driplines, sprinklers and
         FLUENT                  were to include                                                                                           other irrigation products
                                 Netafim

                                                         Others 3% Automotive 3%
                                                                       Industrial 5%                      Base Chemicals
                                                  Wire &                  Medical 4%                      Specialty Resins
                                                  Cable                        Home, lawn &
                                                          20%                                             PVC Resins
                                                                               Garden 4%
                                                                                                          Compounds
                                                                                                          PA & Plasticizers
                                                              60%                                         Phosphates
                                              Building &
           VINYL                              Construction                                                Other Chemicals

                                                     Technical
                                                     Propellants        Aluminium
                                                                                                          Fluorspar Met Grade
                                                                   8% 5%     Building and
                                                                             Construction                 Fluorspar Acid Grade
                                        Air Conditioning                14%
                                                                                Chemicals
                                                                                                          Hydrofluoric Acid
                                                                          3%
                                                           26%                                            Anhydrite
                                                                                *1%                       Aluminum Fluoride
                                                                         26%    corresponds to            Refrigerants
          FLUOR                                                17%
                                                                                Energy                    Medical propellants
                                                  Refrigeration             Medicals
                                                                                                          Technical Propellants

     Source: Company fillings, Markets as % of pro forma 2017 revenues of combined entity
     Note: Netafim’s agricultural contribution includes Landscape (c.1%) and Mining (c.1%)
11
Adding Specialty Products
              M&A

12
Acquisitions for Fluent Business Group
   Wavin and Dura-Line
          Wavin EBITDA Margin (1)                                                                          Dura-Line EBITDA Margin (1)
          (% of Total Revenue)                                                                              (% of Total Revenue)
20.0%                                                                                                    25.0%
                                                                                                                                                                          22.4%

                                                            14.3%                                        20.0%                               17.3%
15.0%                                     13.7%                                                                                                                   17.2%
                                               12.0%                                                                                                                                     Margin 2018 = 16.5%
                             10.3%                                          10.9% Margin 2018 = 12.5% 15.0%               14.8% 14.0%                                              13.5% Margin 2015 = 14.8%
                                                                    9.7%                                                                             13.3%
10.0%                 9.2%                                                          Margin 2013 = 9.3%           9.7%
                                                                                                         10.0%
          4.3%
5.0%
                                                                                                          5.0%

0.0%
                                                                                                          0.0%
                 1Q                  2Q                3Q                  4Q
                                                                                                                        1Q                2Q                 3Q                   4Q
                  2013       2014    2015     2016     2017    2108                                                             2015     2016     2017     2018

    Note:* Includes Wavin Africa, Overseas, China, Australia and Middle East                              Note:* Includes USA, Canada, Oman, Mexico, South Africa and Czech Republic
    (1)                                                                                                   (1) The 4Q15 EBITDA figure includes the effect of discontinued operations
      EBITDA figures exclude restructuring costs and a benefit of US$17MM in 4Q13

    A global leader in the supply of plastic pipe                                                        A global leader in high-density polyethylene
      systems and solutions for both, above, and                                                           conduit duct and pressure pipe solutions.
      below ground applications.                                                                          Allows for expansion in Telecom, Datacom and
    Has close to $1.3 billion in annual revenue.                                                          Energy Piping markets.
    Targeting opportunities in Europe, Asia                                                              Adds presence in India, South Africa and the
      Pacific and Middle East.                                                                             Middle East.

    13
Acquisition for Fluent Business Group
Netafim to incorporate ~higher value-added products
 A global leader of technologically
  advanced irrigation solutions.
        Transformational acquisition in specialty products
         and industrial solutions with specific expertise in
         water.
        Leader in advanced technology irrigation
         solutions.
        Consistent with the company’s growth strategy
         into higher value-added products, increasing
         Fluent’s portfolio of specialty products.
        Expands global footprint by strengthening
         presence in key markets such as U.S., India, and
         LatAm, and opens new regions such as Middle
         East, Africa and Australia.
        Revenues in 2017 were close to $950 million and
         EBITDA Margin of 14%.
        Brings strong R&D and technically advanced
         capabilities.
14
Acquisition for Vinyl Business Group
Vestolit
                           Vestolit EBITDA Margin
                           (% of Total Revenue)
                          16.0%                                 14.4%
                                                                                                14.5%
                          14.0%
                                                                                                        Margin 2018 = 12.4%
                                            11.6%                                    11.2%
                          12.0%
                                                                        10.1%
                          10.0% 8.4%            8.8%                                                    Margin 2015 = 8.8%
                                                                                         7.8%
                           8.0%
                           6.0%
                           4.0%
                           2.0%
                           0.0%
                                       1Q                  2Q                   3Q              4Q

                                                    2015   2016         2017    2018

            Europe’s 6th largest PVC manufacturer.
            Europe’s only manufacturer of High Impact Suspension PVC (HIS-PVC) for
             weather-resistant windows and is Europe’s Third-largest producer of
             paste PVC for floors and wallpapers.
            Keeping with the strategy of becoming a global, vertically integrated
             company with a focus on high-end, specialized products.
            Expands European footprint by entering a new market segment and
             acquire new technology.
15
Building Mexichem’s Specialty Products Portfolio
                   Specialty PVC Resins Producers Worldwide (Kton)
                   500

                   400
  CAPACITY (KMT)

                   300

                   200

                   100

                     -
                         Mexichem   Westlake   Formosa   Hanwha   INEOS   LG Group   ChemChina Saint-Gobain   Alain de   Open Gate
                                                Group    Group                                                Krassny     Capital

Source: IHS 2017

16
Acquisition for Vinyl Business Group
Vinyl Compounds to incorporate ~40 m in sales to Compounds Business Unit

      U.K. leading supplier of PVC compounds
         Adds scale to Mexichem’s U.K. operations.
         Targeting opportunities in India and Southeast Asia.
         Expands the portfolio of specialty products.
         Enabled further vertical integration of Compound Business through stabilizer technologies
          and recycled PVC capabilities.
         Brings synergies to Vinyl Business group through Vinyl Compounds’ PVC resins and
          plasticizers.
         Key drivers for the demand are related to:
                    o Building & Construction
                    o Consumer Goods
                    o Footwear

17
Acquisition for Vinyl Business Group
Sylvin Technologies Inc. ~29 m in sales to Compounds Business Unit

      A niche PVC compounds manufacturer based in Denver, Pennsylvania
         Customer-focused business model.
         Serving a broad range of industries, such as: automotive, general purpose/industrial,
          specialty, medical, building and construction and wire and cable market.
         A strong team and application development capabilities.
         Sylvin’s key raw materials are PVC resin, plasticizers and stabilizers, which should bring
          synergies to Mexichem’s Vinyl operations.

18
Improvement of Profitability Ratios
Mexichem WACC ~7.5%

                            ROE (%)                    15.2%
                                                                                               ROIC (%)
                      Mexichem Group                                                        Mexichem Group
                                                                                                                                  9.5%

                                                                                                             8.2%
                                      9.8%
                                                                           6.5%             6.7%
                     8.7%
     7.0%

     2015            2016             2017          LTM Sep 2018           2015             2016              2017         LTM Sep 2018

      ROE: Income from continuing operations / Adjusted Average Equity from continuing operations.
      ROIC: Adjusted NOPAT for continuing operations/Adjusted Equity from continuing operations + Liabilities with cost – Cash.
      Income from continuing operations and NOPAT (EBIT-taxes) consider trailing twelve months.

19
Margin Growth vs Organic
          Volume Growth

20
Driving Margin Growth Vs. Volume Growth
Closer To Our End Consumers -Fluent
                                               Chlorine &
                                       Salt
                                                Caustic           PVC Resin
                                                            VCM             Compounds Fluent
                                                                  Specialty
                                      Ethane   Ethylene

21
                                                                                               21
Focus on Higher Margin Products
In 2016 we discontinued operations of pressure pipes and shifted that capacity
to Datacom pipes

                                        Datacom pipes have higher
                                        margins than pressure pipes

22
Cross selling of Products (Netafim, Fluorspar in
Brazil, HIS-PVC in Latam)
The company cross sells products
with attractive margins in other
regions, among others:
1) Fluorspar and refrigerant gases
    in Brazil,
2) HIS-PVC (high impact modified
    polyvinylchloride copolymer) a
    Vestolit product in LatAm, and,
3) Expects to sell PVC pipes to
    Netafim.
                                      The broad high vale-added portfolio
                                      product is expected to expand with the
                                      acquisition of Netafim.

23
Backward Integration to
     Reduce Production Cost

24
Vertical Integration: Ethylene
    Ethylene is our Most Important Raw Material
    Ethylene Price Components
                                                                     Polyethylene’s Cost Structure
       December 2014                                                 PE Pipe Cost Structure
        Ethane          Others                Ethylene Margin                                        Others
         27%             10%                        63%              Ethylene 82%                     18%

                                                                     PVC’s Cost Structure
                                                                     PVC Pipe Cost Structure
                                                                                                     Others
                                                                     Ethylene 29%                     71%
       December 2017
               Ethane              Others          Ethylene Margin
                38%                 22%                              PVC Resin Cost Structure
                                                         39%                                         Others
                                                                     Ethylene 39%                     61%

Ethylene Cracker (JV w/ OXY) =
                                                                     VCM Cost Structure
•        ~70% of the Vinyl’s Group ethylene needs.                   Ethylene 49%
                                                                                                     Others
                                                                                                      51%
•        ~90% of the NA Vinyl’s Group ethylene
         needs.
    Source: Company fillings,
    *Once Ethylene cracker is fully operational.

25
Vertical Integration: Ethylene
 Estimated PVC Cost-Curve by Region, USD/Metric ton and million metric tons

                                    Europe                   Northeast Asia (KTJ)           Middle East   Northeast Asia (China)   Former USSR

                                    South America            North America                  Africa        Asia and Pacific
                                                                                                                                                  Global demand:
                                                                                                                                                 ~48 MM metric tons
 Cash cost per ton                                                                  Acetylene based                                                   (2021)

     1,000
      800

      600
                                                                                                                   Before
      400
      200
        0

       The cracker positions Mexichem on the lowest part of the cost-curve globally

Source: McKinsey petrochemical models, IHS
1 2021 capacity are estimates from HIS. 2 Effective capacity is given as 90% of nameplate capacity

26
Ethylene, Ethane, Caustic soda & PVC resin prices

     Source: IHS

27
Vinyl and Fluor Business
          Group Outlook

28
Improving Outlook for PVC
     Global Supply, Demand and Operating Rate

                   70,000                                                                                         100
                                                                                                                  90
                   60,000
                                                                                                                  80
                   50,000                                                                                         70
       (‘000 MT)

                                                                                                                  60
                   40,000
                                                                                                                  50
                   30,000
                                                                                                                  40

                   20,000                                                                                         30
                                                                                                                  20
                   10,000
                                                                                                                  10
                       0                                                                                          0
                            2011     2012     2013     2014      2015     2016    2017   2018E   2019E    2020E

                            Total Capacity ('000 MT)          Total Demand ('000 MT)     Operating rate (%)

         Source: IHS

29
Improving Outlook for PVC
 There is limited additional global PVC capacity being built in the next 4 years

                                                                                                             ~4.5 million metric tons
                                          PVC Global Capacity Expansions
                             5.0

                            4.0                                                                                 India,
                                                                                                                China,
     Million Metric Tons

                            3.0
                                                                                                       China, Philippines,
                                                                                                        India   Egypt      China,
                            2.0                                                                                            Egypt,
                                                                                                                           Baltics
                            1.0

                            0.0

                             -1.0

                             -2.0
                                          11      12         13         14    15   16        17         18         19        20          21

                           North America               Northeast Asia        ROW    Hypothetical NAM               Hypothetical Europe

30                          Source: IHS
Improving Outlook for PVC
PVC is the third most popular plastic in the world and the largest sourced
material in the Building & Construction market, followed by PE & PP

        Building &
                                                                             19.7%
      Construction

         Packaging                                                           39.9%

        Automotive                                                           8.9%

        Electrical &
                                                                             5.8%
         Electronic

              Others                                                         25.7%

31   Source: Plastics - The facts 2016 by PlasticsEurope
Improving Outlook for PVC
     China’s Share of Global Capacity is 44%

                                                          PVC Capacity
                            70,000

                            60,000

                            50,000
       (‘000 MT)

                            40,000

                            30,000

                            20,000

                            10,000

                                 0
                                     2010   2011   2012   2013   2014    2015   2016   2017   2018E 2019E 2020E

                                                          Worldwide     China
                   Source: IHS

32
U.S. International Trade Commission decision and
 Price Behavior
        After a year-long investigation process by the U.S. Department of Commerce, on
         February 22, 2017 they announced that R-134a from China were being dumped in the
         U.S. market at prices below fair value and prescribed antidumping duties ranging from
         148.79% to 167.02%.

        The American HFC Coalition believes the decision is fully supported by :1) The
         industry developed R-134a to succeed earlier-generation refrigerants without any
         negative impact on the ozone layer, 2) The industry invested substantial sums to
         manufacture R-134a in the U.S. for automotive air-conditioning, stationary air-
         conditioning, and other applications.

        As a result of the dumped imports, the U.S. industry has suffered persistently low
         price levels and poor operating results.

        The imposition of antidumping duties is a positive step to restore conditions of fair
         trade in this market.

        As a consequence of the above mentioned R-134a refrigerant gas prices increased
         approximately by 25% on average in 2017.

33
NAFTA Impact on Mexichem

34
U.S. Fluorspar Demand – Supply Summary
     U.S. Fluorspar Demand 2014 – 2017                                             U.S. Acidspar Supply
                              2014          2015            2016    2017
                                                                                              Spain /
        Metspar                    108             90          55      70                     Others
                                                                                China          3%
                                                                                19%
        Acidspar                   291            331         310     330

        Total                      399            421         365     400
        Fluorspar                                                            Vietnam
                                                                               8%
                                                                                                          Mexichem
       • Metspar: 100% used as a fluxer in the steel                          South                         58%
         industry, particularly for stainless and                             Africa
         specialty steels.                                                    11%
                                                                                    Mexico
                                                                                   (Others)
       • Acidspar: Aprox. 90% used for HF                                            1%
         production (Honeywell, Chemours) and
         10% for other applications.                                        • Metspar: Mexichem is currently supplying
                                                                              99% of total consumption (2016-2017).
       • The U.S. does not produce Metspar and
         has some small Acidspar mines (Hastie)                             • Acidspar: Mexichem supplies approx. 58%
         that have not been producing in the last few                         of the US consumption. Other sources are
         years, but are still in development.                                 from Mexico (Muzquiz), Vietnam, South
                                                                              Africa, China.
     Source: Roskill, IM,USGS, Trademap Internal Analysis

35
Mexichem’s Fluor exports/Vinyl’s imports to the U.S.
 NAFTA tariffs and MFN tariffs from WTO (World Trade Organization)

                                                                             Exports (MX-USA)          Sales in 2017
                        Product Name                                           NAFTA MFN USA              US (MM)
                        Acid grade fluorspar low arsenic                           Ex.    3.70%                  N.A
                        Acid grade fluorspar (ceramic, fine and standard)          Ex.       Ex.   $           43.1
                        Aluminum fluoride                                          Ex.    3.70%    $           17.5
                        HF                                                         Ex.       Ex.                 N.A
                        Anhydrous HF                                               Ex.       Ex.   $          104.7
                        Metallurgic fluorspar (lamas, big stone, standard)         Ex.       Ex.   $           15.6
                        Sulfuric acid                                              Ex.       Ex.                 N.A

                        Total Sales to the USA                                                     $         180.9
                        As % of 2017 total consolidated sales                                                 3.1%

                                                                             Imports (USA-MX) Purchases in 2017
                        Product Name                                         NAFTA     MFN USA    US (MM)
                        Vinyl Chlorine Monomer (VCM)                               Ex.      Ex. $         364.9

     Source: WTO and Company Filings.

36
Lower Capex Cycle and Solid
           Balance Sheet

37
Ending a Capital Cycle
(in USD terms)

       Capex
                                                              666

                                                       460
                                                                     414

                                                302                         289
                     253                 251
                                                                                   199

                     2011                2012   2013   2014   2015   2016   2017   9 M1 8

     2018e figure includes CAPEX for NETAFIM.

38
Manageable Debt Profile & Long-Term Maturity Profile                                                                         Investment Grade
                                                                                                                             Fitch Ratings    BBB
                                                                                                                             S&P              BBB-
                                                                                                                             Moody’s          Baa3
Long-Term Debt Schedule
US$MM, as of September 30th, 2018                                                       Debt Average Life
                                                                                         14.1 years
                                                                                        Weighted Average
                                                                                         Cost of Debt 5.09%

     Most Debt at Hold Co Level                 Alignment of Debt to Revenue Currency                     Conservative Leverage Ratios
     Debt by Division (3Q18)                    Debt by Currency (Swapped, 3Q18)

               1% 6%                                             3%                                        Total Debt / EBITDA     Net Debt / EBITDA
             3%
                                                                                                               3.0x                 2.9x
                                                       24%                                                              2.6x  2.6x          2.5x
                                                                                                        2.4x
                                                                                                                      2.0x    1.9x     1.8x             1.9x

                                                                                                                                               1.2x
                            90%                                         73%                                   1.0x

       Holding    Vinyl   Fluor        Fluent            US$     Euro     Others
                                                                                                          2013       2014    2015    2016     2017    3Q18
                                                   US$1.5B revolving credit facility
             Source: Company filings                      (100% available)
39           Third Quarter 2018 Earnings
Mexichem of the Future

40
We Have Created The World’s First Agricultural Brain
Based on 50 Years of Agricultural and Hydraulic Knowledge, NetBeat™ is the World’s First Automated Precision Irrigation System

                                       NetBeat™ combines real-time
                                       data with Dynamic Crop Models™

        to personalize irrigation                                       while minimizing water
        programs and optimize yields                                    and resource use
Netafim
 • Please see video (NetBeat and Ramthal Community in India)

     -   NetBeat™ - the first irrigation system with a brain!

         https://www.netafim.com/49a475/globalassets/digital-farming/netbeat/netbeat_online_07.mp4

     -   Ramthal Community

         https://www.netafim.com/48e8ab/globalassets/demo/homepage/empowering-regional-
         prosperity-through-a-multi-stakeholder-agro-water-management-project.mp4

42
44
Management Team

45
Executive Leadership Team (ELT)

                          Rodrigo Guzmán Perera                        Paresh Chari                              Ran Maidan,                                Carlos Manrique Rocha
                          Chief Financial Officer (CFO)                President, Fluent Business Group          President and CEO,​Netafim Ltd​            President, Vinyl Business Group

Daniel Martínez Valle     Sameer S. Bharadwaj
                          President, Compounds Business Unit
                                                                       Alejandra Rodríguez Sáenz
                                                                       Corporate Vice-President, Human Capital
                                                                                                                 Pedro Martínez Puig
                                                                                                                 Corporate Vice-President, IT
                                                                                                                                                            Francisco Hernández
                                                                                                                                                            Corporate Vice-President, Legal
Chief Executive Officer   President, Fluor Business Group

(CEO)

                          Mary Gorges                                  Cristina Gil                              Jorge Luis Guzmán Mejía
                          Vice-president of Corporate Communications   Director Corporate Affairs                Corporate Vice-President, Internal Audit

46
Thank You

47
APPENDIX

48
Brief Summary of Results (Q3 2018)
 1                                                                           2                  EBITDA by quarter (US mm)

               mm US$                              Third Quarter

Financial Highlights                       2018        2017        %Var.
Net sales                                  1,785       1,503        19%
Operating income                            270         201         34%
EBITDA                                      375         299         25%
EBITDA margin                              21.0%      19.9%        107 bps
Net majority income                         82          61          34%
Cash Flow before dividends                  157         151          4%
                                                                                   Q'1                 Q'2               Q'3                  Q'4
Free cash flow                              83          71          17%
                                                                                         2013   2014     2015     2016    2017         2018

                        Quarter                                      Sales                                   EBITDA
 3                      mm US$                      3Q18             3Q17        %Var.          3Q18          3Q17             %Var.
            Vinyl                                    621              579         7%            151             133            14%
            Fluent                                   1,003            785        28%            140             107            31%
            Fluor                                    210              177        19%             94             68             38%
            Eliminations/ Holding                    (49)            (38)        29%            (10)            (9)            11%
            Mexichem Consolidated                    1,785           1,503       19%            375             299            25%

49           Third Quarter 2018 Earnings
Sales by Region Destination

50   Third Quarter 2018 Earnings
Strong Performance by Business Group                                                                                                                                                                                     X%           EBITDA margin

                                  Vinyl            Fluent            Fluor                     5,509                                                                Vinyl           Fluent             Fluor
                                                                               26%               644                  * Constant currency &                                                                      9%                 4,771
Revenues
                                                                 4,360                                               Organic Revenue Growth                                                        4,360
                                                                                                                                                                                                                                    630
                                                                   495                                                                                                                              495
                  19%
                                                                                               3,093                                                8%
                                   1,785                         2,257                                                                                                                             2,257                            2,416
    1,503                                                                                                                             1,503                         1,623
                                    210                                                                                                                               210
      177                                                                                                                               177
      785                          1,003                                                       1,908                                    785                           839                                                           1,861
                                                                 1,749                                                                                                                             1,749
      579                           621                                                                                                 579                           623
    3Q'17                         3Q'18                         9M'17                         9M'18                                  3Q'17                         3Q'18                          9M'17                         9M'18

                                                                                                                       * Constant currency &
EBITDA                                                                                                                Organic EBITDA Growth
                                                                                             20.5%
                                  Vinyl           Fluent             Fluor                                                                                           Vinyl            Fluent            Fluor                       21.6%
                                                                             36%           1,128                                                                                                                 24%
                                                                                                                                                                                                                               1,029
                                                              19.0%                                        44.1%                                                                                  19.1%
                                                                                             284                                                                    22.0%                         832
                  25%                                         829                                                                                    18%                                                                        277         44.0%
                                                                                                                                      20.1%                                                       192
                               21.0%                           192         38.8%                                                                                                                               38.8%
  19.9%                                                                                      423           13.7%                                                                                                                337
                                375          44.8%                                                                                                                  357          44.8%                                                      13.9%
   299         38.4%                                           309         13.7%
                                                                                                                                     302           38.4%                                          312          13.8%
                                 94          14.0%                                                                                                                   94          14.7%
   68          13.6%                                                                                                                  68           14.0%
   107                          140                                        20.4%             464          24.3%                       110                           123                           357          20.4%            458         24.6%
                                             24.3%             357                                                                                                               24.2%
               23.0%                                                                                                                               23.0%            151
   133                          151                                                                                                   133
  3Q'17                       3Q'18                         9M'17                         9M'18                                    3Q'17                         3Q'18                          9M'17                         9M'18
    Note: Breakdowns consider figures before eliminations. Total figures consider eliminations.
    Organic = means that it will exclude: i) Netafim´s results for the quarter; ii) CADE and Netafim Ltd. Acquisition related expenses; iii) Brazil Tax legal settlement benefit, and iv) FX translation effects without consider
    any positive or negative effect from Venezuela.

    51                  Third Quarter 2018 Earnings
EBITDA Evolution

                    55%                   60%
              of Group EBITDA         of Group EBITDA
            produced in Specialty   produced in Specialty
                  Products                Products

52   Third Quarter 2018 Earnings
Strong Cash Generation Despite Seasonality
                                                    Third Quarter                   January - September

                                          2018          2017        %Var.   2018           2017           % Var.
                 mm US$
EBITDA                                     375           299        25%     1,128           829            36%

Taxes paid                                 (58)         (34)        71%     (190)          (104)           83%

Net interest paid                          (49)         (35)        40%     (143)          (107)           34%

Bank commissions                           (7)           (8)        -13%    (30)           (21)            43%

Exchange rate gains (losses)               (8)           (5)        60%     (40)           (17)           135%

Change in trade working capital (1) (2)    (33)           0          N/A    (294)          (208)           41%     1) PMV's insurance A/R is not
Operating cash flow before capex           220           217         1%      431            372            16%        included in trade working
                                                                                                                      capital calculation.
   CAPEX (Organic)                         (61)         (54)        13%     (186)          (149)           25%

    CAPEX (Total JV)                       (2)          (19)        -89%    (13)           (105)          -88%     2) Trade working capital
                                                                                                                      variation (Sep 18 vs Dec 17)
    CAPEX JV (OXY share)                       -          6         -100%     -             45            -100%
                                                                                                                      includes Netafim’s proforma
   NET CAPEX JV                            (2)          (13)        -85%    (13)           (59)           -78%        results for comparative
                                                                                                                      purposes.
Total CAPEX (organic & JV)                 (63)         (66)        -5%     (199)          (208)           -4%

Cash flow before dividends                 157           151         4%     232             164            41%

Shareholders' dividend                     (74)         (80)        -8%     (210)          (132)           59%

Free cash flow                                 83        71         17%      22             32            -31%

PMV's insurance A/R                            -          -                  268             -

Free cash flow after Insurance                 83        71         17%      290            32            806%

  53             Third Quarter 2018 Earnings
USD in millions
Balance Sheet                      Balance sheet                              Sep 2018     Dec 2017

                                   Total assets                                   10,318           9,759

                                    Cash and temporary investments                  879            1,900

                                    Receivables                                    1,349            975

                                    Inventories                                     904             675

                                    Others current assets                           310             403

                                    Property, plant and equipment, Net             3,482           3,626

                                    Intangible assets and Goodwill                 3,137           1,910

                                    Long term assets                                257             270

                                   Total liabilities                               6,814           6,078

                                    Current portion of long-term debt               368              45

                                    Suppliers                                      1,449           1,362

                                    Other current liabilities                       930             723

                                    Long-term debt                                 3,267           3,210

                                    Long-term employee benefits                     185             186

                                    Long-Term deferred tax liabilities              197             231

                                    Other long-term liabilities                     418             321

                                   Consolidated shareholders'equity                3,504           3,681

                                    Minority shareholders' equity                   889             878

                                   Majority shareholders' equity                   2,615           2,803

                                   Total liabilities & shareholders' equity       10,318           9,759
54   Third Quarter 2018 Earnings
Income Statement
                                                                        Third Quarter                January - September
                                  USD in millions

               Income Statement                                 2018         2017        %     2018          2017           %

                 Net sales                                      1,785        1,503      19%    5,509         4,360         26%
                 Cost of sales                                  1,289        1,129      14%    3,964         3,289         21%

               Gross profit                                     497           374       33%    1,545         1,071         44%

                 Operating expenses                             227           173       31%    732            525          39%

               Operating income (loss)                          270           201       34%    813            546          49%

                 Interest expenses (income) & bank commisions    57            43       33%    173            129          34%
                 Exchange rate, net                              12            3        300%    43             38          13%
                 Monetary position                               20           (2)       N/A    (6)            (4)          50%
                 Financial Costs                                 89            44       102%   210            163          29%
                 Equity in income of associated entity          (2)           (1)       100%   (4)            (1)          300%
               Income (loss) from continuing operations
                                                                183           157       17%    607            385          58%
               before income tax
                 Cash tax                                        54            34       59%    168            104          62%
                 Deferred taxes                                  8             28       -71%    22             47          -53%
                 Income tax                                      62            62       0%     190            150          27%

               Income (loss) from continuing operations         120            95       26%    417            234          78%

                 Discontinued operations                        (1)           (4)       -75%    19             1       1800%

               Consolidated net income (loss)                   120            91       32%    437            236          85%

                 Minority stockholders                           37            30       23%    113             56          102%

               Net income (loss)                                 82            61       34%    323            180          79%

               EBITDA                                           375           299       25%    1,128          829          36%

55   Third Quarter 2018 Earnings
Results by Business Group
                                                                     Third Quarter               January - September
                            mm US$

     Vinyl                                                    2018       2017        %Var.    2018       2017      % Var.

     Volume (K tons)                                           646        635         2%      1,944      1,916       1%

     Total sales*                                              621        579         7%      1,908      1,749       9%

     Operating income                                           99        84         18%       315        227       39%

     EBITDA                                                    151        133        14%       464        357       30%

     *Intercompany sales were $48 million and $37 million in 3Q18 and 3Q17, respectively. And as of September 2018 and 2017
     were $135 million and $134 million, respectively.

                                                                     Third Quarter               January - September
                            mm US$

     Fluor                                                    2018       2017        %Var.    2018       2017      % Var.

     Sales                                                     210        177        19%       644        495       30%

     Operating income                                           82        56         46%       247        153       61%

     EBITDA                                                     94        68         38%       284        192       48%

56   Third Quarter 2018 Earnings
Results by Business Group

                                             Third Quarter             January - September
                            mm US$

     Fluent                          2018        2017        %Var.   2018     2017    % Var.

     Sales                           1,003        785        28%     3,093    2,257    37%

      Fluent LatAm                   270          279        -3%     816       818      0%

      Fluent Europe                  349          357        -2%     1,086    1,006     8%

      Fluent USA & Canada            152          120        27%     415       341     22%

      Fluent AMEA                     35          34          3%     118       108      9%

      Netafim                        206           -                 669        -

      Intercompany eliminations      (8)          (5)        60%     (11)     (15)     -27%

     Operating income                 95          71         34%     297       203     46%

     EBITDA                          140          107        31%     423       309     37%

57   Third Quarter 2018 Earnings
Revenues & EBITDA wo FX effect
                   3Q17                                           3Q18        3Q18    3Q18/3Q17
                                          mm US$
                   Sales                                 Sales           FX   Total     % Var
                    579      Vinyl                        621            2     623       8%
                    785      Fluent                       1,003          52   1,055     34%
                   1,364     Ethylene (Vinyl + Fluent)    1,624          54   1,678     23%
                    177      Fluor                        210            -     210      19%
                    (38)     Eliminations / Holding       (49)           -    (49)      29%
                   1,503     Total                        1,785          54   1,839     22%

                   3Q17                                           3Q18        3Q18    3Q18/3Q17
                                          mm US$
                  EBITDA                                 EBITDA          FX   Total    % Var
                    133      Vinyl                        151            -     151      14%
                    107      Fluent                       140            7     147      37%
                    240      Ethylene (Vinyl + Fluent)    291            7     298      24%
                     68      Fluor                         94            -     94       38%
                    (9)      Eliminations / Holding       (10)           -    (10)      11%
                    299      Total                        375            7     382      28%

58   Third Quarter 2018 Earnings
Revenues wo FX effect - Fluent

                   3Q17                                          3Q18        3Q18    3Q18/3Q17
                                         mm US$
                   Sales                                 Sales          FX   Total     % Var
                    279      Fluent LatAm                 270           30    300       8%
                    357      Fluent Europe                349           10    359       1%
                    120      Fluent US/Canada             152           -     152      27%
                     34      Fluent AMEA                  35            2     37        9%
                     -       Netafim                      206           10    216
                    (5)      Intercompany Eliminations    (8)           -     (8)      60%
                    785      Total                       1,003          52   1,055     34%

59   Third Quarter 2018 Earnings
In 2017 We Achieved Record Results and Expect Another Year of
Strong Growth in 2018
 In 2017 we met high-end of EBITDA guidance range
 For 2018 we expect an EBITDA growth to be between 25%-30%

Revenue ($mm)                                                              Adj EBITDA ($mm) and Margin (%)
                                                                                                             19.0%
                                                                                       16.0%      16.7%
     $5,485          $5,584                     $5,828                       14.8%
                                     $5,344                                                                  $1,106
                                                                             $814       $895      $895
                                                                                                                      EBITDA
                                                                                                                      Margin
                                              +9%                                                    +223bps

      2014             2015           2016          2017                     2014       2015       2016       2017

 EBITDA1 – non-M&A capex ($mm) and Conversion (%)2
                                    78.0%
     74.0%                                          74%
                     69.7%
                                                $817
                                                                               Our cash conversión is above 70%
                                     $722                  asd
     $657            $634
                                                                               In 2017 FCF increased 123% from
                                                           (EBITDA – non
                                                           M&A capex) /         $90m to $201m
                                                           EBITDA

     2014             2015           2016       2017

60           Third Quarter 2018 Earnings
Closer to Our End Customers                       Chlorine &
  Housing Catalogue in Brazil:              Salt
                                                     Caustic
                                                                 VCM
                                                                       PVC Resin
                                                                                   Compounds   Fluent
                                                                       Specialty
                                           Ethane   Ethylene

WATER FLOW SOLUTIONS             WATER STORAGE SOLUTIONS

                                                                       ACCESORIES

                                  GAS SOLUTIONS

                                  ELECTRIC SOLUTIONS

  61

                                                                                                        61
Closer to Our End Customers                              Chlorine &
  Infrastructure Catalogue in Brazil:              Salt
                                                            Caustic
                                                                        VCM
                                                                              PVC Resin
                                                                                          Compounds   Fluent
                                                                              Specialty
                                                  Ethane   Ethylene

SEWAGE SYSTEM SOLUTIONS                 HYDRAULIC SOLUTIONS

   62

                                                                                                               62
Vertical Integration Tested in 4Q14
 Prices of oil and ethylene falling rapidly
                                                                                                                                                                                                                                                                                                                                                                                                                                         Chlorine &
                                                                                                                                                                                                                                                                                                                                                                                                                                 Salt
                                                                                                                                                                                                                                                                                                                                                                                                                                          Caustic
USD/ ton                                                                                                                                                                                                                                                                                                                                                                              USD/ barrel                                                     VCM
                                                                                                                                                                                                                                                                                                                                                                                                                                                            PVC Resin
                                                                                                                                                                                                                                                                                                                                                                                                                                                                        Compounds   Fluent
                                                                                                                                                                                                                                                                                                                                                                                                                                                            Specialty
 2,000                                                                                                                                                                                                                                                                                                                                                                                                                 120      Ethane   Ethylene

                                                                                                                                                                                                                                                                                                                                                                                                                       100
 1,500
                                                                                                                                                                                                                                                                                                                                                                                                                       80
 1,000                                                                                                                                                                                                                                                                                                                                                                                                                 60
                                                                                                                                                                                                                                                                                                                                                                                                                       40
     500
                                                                                                                                                                                                                                                                                                                                                                                                                       20
       0                                                                                                                                                                                                                                                                                                                                                                                                               0
           Jan-2010

                                                       Sep-2010

                                                                             Jan-2011

                                                                                                                         Sep-2011

                                                                                                                                               Jan-2012

                                                                                                                                                                                           Sep-2012

                                                                                                                                                                                                                 Jan-2013

                                                                                                                                                                                                                                                             Sep-2013

                                                                                                                                                                                                                                                                                   Jan-2014

                                                                                                                                                                                                                                                                                                                               Sep-2014

                                                                                                                                                                                                                                                                                                                                                     Jan-2015

                                                                                                                                                                                                                                                                                                                                                                                                 Sep-2015
                                            Jul-2010

                                                                                                              Jul-2011

                                                                                                                                                                                Jul-2012

                                                                                                                                                                                                                                                  Jul-2013

                                                                                                                                                                                                                                                                                                                    Jul-2014

                                                                                                                                                                                                                                                                                                                                                                                      Jul-2015
                      Mar-2010
                                 May-2010

                                                                                        Mar-2011
                                                                                                   May-2011

                                                                                                                                                          Mar-2012
                                                                                                                                                                     May-2012

                                                                                                                                                                                                                            Mar-2013
                                                                                                                                                                                                                                       May-2013

                                                                                                                                                                                                                                                                                              Mar-2014
                                                                                                                                                                                                                                                                                                         May-2014

                                                                                                                                                                                                                                                                                                                                                                Mar-2015
                                                                                                                                                                                                                                                                                                                                                                           May-2015
                                                                  Nov-2010

                                                                                                                                    Nov-2011

                                                                                                                                                                                                      Nov-2012

                                                                                                                                                                                                                                                                        Nov-2013

                                                                                                                                                                                                                                                                                                                                          Nov-2014

                                                                                                                                                                                                                                                                                                                                                                                                            Nov-2015
                          Ethylene-Spot USA (Left)                                                                                                                              PVC Export USA (Left)                                                                                                                          Crude Oil WTI (Right)
 Source: IHS (formerly CMAI)

 Vinyl Business Group                                                                                                                                                                                                                                                                                                                                                                                                        Fluent Business Group
 * EBITDA USD$MM                                                                                                                                                                                                                                                                                                                                                                                                             * EBITDA USD$MM
                                                                                                                                                                                                                                                                                                                                                                                                                                                                        8%
                                            14%                                                                                                                                                                                                                                                                                                                                                                                 10%                                     66
                                             64
                                                                                                                                               66%                                                               5%                                                                           ~30M USD                                                                                                                            48
                                                                                                                                                                                                                                                                                                                                                                                                                                                 59%
                                                                                                                                                                                                                      22

                                                       4Q13                                                                                                                                                      4Q14                                                                                                                                                                                                            4Q13                                   4Q14

* EBITDA without FX in 4Q14, and non recurrent effects of 4Q13

63
Margin Expansions in 4Q15
 Prices of oil, ethylene and PVC resins
                                                                                                                                                                                                                                                                                                                                                                                                                                              Chlorine &
                                                                                                                                                                                                                                                                                                                                                                                                                                    Salt
                                                                                                                                                                                                                                                                                                                                                                                                                                               Caustic
USD/ ton                                                                                                                                                                                                                                                                                                                                                                               USD/ barrel                                                           VCM
                                                                                                                                                                                                                                                                                                                                                                                                                                                                   PVC Resin
                                                                                                                                                                                                                                                                                                                                                                                                                                                                                Compounds   Fluent
                                                                                                                                                                                                                                                                                                                                                                                                                                                                   Specialty
 2,000                                                                                                                                                                                                                                                                                                                                                                                                                  120        Ethane         Ethylene

                                                                                                                                                                                                                                                                                                                                                                                                                        100
 1,500
                                                                                                                                                                                                                                                                                                                                                                                                                        80
 1,000                                                                                                                                                                                                                                                                                                                                                                                                                  60
                                                                                                                                                                                                                                                                                                                                                                                                                        40
      500
                                                                                                                                                                                                                                                                                                                                                                                                                        20
       0                                                                                                                                                                                                                                                                                                                                                                                                                0
            Jan-2010

                                                        Sep-2010

                                                                              Jan-2011

                                                                                                                          Sep-2011

                                                                                                                                                Jan-2012

                                                                                                                                                                                            Sep-2012

                                                                                                                                                                                                                  Jan-2013

                                                                                                                                                                                                                                                              Sep-2013

                                                                                                                                                                                                                                                                                    Jan-2014

                                                                                                                                                                                                                                                                                                                                Sep-2014

                                                                                                                                                                                                                                                                                                                                                      Jan-2015

                                                                                                                                                                                                                                                                                                                                                                                                  Sep-2015
                                             Jul-2010

                                                                                                               Jul-2011

                                                                                                                                                                                 Jul-2012

                                                                                                                                                                                                                                                   Jul-2013

                                                                                                                                                                                                                                                                                                                     Jul-2014

                                                                                                                                                                                                                                                                                                                                                                                       Jul-2015
                       Mar-2010
                                  May-2010

                                                                                         Mar-2011
                                                                                                    May-2011

                                                                                                                                                           Mar-2012
                                                                                                                                                                      May-2012

                                                                                                                                                                                                                             Mar-2013
                                                                                                                                                                                                                                        May-2013

                                                                                                                                                                                                                                                                                               Mar-2014
                                                                                                                                                                                                                                                                                                          May-2014

                                                                                                                                                                                                                                                                                                                                                                 Mar-2015
                                                                                                                                                                                                                                                                                                                                                                            May-2015
                                                                   Nov-2010

                                                                                                                                     Nov-2011

                                                                                                                                                                                                       Nov-2012

                                                                                                                                                                                                                                                                         Nov-2013

                                                                                                                                                                                                                                                                                                                                           Nov-2014

                                                                                                                                                                                                                                                                                                                                                                                                             Nov-2015
                           Ethylene-Spot USA (Left)                                                                                                                              PVC Export USA (Left)                                                                                                                          Crude Oil WTI (Right)
                                                                                                                                                                                                                                                                                         Source: IHS (formerly CMAI)
Vinyl Business Group                                                                                                                                                                                                                                                                                                                                                                                                        Fluent Business Group
Positive performance on PMV + Resins, compounds & derivatives                                                                                                                                                                                                                                                                                                                                                               Amid FX fluctuations, EBITDA margin expansions
EBITDA USD$MM
                                                                                                                                                                                 15%                                                                                                                                                                                                                                        EBITDA USD$MM                                  12%
100
                                                                                            244%                                                                                            74
                                                                                                                                                                                                                                                                                                                                                                                                                            100             8%               26%               83
                                                                                                                                                                                                                                                                                                                                                                                                                                             66
                                  5%
                                                   22

  0                                                                                                                                                                                                                                                                                                                                                                                                                          0
                                             4Q14                                                                                                                                      4Q15                                                                                                                                                                                                                                                 4Q14                          4Q15

64
Thank You

65
You can also read