Institucional Presentation
          2020
←
→
Page content transcription
If your browser does not render page correctly, please read the page content below
Institucional Presentation
2020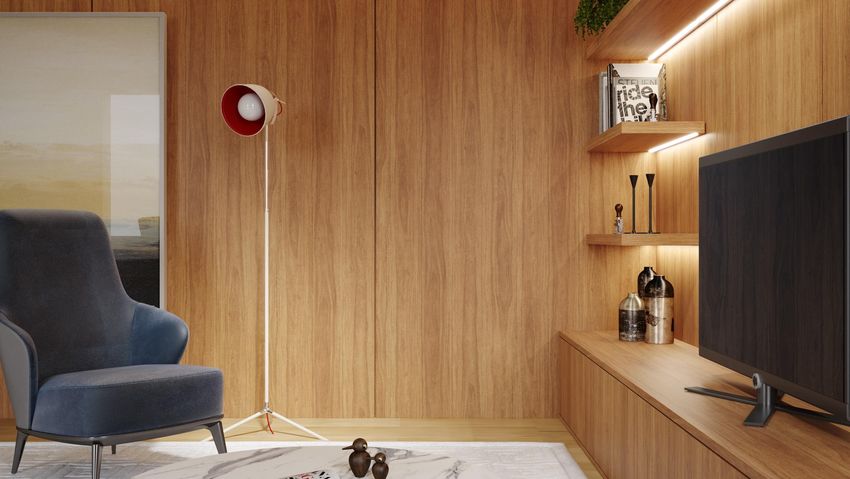
Solutions for better living

                                                                    Disclaimer
                              The information here in has been prepared by Duratex S.A.
                               and does not represent any form of prospectus regarding
                                the purchase or subscription to the company’s shares or
                                                                             securities.
                                  This material contains general information relating to
                               Duratex and the markets in which the company operates.
                                No representation or guarantee, expressed or implied, is
                                  made herein, and no reliance should be placed on the
                              accuracy, justification or completeness of the information
                                                                                provided.
                                  Duratex does not offer any assurances or guarantees
                                    regarding the fulfilment of expectations described.

                                                                                        2
The Company
              3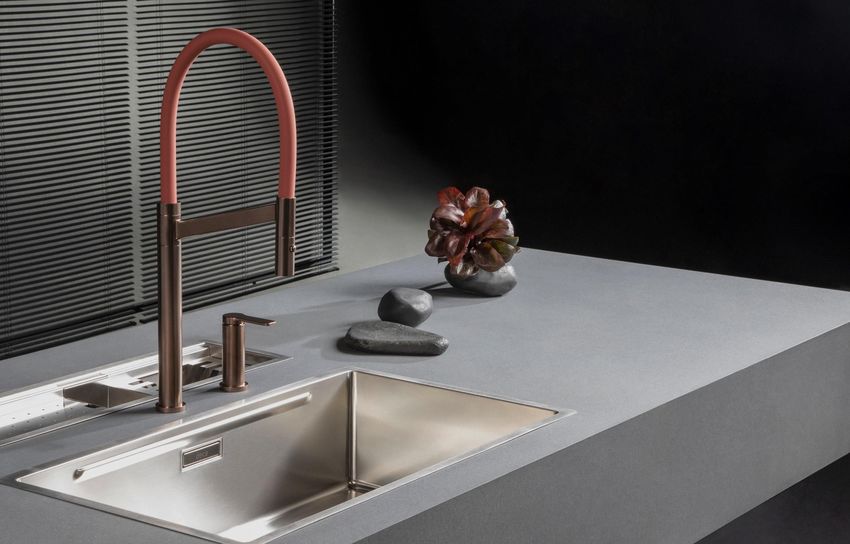
Who we are                                                          Corporate Governance
                                                                          Shareholder structure ( %)

69                                 +10k employees
                                                                                                  Itaúsa
      years of history                                             40              40
                                                                                                  Bloco Seibel

                                                                                                  Outros
                                                                                                  Others

                                                                          20

7   forestry units                 16 plants in Brazil and   •   Dividend policy requiring minimum
                                   3 in Colombia                 distribution of 30% of adjusted net
                                                                 earnings;

                                                             •   30% of independent members on the
                                                                 Board Directors;
Leader     in the market for
                                   Biggest     producer of   •   Senior board members can not hold na
                                                                 executive position within the Company;
producing bathroom fittings
                                   wood panels in Brazil     •   6 executive comittees;

                                                             •   Risk management, Compliance, Audit
                                                                 and Ombudsman Departments;

                                                             •
One of the leading             Since 1951                        Analyst Covarage: Bradesco BBI, BTG
                                                                 Pactual, Credit Suisse, Goldman Sachs,
                                                                 Empiricus Research, HSBC, JP Morgan,
companies in the ceramic tiles It is listed on the stock         Morgan Stanley e Nau Securitie.

segment in Brazil                  exchange market

                                                                                                                 4
Business units

Strong brands synonym               WOOD
of excellence

Portfolio of products as a
design benchmark                     DECA

Innovation as a diretional
of processes
                                 CERAMIC TILES

Solid Management
System (SGD) with focus in
shareholder value creation
                             DISSOLVING WOOD PULP
                                                    5
Where we are
   Yarumal
   Wood Panel
   Barbosa
   Wood Panel
   Manizales
   Wood Panel                                                                              João Pessoa (PB)
                                              Uberaba (MG)
                        Colômbia                                                           Sanitary ware - Deca
                                              Wood Panel
                                                                                          Cabo de Santo Agostinho (PE)
                          Agudos (SP)         Uberaba (MG)          Indiápolis (MG)
                                                                                          Sanitary ware - Deca
                          Itapetininga (SP)   Forest                DWP
 Agudos (SP)                                                                                Maceió (AL)
                          Wood Panel                                                        Forest
 Itapetininga (SP)
                                                                                      Aracaju (SE)
 Lençóis Paulista (SP)
                                                                                   Hydra
 Forest                                                                          Queimados (RJ)
                                                                                 Sanitary ware - Deca
                                                                                                Jacareí (SP)
                                                                                                 Jundiaí (SP)
                       Taquari (RS)                                       Jundiaí (SP)           São Paulo (SP)
                       Wood Panel                                      Sanitary ware - Deca Sanitary Metal - Deca
                                                             Urussanga (SC)
                       Taquari (RS)                         Ceusa¹
                       Forest                          Criciúma (SC)
                                                       Portinari¹

                                                                                                                         6
¹ 2 industrial units in each city
Business units
                 7
Wood

Solutions for better living

                                     17
Portfolio
         MDP                                                   Madeplac LP¹
  Uncoated MDP, with                                           Coated MDP, standart and
  applications in the                                                  textured
   funiture and civil
 constructions sectors

                                                                 Madefibra
         MDF
  Uncoated MDF, with                                               LP¹
   applications in the                                         Heavy-duty, coated MDF,
  heavy-duty furniture                                          standar and textured
         sector

                                                                  Durafloor
High-gloss LP¹                                                  Lamited wooden floor
Coated MDF, with diferente                                       coverings and vinyl
  degrees of gloss finish                                       floor coverings made
                                                                   from PVC 100%
                                                                      recyclable

  ¹ Low pressure: production process for coating wood panels                              9
Sector environment
Main indicators for the sector: Capacity Share Brazil¹
Brailian GDP
GDP – Civil construction Duratex
Consumer confidence 25% Arauco
33%
Berneck
5%
Main association: Eucatex
17% 20% Others
Outros
IBÁ (Brazilian Tree Institute)
Final Destination Volume by type
13%
Domestic
market 42%
41%
59%
Foreign 58%
87% market
MDF MDP Uncoated Coated
¹ Duratex estimates 10Operation information
Verticalized production 4 industrial units – Brazil Cost segmentation(%)
with more than 200ha • Agudos (SP): MDF and Durafloor
Depreciation and amortization 8%
• Itapetininga(SP): MDP and MDF
Eletricity 9%
• Uberaba (MG): MDF
Labor 9%
• Taquari (RS): MDP
Paper 14%
28%
Wood 18% 72%
Annual production Capacity Share Brazil
Variable costs
capacity (m³) • MDP: 39% Resin 21%
Fixed costs
• MDP Brazil: ~1.7 million • MDF: 28%
• MDF Brazil: ~1.8 million Others 21%
• Colombia: ~0.3 milhões
Net revenue geographical distribuition Segmentations of sales (%)
16% Southeast 6%
4% South
43% Furniture Industry
6% Northwest 48% Resale
Central West/North 46%
30% Civil
Foreign Market
contruction/Other
11Strategy
Agenda
Volume and Price
SALES STRATEGY FOCUSED ON DIFFERENTIATION Full capacity
Pricing
Sales executuon
Competitive efficiency
Portfolio Strong growth in Commodities
Price assertiveness
COST LEADERSHIP FOR COMMODITIES
Deducation of the manufacturing units
Sales and Operations Planning (S&OP) Mix
Verticalized operation
Full potential
Additional productivity gains
ASSET OPTIMIZATION AND EVA IMPROVEMENT Diferentiation
Divestment of forestry assets
Positive EVA in the division
Increasing trend towards products of
Significat improvement in the financial cycle
higher added value
Strong cash generation
12Deca
Solutions for better living
17Portfolio
Valves
Sinks Used in operating flushing
Applications in comercial and mechanisms
residencial kitchas and
bathrooms (Inox sink,
“Brutalistas”)
Metals
Sanitary ware Wide variety of taps for
kitchens and bathrooms
Applications in comercial and residential
bathrooms
Eletric products Acessories
Eletric taps and showers for Towel racks, soap dishes,
bathrooms and kitchens among others
14Sector environment
Main indicators for the sector: Market Share Sanitary ware
GDP Brazil
GDP – Civil construction
Consumer confidence 30%
40% Deca
New constructions
Roca
Resale – Civil construction
Outros
Others
Main association: 30%
ABRAMAT (Brazilian Association of
SanitaryWare Manufacturers)
Market Share Showers Market Share Metals (% Net revenue)
15%
Lorenzetti Deca
40% 40%
Deca/Hydra Docol
20%
Outros
Others Outros
Others
65%
20%
15Operation information
Metals Sanitary ware Cost segmentation(%)
3%
Fuel
3 Industrial unit 4 Industrial unit Electricity 8%
3%
• Jundiaí (SP) 12%
• São Paulo (SP) Depreciation and amortization
• Jacareí (SP) • Queimados (RJ) Metals 34%
• João Pessoa (PB) Labor 30% 66%
• Jundiaí (SP)
• Cabo de Santo Agostinho (PE)
Variable costs
Annual production Fixed costs
capacity (piece) Showers Others 44%
• Sanitary ware: ~9 millions
• Metals: ~20 millions
1 Industrial unit
• Aracaju (SE)
• Showers: ~9 millions
Net revenue geographical distribuition Segmentations of sales (%)
3%
6% Southeast
6%
9% South 13%
46% Northeast Resale/Home center
12% Central West Civil Construction
18%
63% Wholesale
North
24%
Foreign market
16Strategy
Initiatives 2018 - 2020
OPERATIONAL AND INNOVATION SALES EXECUTION
LOGISTICAL EFFICIENCY New funnel reducing time to market to 4 months Start of Sales Policy redesign
30% reduction in the portfolio
Inox washbasin launch Structuring of the Trade Marketing area
Gains in manufacturing productivity
Rapid delivery launches at Revestir Integration and capture of Deca + Hydra synergies
Factory consolidation Touchless line Launch of new Sales Policy
Headcount reduction Ricardo Dias design line Implementation of quarterly JBP
Maximization of Tax Incentive Textured line
Restructuring of the Sales Area
Start of ZBB for management of working capital Hydramotion line
Introduction of new metrics in the sales routine
Service level evolution Collored wash-basins
Launch of Marketplace Deca
Ongoing search for productivity Hydra Puravita
“Brutalistas” wash-basins Asset Light Sales force priming in the Ceará
Paraíba fittings operating at 93% IQG
Creation of the RGM – Revenue growth management ar
Hydra – Restructuring of the product platform
Restructuring of the factory layout
OCT18 TO OCT19
OCT19 TO OCT20
Strategic pillars
SOLUTIONS FOR BETTER LIVING
INDUSTRIAL & MARKET EXCELLENCE IN
NEW REVENUE
LOGISTICS INNOVATION INTELLIGENCE IN SALES PEOPLE
SOURCES
EFFICIENCY ACTION EXECUTION
TECHNOLOGY
CULTURE – WAY OF BEAING & DOING
1 – Índice de Qualidade Geral: Percentual de peças produzidas que estão conforme padrão de qualidade Deca | 2 - Joint Business Plan: Plano de negócios que prevê compromissos conjuntos entre todos os responsáveis pela operação 17
| 3 – Revenue Growth Management: Aplicação de análise de dados que permite tomadas de decisão mais assertivas, aumentando disponibilidade de produtos e preço para maximização da receita.Ceramic Tiles
Solutions for better living
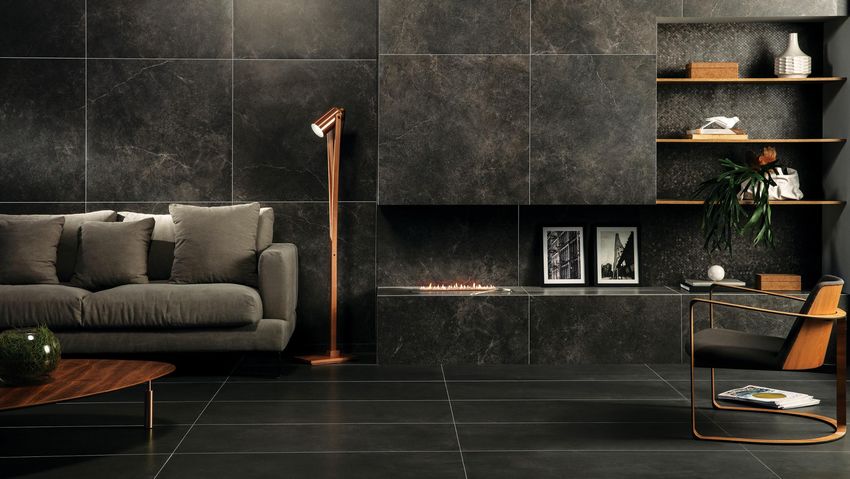
17Portfolio
Polished
porcelain tiles
Applications in drier
environments such as living
rooms, corridors and bedrooms
Tiles
Wide range of applications for
wet or dry environments
Special finishings
Wide range of applications with
exclusive designs using 3D
technology
Roof tiles
Wide range of applications with
high durability and lifetime,
preserving characteristics over
time
19Sector environment
Production by type
Main indicators for the sector:
GDP Brazil
GDP – Civil construction
Consumer confidence 28%
Wet process
New constructions
Resale – Civil construction Dry process
72%
Main association:
ANFACER (National Association for Ceramic Tile
Manufacturers)
Market Share 2019 (% Net revenue)
Portobello
9%
7% Ceusa/Portinari
7% Eliane
4%
Roca/Incepa
3%
70%
Elizabeth
Outros
Others
20Operation information
Cost segmentation (%)
4 Industrial unit Capacity Share
Eletricity 6%
• 2 in Urussanga/SC • 3% 6%
Depreciation and amortization
• 2 in Criciúma/SC 13%
Fuel
Labor 20% 34%
Diferenciais do produto 66%
Annual production
• Monotone
capacity Variable costs
• Mono-caliber Others
• 31 millions m²/year¹ 54% Fixed costs
• Dry joint fitting
Net revenue geographical distribuition Sales segmentation (%)
Southeast
3%
10%
South 10%
5%
42% Central west 18% Resale
11% Northeast Civil Construction
56% Home center
North 16% Others
29%
Foreign market
¹ Consider Ceusa expansion
21Strategy
Synergy in focus
LET’S BUILD
THE BEST
IN BRAZIL.
Strategy agenda
SALES STRENGTHENING MANUFACTURING
EXCELLENCE BRANDS SYNERGY
Growth of relationship programs with 4.0 Industry
Restructuring of market
intelligence specifiers, sellers and settlers High industrial performance
Entry into e-commerce Focus on the Consumer Journey Evolution of the service level
Strengthening of sales policy Smart store. – S&OP
Go Live SAP S4/HANA
Synergy between businesses
22Dissolving Wood
Pulp
23Dissolving Wood Pulp
Productive chain Location of the factory
Single block
of 44k ha
Forest Chip Cellulose
Region for
the factory
Fiber site MG
Thread Fabric Non Textiles
Cloth Non-textile
applications
24Dissolving Wood Pulp
The project
Shareholder structure
Competitive advantages
Lowest cash cost in the secto worldwide
Integrated logistics Lenzing
49% 51%
Capacity of 500k ton/year; Duratex
Wood certified by international standarts
The Joint Venture
Total industrial investment of approcimately 1.2 bilhão de dólares
Product 100% sold, destined for Lenzing factories in Europe, Asia and
North America for production of viscose and Lyocell
Duratex contribuition (forest and cash) realized between 2019 and 2020
25Dissolving Wood Pulp
Timeline – On time, on budget
2018 2020 2022
2Q20
2Q18 Structuring of financing
Signing of 48% of the construction 1S22
agreement complete Start of operation
2Q19 1S23
Installation license Construction Operation at full
4Q19 capacity
Creation of
joint venture
2019 2021 2023
26ESG Consolidation
Even with all the challenges we have faced in the year, we have
strengthened this commitment...
OUR WAY OF IMPACTING 58% of the energy generated from
OUR WAY OF CREATING VALUE fuels with a renewable origin.
THE WORLD
86% re-use of waste produced in
WELL BEING Brazilian operations1
Diversity
Experience and development of workers 150% reutilization of water in the
Brazilian operations.
IMPACT
Recognition in 2020
Responsible supply chain
Keeping close to the community
Duratex receives 13th consecutive year
second place
CARE Duratex introduces award for leading
included in the portfolio
new index that companies in
highlights ESG Corporate and recognition with
Employee health and safety Governance Brazil
factors maximum points in the
Engagement of influencers Company is named
the firm in Brazil and S&P/B3 Brazil
FSC® certification the Americas with the ESG Index
completes 25 years. most transparency in
its ESG commitments Duratex is a
in the wood and pulp signatory to Business
We launched our first Pact for Integrity
integrated report sector
Against Corruption
Julho
July August October November December
1 – Including the following destinations: recycling, reuse, co-processing, composting and supplier returns. 27Strategy development
A leaner and more productive Duratex, with stronger shareholder returns
Asset management
Sale of land and forestry assets
Sale of the Hardboard business
Growth cycle Cultural transformation
Closure of the unit at Botucatu and re-
Boom in demand Strategic review of the Duratex opening of the unit at Itapetininga
culture
Increase in market share Joint Venture in dissolving wood pulp with
Rejuvenated culture ready to face new the Austrian Company Lenzzing
Geographical and product challenges
diversification Unification of shower operations with
High performance teams the closure of the operaations in
Consolidation of Corporate
Active and engaged leadership Tubarão/SC
Governance
Economy expanding Economic crisis Ceusa Expansion Project
2007
to 2014
2015 2016 2017 2018 2019
The New Proposal Economy Recovery Company in transformation
Management Excellence
Duratex Closure of the Sanitary Ware unit in São
Sollutions for Better Living Leopoldo
Duratex Management System
Duratex 2025 License granted for the construction of the
Identification of gaps and priorities Dissolving Wood Pulp factory
Zero Based Budgeting Client as center of strategy
Closure of Ceramic Tiles unit in Santa
Operational Efficiency Digital innovation Luzia/MG
EVA as performance metric Welcome: Ceusa and Viva Decora Aquisition of Cecrisa
Closure of the wood panels unit in
Botucatu/SP
Approval of the creation of the joint venture
LD Celulose to produce dissolving wood pulp
282020
Evolution of the EBITDA
% evolution vs same quarter of the
Scenario previous year
Home office for admin areas
Social Distancing
1Q
Partial manufacturing 20 1Q 122%
Raised of R$1.6bn
shutdown
Crisis Committee
Home improvement stores Temporary shutdown of 2Q 56%
considered an essential manufacturing units
service 2Q Donation of R$10
Emergency government 20 million to combat COVID-19
aid (R$600)
Increase in market share 3Q 182%
Resumption of launch of Factories operating at full
new enterprises
3Q capacity
4Q 185%
186%
Reduction in interest
20 Strong recovery in
rates 2% (Central Bank) demand
Continued increase in demand YEAR 142%
Reduction in emergency aid 4Q
payment (R$ 300)
20 Redoubling of protections for
the returning workforce
29THE NEW DURATEX Strategic Pillars
A company focused on...
People
People are our strength
...cash generation, while maximizing shareholder value
Remuneration of executives based on cash generation and EVA
Results
...sustainable growth Sustainable high performance
Organic and inorganic growth within our
Way of Being and Doing
Processes
...innovation and digitalization We work well, simply and safely
As a way to simplify our processes and leverage our sales
channels Client
We are the best choice
...strategic assets
Optimization of current assets and productive management with
strategic partners
...client solutions Nice to meet you. We are
One-stop shop, complete experiences and environments
30Finance information 31
Consolidated result                                                                                 BRL Million

   Net Revenue and Gross Margin                   Recurring EBITDA and Margin EBTIDA

   31%                29%                         24%
                                          32%              21%                               22%
         28% 26%             26%                                 17% 19% 18% 19%
                                   26%
                                          5.880                                             1.288
                            4.949 5.012            952                               910
  3.985 3.963 3.910 3.991                                  837         760    849
                                                                 681

  2014 2015 2016 2017 2018 2019 2020              2014 2015 2016 2017 2018 2019 2020

                                                        Net Debt and Financial Leverage
         Recurring Net Income
                                                                 3,0    2,8
                                                          2,3
                                          528     2,1                          2,0
                                                                                           1,9
   359
                                   275                                                 1,2
                             271                  1.941 1.913 2.040 2.100 1.700 1.705
         222          181                                                             1.477

               (13)
   2014 2015 2016 2017 2018 2019 2020             2014 2015 2016 2017 2018 2019 2020

                                                                                                            32
Business units results BRL Million
Volume (`000 m³) Recurr. Net Revenue and Gross Margin Recurring EBITDA and Margin EBTIDA
27%
31% 31% 23% 24%
2.788 2.827 26% 25% 28% 27% 27% 19% 20% 20% 20%
2.498 2.433 2.399 2.748 2.504 725 788
2.642 2.598 2.595 2.516 2.981 2.802 3.251 595 598 570
Wood 504 502
2014 2015 2016 2017 2018 2019 2020 2014 2015 2016 2017 2018 2019 2020 2014 2015 2016 2017 2018 2019 2020
Volume (million of pieces) Recurr. Net Revenue and Gross Margin Recurring EBITDA and Margin EBTIDA
31% 31% 30% 28% 30% 32% 17% 18% 18% 18%
28% 16%
27 26 26 26 26 27
25 13% 14% 306
Deca 1.578 1.718 228 242
258 245
1.343 1.365 1.315 1.475 1.483 177 204
2014 2015 2016 2017 2018 2019 2020 2014 2015 2016 2017 2018 2019 2020 2014 2015 2016 2017 2018 2019 2020
Recurr. Net Revenue and Gross Margin Recurring EBITDA and Margin EBTIDA
Volume (`000 m²) 39%
24.275 24% 19% 21%
36%
Ceramic 34% 194
Tiles 13.483 911
500 94
5.340 47
194
2014 2015 2016 2017 2018 2019 2020 2014 2015 2016 2017 2018 2019 2020 2014 2015 2016 2017 2018 2019 2020 33Dividend Policy²
Payment at least once per year.
6,5% 6,7%
3,5% 3,9%
2,1% 2,2% 2,4% 2,2%
1,1%
Dividend
Yield (%)
Payout
Minimum
dividend
53% 43% 39% 33% 138% 36% 127% 64% 113% (30% of adjusted
net income)
2011 2012 2013 2014 2015 2017 2018 2019 2020
Payment
0.29 0.29 0.29 0.19 0.38 0.10 0.79 0.37 0.75 R$ / Share
² In 2016, no disbursements was made regarding dividends and interest on capital 34Main investments
Movements aligned to the purpose Solutions for Better Living
2014 2015
Wood Forests and 3 industrial units in
Joint Operation with Caeté S.A. plant
for the formation of forests in the Colombia with MDP and MDF production
Northeast of Brazil Annual capacity: ~0,3 millions m³
2011 2012 2013 2015
Eletric showers
Deca Sanitary ware – industrial
unit (João Pessoa – PB)
Industrial valves unit Electronic showers and heating Annual capacity: ~5,0 million pieces
(Jacareí - SP) system
Annual capacity: ~1,8 million Annual capacity: ~0,8 Annual capacity: ~1,5 million
pieces million pieces pieces
Ceramic 2017 2019
Tiles Entry in the Ceramic Tiles sector Ceramic Tiles
Annual capacity: ~6,0 millions m² Annual capacity: ~20,0 million m²
2019
Dissolving wood
Joint Venture with Lenzing AG
pulp Annual capacity: 500k ton
35Quarter results 36
Results Presentation

  4Q20
Highlights Adjusted and Recurring EBITDA
Margin
R$ million / % +41.7%
1.288
Duratex closes out 2020 with EBITDA +85.4% +85.4%
516
909
21,9%
versus 4Q19 and +41.7% versus 2019. 278
18,7%
27,3% 18,6%
4Q19 4Q20 2019 2020
Significant increase in sales volume in 4Q20 with gains in market share
across all lines; Recurring EBITDA
R$ million
EBITDA
Margin %
Price adjustments and improved operational performance drove the Net Revenue and Gross Margin
operating margins in the quarter; R$ million / % +20.5%
5.880
Positive EVA across all divisions; +37.3% 4.880
1.379 1.894 31,5%
28,8%
29,0% 32,7%
Evolution of the EBITDA 4Q19 4Q20
R$ million Net Revenue
2019 2020
+7.3% 1,288
R$ million
Gross Margin
%
1,200
Recurring Net Income
1.025 R$ million
952 909
851 837 849 +92.0%
799 528
760
681 +78.4%
281 275
158
4Q19 4Q20 2019 2020
2010 2011 2012 2013 2014 2015 2016 2017 2018 2019 2020 38Cash Flow
Sustaining cash flow generation +145.6% greater vs
2019
Strategic management of suppliers leading to sharp
reduction in the cash conversion cycle;
Reduction of 3.0 p.p. in inventory on net revenue levels, Cash Conversion Cycle
greatest efficiency in resource management in the Days
2019 2020
Company; 132
Disbursement of R$523.1 million on the dissolving wood 65
83 82 87
61
61
pulp project, besides the forestry contribution made.
11
Free Cash Flow YTD Client PMR Inventory PME Supplyers PMP Cash cycle
R$ million CAPEX
CCR¹: 87.6% R$ Million
1.288
1.129 Investment 4Q19 4Q20 2019 2020
909 744
FORESTRY OPEX 42 36 174 125
485 460 530
284
174 MAINTENANCE 69 124 194 336
39 25
Sustaining
(69) 111 161 368 462
(53) CAPEX
(153)
(368) (225) EXPANSION
(598) 8 1 86 534
(462) PROJECTS
Recurring Working Sustaining Tax Others Finance Sustaining FCF
EBITDA Capital CAPEX Flow FCF Expansion
and other TOTAL
2019 2020 projects
1 – Cash Conversion Ratio: rate of converting Adjusted and Recurring EBITDA into Sustaining FCF
39Corporate Debt
Operating results lead to a reduction in leverage
Strong cash generation and operating improvements take the leverage to 1.2x;
Liability management: early settlement of R$ 210.0 million in the quarter of principal amount, giving a
total of R$ 510.0 million for the year
Strong reduction in short term net debt vs previous quarters;
Announcement of the distribution of Interest on Capital and additional Dividends equivalent to the
gross amount of R$0.75 per share, resulting in a dividend yield of 3.9% and payout of 113.2%;
Amortization timeline Financial leverage
R$ million R$ million
Short Net debt
Debt maturity: Average cost: 18%
Net debt / Adjusting and recurring EBITDA (LTM)
1.728 3.2 years 2.9% p.a. 2,6x
Term
2,2x
82% 1,9x 1,8x
Long
2.180 1,2x
2.059
1.885
805 1.705
1.477
611 638
573 567
12
Cash position 2021 2022 2023 2024 2025 2026+ 4Q19 1Q20 2Q20 3Q20 4Q20
40Wood
Solutions for better living
17Sector Environment
IBA data
Despite the impacts arising from the COVID-19 crisis, the market has outperformed the same period in
2019, the highlight being the growth of the sector in the second semester of 2020
Historic result in domestic demand for the full year
Recovery of 5.9% of the external market vs 2019
Panels Total MDP Internal Market MDF Internal Market
Volume 000m3 Volume 000m3 Volume 000m3
+6.5%
7.720 8.223
+9.3%
+2.8%
+23.4% 4.257
+18.0% 3.893
2.414 2.802 2.881 +27.5%
1.956
989 1.261
722 852
4Q19 4Q20 2019 2020 4Q19 4Q20 2019 2020 4Q19 4Q20 2019 2020
Internal Market: +23.4% Internal Market: +6.6%
External Market: +22.6% External Market: +5.9%
422020 – Wood
COVID-19 impacts Temporary suspension of Operation running The high levels of
compensated by the positive all manufacturing units, at full capacity equipment utilization
performance in February and bringing forward the seen in 3Q20 have
the first Half of March maintenance shutdown Increase in export been maintained
volumes
EBITDA improvement Gain in market share in Margin adjustment
leveraged by the improvement all product lines achieved through re-
in cost management pricing
1Q 2Q 3Q 4Q
20 20 20 20
Results vs 2019 (%)
Volume and Adjusted and Recurring
EBITDA
174% 184%
138% 130% 138%
116% 113%
98%
82%
51%
1Q 2Q 3Q 4Q FULL YEAR
Volume Adjusted and Recurring EBITDA
43Adjusted and Recurring EBITDA and
4Q20 Results Margin
R$ million / % +38.3%
1
788
Price increase and improvement in +84.0%
320
570
the mix raised the margin to 30.3% 174
1
30,3%
20,3%
24,2%
24,1%
4Q19 4Q20 2019 2020
Growth of 35.1% in sale of coated products versus Recurring EBITDA Margin %
4Q19 and of 13.8% versus 2019; R$ million
Increase of 12.6% in quarterly unit revenue and of Net Revenue and Gross Margin
2.8% annually; R$ million / % +16.0%
3.251
Reduction of 2.1% in the annual unit cash cost; +46.2% 2.802
30,7
%
722 1.056 27,1%
30,4%
26,7%
4Q19 4Q20 2019 2020
Capacity Capacity Net Revenue
R$ million
Gross Margin
%
Utilization Wood Utilization Wood
93% 76% Volume +12.9%
4Q20 2020 000m3
2.827
2.504
+29.8%
654 849
MDP MDF MDP MDF
100% 86% 83% 71%
4Q19 4Q20 2019 2020
1 – Not including spend on the new dissolving wood pulp unit 44Deca
Solutions for better living
17Sector Environment
ABRAMAT data
Sector most affected by the COVID-19 crisis, showing a slight
contraction of 0.4% over the full year
Despite the recovery in demand for finishings in the 2nd semester, the
sector shrank -3.8% vs 2019 in the group of finishings products
Revenues for the construction Deflated gross revenues vs 2019
materials industry vs 2019 %
%
15,7% 16,0%
15,1%
13,3%
11,5%
10,4% 11,1%
10,2%
9,3%
1,9%
-0,4%
1
Oct/20 Nov/20 Dec/20 2020
-3,8%
1
Oct/20 Nov/20 Dec/20 2020
Finishings Basic
1 – Estimate
462020 – Deca
Flooding at the Partial shutdown of the Significant gain in Projects for productivity
Metals industrial manufacturing units sales volume and efficiency gains on all
unit in São Paulo lines
Record sales in the Hydra Operating
Strong impact on product line efficiency reflected Start of ramp-up of the
sales in March in cost reduction kiln at the Recife unit
arising from COVID-
19 Launch of cubas
brutalistas (rustic basins) Launch of the Deca
in Revestir (asset light) marketplace
1Q 2Q 3Q 4Q
20 20 20 20
Evolution vs 2019 (%)
Volume and Adjusted and Recurring EBITDA
187%
165%
125% 121% 125%
106%
91% 84% 84%
46%
1Q 2Q 3Q 4Q FULL YEAR
Volume Adjusted and Recurring EBITDA 47Adjusted and Recurring EBITDA and
Margin
4Q20 Results R$ million / %
+25.1%
306
Strong recovery in the 2nd semester of 2020 +86.7%
245
125
67 17,8%
22,8%
15,5%
15,3%
Price increase compensating for pressure on costs;
4Q19 4Q20 2019 2020
Improvement of 7.5 p.p. and 2.3 p.p. in the EBITDA Adjusted and Recurring EBITDA Margin
R$ million %
margin versus 4Q19 and 2019 respectively,
Net Revenue and Gross Margin
reflecting the strategies of operational efficiency and R$ million / % +8.8%
commercial excellence; 1.718
1.578
+25.4%
549 32,1%
438 35,9%
29,7%
29,3%
Capacity Utilization Capacity Utilization
4Q20 (%) 2020 (%) 4Q19 4Q20 2019 2020
Net Revenue Gross Margin
R$ million %
Deca Deca Volume
Metals 87% Metals 75% ‘000 items +6.2%
89% 79%
25.730 27.315
+21.1%
Sanitary Sanitary 7.011 8.490
Showers Showers
ware ware
79% 66%
71% 77%
4Q19 4Q20 2019 2020
48Ceramic
Tiles
Solutions for better living
17Sector Environment
ANFACER data
Growth of 19.9% in the month of
December/20 in relation to the same period in
the previous year, demonstrating the recovery Sales volume in the ceramic tiles industry vs 2019
%
of the sector jan-00
19,9%
Increase in the level of utilization in 4Q20
jan-00
12,1%
arising from the return to growth 11,2%
jan-00
6,5%
jan-00
jan-00
2,5%
jan-00
Oct/20 Nov/20 Dec/20 4Q20 2020
Capacity utilization
%
4Q19 4Q20
77% 84%
502020 – Ceramic Tiles
Strong impact on Government decree Market recovery Return of operations
March sales ordering a 50% to full capacity
arising from reduction in the Strengthening of
COVID-19 number of workers at the Ceusa brand, Growth of Ceusa on
manufacturing units optimizing the social networks
Ramp up of the mix in the leveraged by the
new large formats division synergy with
line Portinari (leader in
the sector)
1Q 2Q 3Q 4Q
20 20 20 20
Evolution vs 2019 (%)
Volume and Adjusted and Recurring EBITDA
427%
391%
305%
214%
179% 163% 180% 206%
147% 132%
1Q 2Q 3Q 4Q FULL YEAR
Volume Adjusted and Recurring EBITDA
51
Cecrisa’s results included from August/19Adjusted and Recurring EBITDA and
Margin
4Q20 Results R$ million / %
+105.5% 194
Capture of synergies the priority +63.2%
71 94
21,3%
43 24,6% 18,9%
19,9%
Capture of synergies greater than expected:
4Q19 4Q20 2019 2020
with enhancement of the Ceusa brand;
Adjusted and Recurring EBITDA Margin %
strong reduction (27.4%) in general and admin R$ million
expenses Net Revenue and Gross Margin
R$ million / %
Start of smart store operations; +82.3% 911
+32.1%
500
289
219 35,9%
33,5%
36,1% 34,7%
4Q19 4Q20 2019 2020
Adjusted and Recurring EBITDA Gross Margin
R$ million %
Capacity Utilization Annual Capacity Utilization
2020 (%) Volume
4Q20 (%) ‘000m²
+80.0% 24.275
+31.9%
13.483
Ceramic Tiles Ceramic Tiles 7.687
5.830
96% 87%
4Q19 4Q20 2019 2020 52
Cecrisa’s results included from August/19Dissolving Wood
Pulp
53Dissolving Wood Pulp
On budget, on time
Cash investment of R$ 523.1 million and forestry contribution equivalent to
R$487,0 million in the year
Raised by LD Celulose of US$1.2 billion through the institutions IFC, IDB and
Finnvera
Financing structure wins a number of awards: “Loan of the year”, “Infrastructure
financing of the year: Brazil” and “Syndicated Loan” of the LatinFinance Awards
2018 2020 2022
2Q20
2Q18 Finance structuring 1S22
Agreement signed Start of construction Start of operation
2Q19 1Q23
Installation license Construction Operation at full
4Q19 capacity
Creation of the joint
venture
2019 2021 2023
54Dissolving Wood Pulp
Timeline maintained while complying with
social distancing measures
4000+ workers involved 48% of the
in the activity construction complete
55Prospects for 2021
Dissolving Broader
Wood Deca Ceramic Tiles
Wood Pulp Scenario
Focus on Cost pressure on Continuation of the Progress in the process Maintenance of interest
differentiation, commodities; process to capture of constructing the rates at low levels;
with expansion of synergies between the new unit;
Automation of the Increase in the number of
production Ceusa and Portinari
sanitary ware unit; Improvement in the new construction projects;
capacity of coated brands;
price scenario for
Continual increase Delivery of new real estate
panels; Merger with Deca; dissolving wood pulp;
in volumes in the 3 projects stimulating the
Favorable scenario Organic growth in
divisions, with home improvement sector;
for price positions; capacity through the
focus on Hydra;
Economic recovery
Cost pressure on retrofitting and
dollar transfer of assets;
denominated raw
materials;
56INVESTOR
RELATIONS
Henrique Haddad - VP Adm, Finance and IR
Natasha Utescher – IR Manager
Alana Santos - IR Analyst
Mariana Fontenelle – IR Analyst
Q&A
Results Presentation
duratex.com.br/ir
investidores@duratex.com.br
11 3179.7045
4Q20
Av. Paulista 1.938 - CEP 01310-200
Consolação - São Paulo – SPYou can also read