ENGIE ENERGÍA CHILE S.A - Presentation to investors 9M18 Results

Page created by Clayton Wilson
 
CONTINUE READING
ENGIE ENERGÍA CHILE S.A - Presentation to investors 9M18 Results
ENGIE ENERGÍA CHILE S.A.
Presentation to investors
9M18 Results
ENGIE ENERGÍA CHILE S.A - Presentation to investors 9M18 Results
AGENDA

     Snapshots

     Key messages

     Financial update

     Addenda

Engie Energía Chile - Presentation to Investors – 9M 2018   2
ENGIE ENERGÍA CHILE S.A - Presentation to investors 9M18 Results
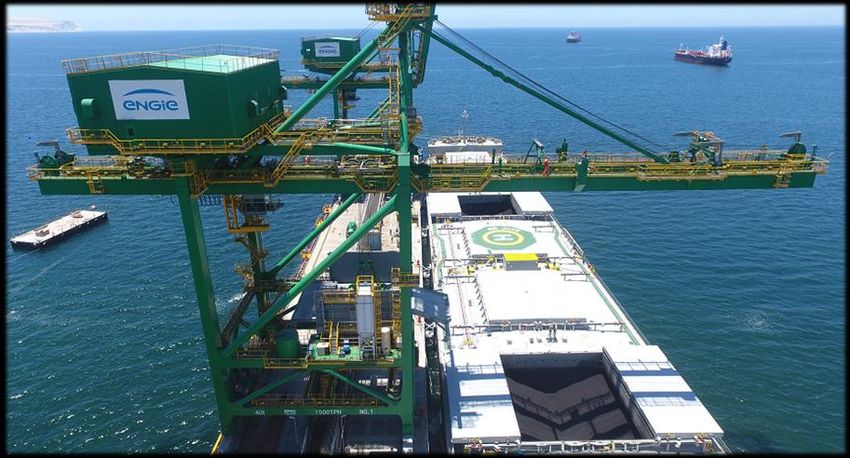
SNAPSHOT: ENGIE S.A.

ENGIE: A GLOBAL ENERGY PLAYER

                                 LOW CO2 POWER                                                   GLOBAL                                         CUSTOMER
                                 GENERATION                                                      NETWORKS                                       SOLUTIONS

                  World leading independent                                            European leader in gas
                                                                                                                                        24m customers in Europe
                       power producer                                                     infrastructures

                                                                                     €27bn(3) regulated asset                            Global leader in energy
                          103 GW(1) installed
                                                                                         base in France                                    solutions for cities

                                                                                                                                       +250 distribution heating &
                              ~90% low CO2                                          12bn m3 storage capacity
                                                                                                                                       cooling networks worldwide

                                                                                      Expertise in power                                   23m individual and
                           26% renewables(2)
                                                                                  transmission & distribution                            professional contracts

                 Capacity breakdown                                             EBITDA gas infrastructures                           EBITDA by type of business

                                          89% low CO2
                            5%                                                             0.4                                            0.7
                       7%
                    6%
                                  103 GW(1)                                                         €3.8bn(4)                                         €2.3bn(4)
                                                                                                                               3.4                                          1.1
                                                    56%

                        26%                                                                                                                     0.5

                    Natural gas           Nuclear         Other                                    France
                    Renewables(2)         Coal                                                                                              B2B              B2T                B2C
                                                                                                   Other EU & International
                                                                                                                                                 B2B: Business to Business
(1) At 31/12/2017, at 100%                                        (3) Incl. Storengy in France, regulated as from 01/01/2018                     B2T: Business to Territories
(2) Incl. pumped storage for hydro (3%)                           (4) 2017 EBITDA                                                                B2C: Business to Customers

Engie Energía Chile - Presentation to Investors – 9M 2018                                                                                                               3
ENGIE ENERGÍA CHILE S.A - Presentation to investors 9M18 Results
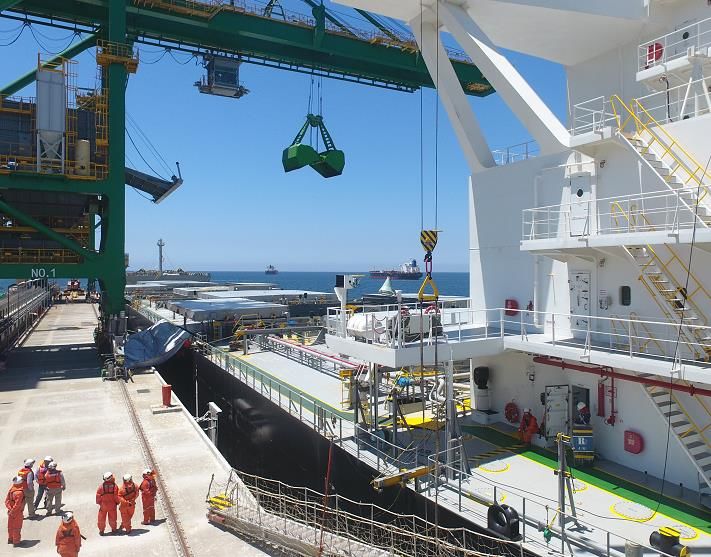
SNAPSHOT: CHILEAN ELECTRICITY INDUSTRY

SISTEMA ELÉCTRICO NACIONAL (SEN)
TWO MAIN GRIDS RECENTLY INTERCONNECTED
                                                                  Gross installed                              Generation
                                                                  capacity (MW)                                 9M18 (GWh)

                                                                      Solar                                   Hydro
                                                                      10%                                     27%               Wind
                                                              Wind
                                                                                    Hydro                                       6%
                                                              7%
                                                                                    28%
                                                                                                                                  Solar
                                                                                                                                   7%
                                                                        24,095 MW                               57,419 GWh
                                                            Thermal                               Thermal
                                                             55%                                   60%
                                       SEN
                                     3,300 Km

                                                                          Clients                            Market Share
                                                                                                    (% installed capacity Sept-18)

                                                                                                              Enel
                                                              Regulated
                                                                                                              27%               EECL
                                                                52%
                                                                                                                                 8%
                                                                                                   Colbún
                                                                                                    14%
                                                                       10,570 MW                                    24,095 MW    AES Gener
                                                                                                  Tamakaya                         17%
                                                                                                     2%
                                                                                    Unregulated
                                                                                       48%                  Other
                                                                                                            32%

Source: CNE

Engie Energía Chile - Presentation to Investors – 9M 2018                                                                              4
ENGIE ENERGÍA CHILE S.A - Presentation to investors 9M18 Results
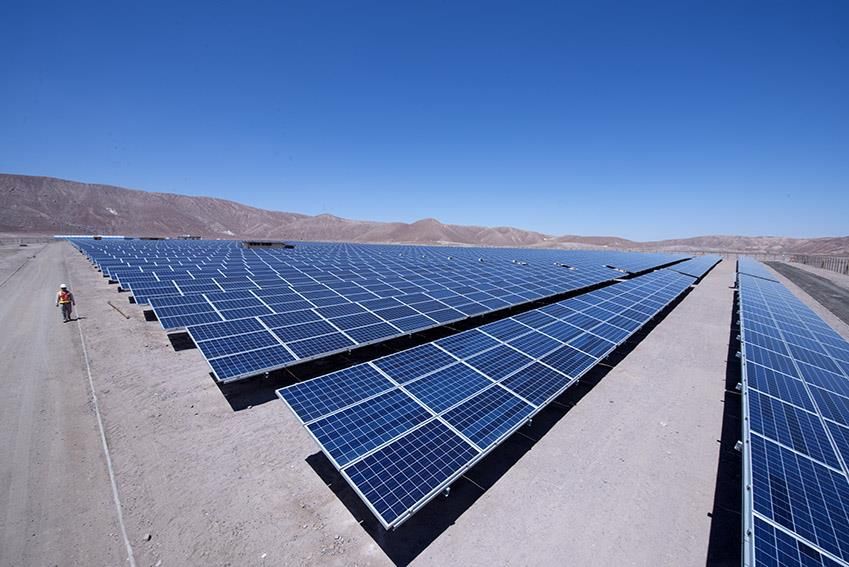
SNAPSHOT ENGIE ENERGÍA CHILE

EECL: A RELEVANT PLAYER IN THE CHILEAN POWER INDUSTRY

                    RELEVANT PLAYER IN
                    THE ENERGY                                                                             CONTRACTED
                    INDUSTRY                                         GROWTH UNDERWAY                       BUSINESS

            Leader in northern mining                          New 15-yr regulated PPA            Capacity contracted under
             region, 4th largest electricity                     w/distribution companies            long-term sales agreements;
             generation company in                               starting 2018 => 48%                12 years remaining average
             Chile                                               contracted physical sales           life
                                                                 growth by 2019
            ~1.9GW gross generation                                                                Strong counterparties
             capacity; ~0.3GW under                             50%-owned TEN ~US$ 0.8               Unregulated: mining
             construction                                        bn transmission project                companies;
                                                                 began operations in 4Q17             Regulated: distribution
            3rd largest transmission                                                                   companies
             company
                                                                ~US$ 1 bn new power
                                                                 generation capacity + port           Strong sponsorship
            Seaport infrastructure, gas
                                                                 to start operations in 1Q19
             pipeline
                                                                                                           Float
                                                                                                          21.8%

                                                                                                                             52.8%
                                                                                                                    Engie
                                                                                               AFPs (Chilean
                                                                                                                   Energía
          Prepared to provide energy                            Good delivery in growth        pension funds)       Chile
          solutions to its customers                            strategy implementation           25.5%

Engie Energía Chile - Presentation to Investors – 9M 2018                                                             5
ENGIE ENERGÍA CHILE S.A - Presentation to investors 9M18 Results
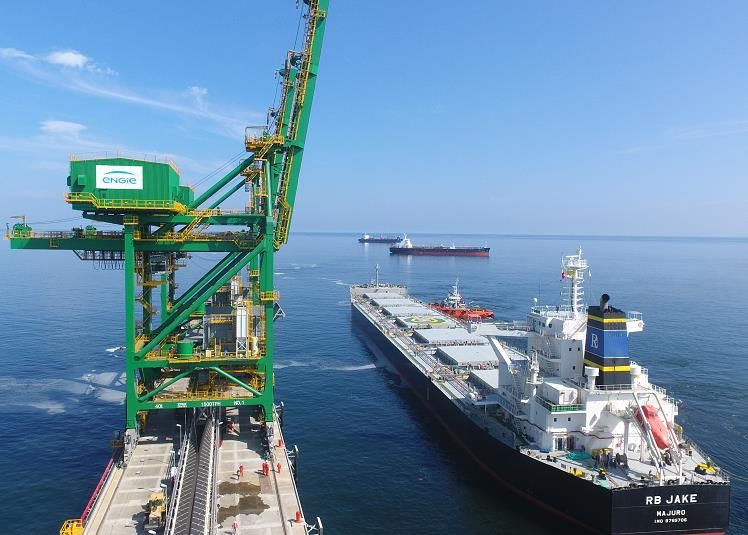
SNAPSHOT: ENGIE ENERGÍA CHILE’S ASSETS

 A DIVERSIFIED ASSET BASE TO MEET OUR CLIENTS’ ENERGY NEEDS

                                                                                                                              Technology
                                                                                                                                  Coal
                                                                 Chapiquiña (10MW)                                                Diesel/FO
                                  1,928 MW (*) in                                                                                 Natural gas
                                operation & 375 MW               El Aguila I (2MW)
                                                                                                                                  Renewables
                                  in construction
                                                                 Pampa Camarones (6MW)

                                                                 Diesel Arica (14MW)

                          2,293 kms HV + MV
                      transmission lines & 50%
                                                                 TE Tocopilla (877MW)                               Collahuasi
                      share in TEN 600 km, 500
                              kV project
                                                                 Tocopilla port                                     El Abra
                                                                                                                   Chuquicamata

                                                                 C. Tamaya (104MW)                                                      Mining Operations
                                                                                                                 Gaby
                                       2 seaports

                                                                 TE Mejillones (560MW)

                                                                                                                    Escondida
                                 Gas pipelines &                 CT Andina (177MW)                                                               Gasoducto Norandino
                                  Long term LNG                                                                                                 Chile - Argentina (Salta)
                                supply agreements                CT Hornitos (177MW)

                                                                                                                    50% share in TEN
                                                                                                                   transmission project

(*) The CNE authorized EECL to disconnect Central Diesel Iquique (43MW) The CNE also authorized EECL to disconnect units 12 and 13 in Tocopilla (170MW
combined gross capacity) as early as April 2019, subject to the completion of the Interchile transmission project

 Engie Energía Chile - Presentation to Investors – 9M 2018                                                                                               6
ENGIE ENERGÍA CHILE S.A - Presentation to investors 9M18 Results
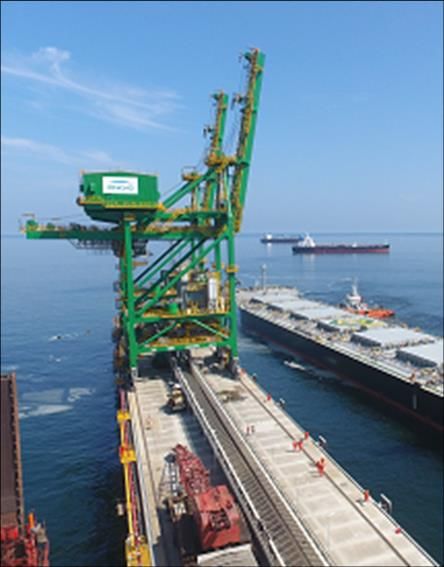
SNAPSHOT: EECL IN 2018

2018: THE BEGINNING OF A NEW ERA

                         NEW PPA:
                                                                                                                NEW POWER
                     REVENUE & EBITDA                               INTERCONNECTION
                                                                                                                 SUPPLY
                         GROWTH

           Contracted revenue growth                          TEN: 600-km, 500 kV,              IEM + Puerto Andino
            • ~8,200 GWh p.a. in 2017                           ~US$0.8bn, transmission
                                                                project                           ~US$1 bn investment
            • ~12,000 GWh p.a. in 2019
                                                                                                   including port
           More balanced portfolio                            On schedule, within budget,       Port: In operations
            (Unregulated/regulated)                             operating since 24-Nov-17          IEM: On commissioning
            • 77%/23% in 2017                                                                      COD: 1Q19
            • 55%/45% in 2019                                  Regulated & contracted
                                                                revenue; ~US$80 million           IEM: 375 MWe gross
           Expected EBITDA growth                              EBITDA p.a.                        capacity
            (>80% in 2 years)
                                                                  TEN: 50/50 Joint Venture        +2 LNG cargoes – 2018
                                                                   80% project financed            +1 LNG cargo – 2019
                Clients’ Sales (GWh)
                                                                                                  1-year bridge contracts with
                                                                                                   generation companies to
                                                                                                   meet new PPA

                                                                                     Red
                  2017     2018    2019                          EECL
                                                                                   Eléctrica
                                                                  50%
                 Unregulated       Regulated                                         50%

Engie Energía Chile - Presentation to Investors – 9M 2018                                                         7
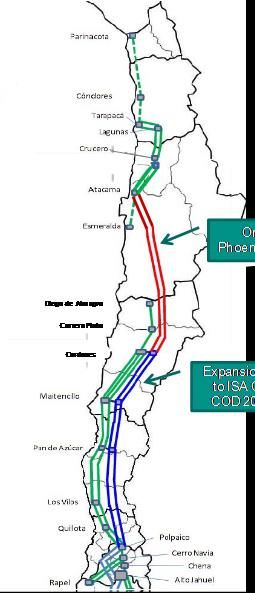
ENGIE ENERGÍA CHILE S.A - Presentation to investors 9M18 Results
AGENDA

     Snapshots

     Key messages

     Financial update

     Addenda

Engie Energía Chile - Presentation to Investors – 9M 2018   8
KEY MESSAGES

                                                            Results in line with guidance
                                                                Mastering the growth achieved

                                             Building our future together with our clients
                                                      PPA renegotiation, decarbonization & life extension

                                    Paving the way for our energy transformation plan
                                        Development focused on replacing coal with renewable capacity

                                                               Robust capital structure
                                                       Ample room to finance energy transformation plan

Engie Energía Chile - Presentation to Investors – 9M 2018                                                   9
KEY MESSAGES

RECENT EVENTS

                              INDUSTRY                                                              COMPANY

•    SIC-SING interconnection: In operations                                   •   Amendments to the Codelco and
                                                            SING     SEN           Glencore PPAs signed on April 2: tariff
     since November 24, 2017, giving birth to
     the SEN. The TEN project was ready                            “Sistema        decrease, full indexation to CPI starting
     ahead of schedule and within budget                           Eléctrico       2021, and PPA life extension
                                                                   Nacional”
•    Government and Generation Companies’                                      •   IEM successfully synchronized Oct.29.
     agreement to phase out coal generation                                        COD rescheduled for 1Q19

•    National transmission project bids: The                                   •   CNE authorized disconnection of U12 &
                                                            SIC                    U13 coal units (combined 170 MW)
     CEN has conducted public auctions to
     award expansion and new projects under
     the Annual National Transmission                                          •   The new 15-year PPA with distribution
     Expansion Plan (D.E.422/2017-Ministry of                                      companies started in 2018
     Energy): 4 companies were awarded New
     Projects with aggregate referential                                       •   Bridge PPAs with generation companies
     investment value of US$300 million, 13% of                                    were signed to supply ~60% of demand
     which were awarded to EECL                                                    under the above PPA

•    Zonal transmission project bids: The                                      •   Puerto Andino: 1,191k tons of fuel / 19
     CEN conducted public auctions for 31                                          shipments unloaded, including 1 Capesize
     projects with aggregate referential
     investment value of US$570 million under                                  •   Dividends: US$26 million paid Oct-26
     the Annual Zonal Transmission Expansion
     Plan (D.E.418/2017-Ministry of Energy).                                   •   S&P/Fitch: EECL’s BBB ratings confirmed

Engie Energía Chile - Presentation to Investors – 9M 2018                                                     10
RESULTS IN LINE WITH GUIDANCE: MASTERING THE GROWTH ACHIEVED

9M18 RESULTS IN LINE WITH GUIDANCE

      •      EBITDA increased 39% mainly due to the new PPA with distribution companies
      •      Net income was impacted by non-recurring asset impairments

                                                                    9M17              9M18             Variation
                  Operating Revenues (US$ million)                   782.2            950.7               +22%
                  EBITDA (US$ million)                               200.5            278.5               +39%
                  EBITDA margin (%)                                 25.6%             29.3%              +3.7 pp
                  Net income (US$ million)                            69.3             72.5                +5%
                  Net income-recurring (US$ million)                  60.9            120.9               +99%
                  Net debt (US$ million)                             770.5 (*)        810.8                 +5%
                  Spot energy purchases (GWh)                        2,458            2,788               +13%
                  Energy purchases - Bridge (GWh)                         0             627                 n.a.
                  Physical energy sales (GWh)                        6,505            7,308               +12%

         Net debt increased due to (i) expansion CAPEX financing and (ii) a ~US$60 million long-term tolling agreement with
          TEN accounted for as a financial lease.

      (*) Net debt as of 12/31/2017

Engie Energía Chile - Presentation to Investors – 9M 2018                                                          11
RESULTS IN LINE WITH GUIDANCE: MASTERING THE GROWTH ACHIEVED

DEMAND SUPPLIED WITH OWN GENERATION, SPOT PURCHASES
AND BRIDGE CONTRACTS
       US$/MWh
       140

                                                                              Average monomic price
       120
                                                                                     US$115/MWh

                                                                                                                                            U12 & U13 coal plants: 3%
                                                                                                                                              of 9M18 power supply.
       100                                                                                                                                  Authorization to close down

                                                                                                                                                                                     Diesel
                                                                                                                                                    by Apr-19.

                                                                                   Average fuel &
        80
                                                                              electricity purchase cost:
                                                                                      US$65/MWh
        60

        40
                                                                                                                                        U15     U14    CTM3         U16    U13 U12

                                      Bridge
                       CTA                                         Spot purchases                             CTH      CTM1 CTM2
                                     contracts
        20

                                                                                Firm capacity
                                                                  overcosts                     ToP Regas
        0
      Renewables Coal    Bridge                                      Spot 2,788 GWh                                                                      LNG                Coal  Diesel
                                                                                                                    Coal 2,073 GWh
       49 GWh   691 GWh 627 GWh                                                                                                                       1,019 GWh           221 GWh 7 GWh

                                                   Total energy available for sale before transmission losses 9M18 = 7,475 GWh

      Average realized monomic price, spot purchase costs and average cost per MWh based on EECL’s accounting records and physical sales per EECL data.
      Average fuel & electricity purchase cost per MWh sold includes the LNG regasification cost, green taxes, firm capacity, self consumption & transmission losses
      Net system over-costs and ancillary service costs averaged US$0.1 per each MWh withdrawn by EECL to supply demand under its PPAs.

Engie Energía Chile - Presentation to Investors – 9M 2018                                                                                                      12
BUILDING OUR FUTURE TOGETHER WITH OUR CLIENTS

PPA RENEGOTIATION, DECARBONIZATION & LIFE EXTENSION

                                     Sound contract portfolio with average remaining life                                                   A GROWTH
                                                       of 12 years (*)                                                                     DRIVING PPA
                                                                                                                                    •   2018: Up to 2,016 GWh
                       600
                                 ●       Regulated contracts
                                                                                                                                    •
                                                                                                                                        (230 MW-avg.)
                                                                                                                                        2019-2032: Up to 5,040
                                 ●       Unregulated contracts                                                                          GWh per year (575 MW-avg.)
                       500                                                            Distribution                                  •   Monomic price (Apr-Sep
                                         Renegotiated contracts
                                                                                      Companies
 Average demand (MW)

                                                                                                                                        2018): US$128/MWh
                                                                                      (South SEN)

                       400

                       300                                            Codelco                 Codelco
                                                                                                                               Clients’ credit ratings (S&P/Moody’s/Fitch):
                                                      AMSA CGE
                                                              (North                                                           •   Codelco: A+/A3/A
                       200                                    SEN)
                                                                                                                               •   Freeport-MM (El Abra ): --/Ba2/BB+

                                                                                   Glencore                   Glencore         •   Antofagasta PLC (AMSA + Zaldívar): NR
                       100                                          El                                                         •   Glencore (Lomas Bayas, Alto Norte):
                                                                   Abra                                                            BBB+/Baa2/--

                                                  Other (South SEN)       Other (North SEN)                                    •   CGE: AA-(cl) (Fitch)
                         0
                             0       2        4        6       8          10     12      14         16   18    20        22   24
                                                             Remaining life of contracts (years)                                   Source: EECL
                                                                                                                                   (*) Internal demand projections based on historic data
                                                                                                                                   and market intelligence, following PPA renegotiations
                                                                                                                                   signed on April 2, 2018.

Engie Energía Chile - Presentation to Investors – 9M 2018                                                                                                          13
BUILDING THE FUTURE TOGETHER WITH OUR CLIENTS

PPA RENEGOTIATION, DECARBONIZATION & LIFE EXTENSION

                                      PPA renegotiations signed by EECL on April 2, 2018: A win-win transaction
                         200MW
                         Chuqui

                                                     Price discount,              Price discount,
                                                                                                                      PPA life extension @ new, CPI-indexed price
                                                      coal-indexed                 CPI-indexed
                         16MW 34MW 16MW 34MW

                                                     Price discount,
                         Lomas Bayas Alto Norte

                                                                                   Price discount, CPI-indexed               Price discount, CPI-indexed               PPA life extension
                                                      coal-indexed

                                                                        Price discount, coal-indexed                         Price discount, CPI-indexed               PPA life extension

                                                         Price discount,
                                                                                  Price discount, CPI-indexed                                              PPA life extension
                                                          coal-indexed
                                                                  Price discount, coal-indexed                                                             PPA life extension
                         El Abra
                         110MW

                                                     Price discount,
                                                                                                CPI-indexed
                                                      coal-indexed

                                                  2018    2019   2020      2021   2022   2023    2024   2025   2026   2027   2028   2029   2030   2031   2032   2033   2034   2035   2036   2037   2038

   •      Extending the life of our PPAs and leaving behind their price indexation to coal will allow us to invest in renewable
          power sources and gradually replace coal capacity

   •      Our clients will benefit from lower power prices and a reduction in their carbon footprint

Engie Energía Chile - Presentation to Investors – 9M 2018                                                                                                                       14
BUILDING THE FUTURE TOGETHER WITH OUR CLIENTS

PPA RENEGOTIATION, DECARBONIZATION & LIFE EXTENSION

              GWh                           CONTRACTED DEMAND: OUR VISION THROUGH 2030
             14,000

             12,000

             10,000

               8,000

               6,000

               4,000

               2,000

                      -
                          2017     2018        2019         2020     2021   2022   2023       2024      2025       2026   2027   2028     2029    2030
                                  Regulated SING                   Regulated SIC     Free clients-renegotiated            Other free clients

  •      We could potentially invest ~US$1 bn in renewable power projects over the 2019-2023 period on the basis of the
         recent PPA life extension

Source: Engie Energía Chile: Average expected demand under existing contracts following the April 2, 2018 renegotiation

Engie Energía Chile - Presentation to Investors – 9M 2018                                                                                        15
PAVING THE WAY FOR OUR ENERGY TRANSFORMATION PLAN

RENEWABLE CAPACITY DEVELOPMENT PROJECTS

                                             Project development focused on energy transition

                                 Nueva Chuquicamata

                                                                     Antofagasta
                   Arica &
                                                                                                           Biobío
                Parinacota

                                                                                                                                     Los Lagos

                                                                                                                    Araucanía
                                                            Algarrobal             O’Higgins
              Wind
                                                                                                El Rosal
              Solar PV

      Geographic and power source                                    Gradual replacement of aging          Smoothing energy production
             diversification                                               thermal plants                     and demand patterns

Source: Engie Energía Chile

Engie Energía Chile - Presentation to Investors – 9M 2018                                                                       16
PAVING THE WAY FOR OUR ENERGY TRANSFORMATION PLAN

NATIONAL TRANSMISSION PROJECTS AWARDED IN 2018 AUCTIONS

                                     Nueva Chuquicamata
                                     SS + T.Line 2 x 220kV
                                     Ref. I.V. 18.0 MUSD
                                     AVI:      0.9 MUSD
                                     COD:       24 / 48 months
                                                                     Antofagasta
                    Arica &                                                                               Biobío
                 Parinacota

                                                                                                                                    Los Lagos
                                                                                   O’Higgins

                                                                                                                   Araucanía
              Wind                            Algarrobal                            El Rosal
                                              Sectioning SS 220kV                   Sectioning SS 220kV
              Solar PV                        Ref. I.V. 13.9 MUSD                   Ref. I.V. 7.3 MUSD
                                              AVI:       0.4 MUSD                   AVI:      0.2 MUSD
                                              COD:       24 months                  COD: 24 months

                                                                       Facilitation to renewable             Geographic & product
                Regulated revenue
                                                                                projects                        diversification

      •      EECL was awarded 13% of new national transmission projects auctioned in 2018
      •      Approximately US$39 million out of total referential investment value of US$300 million
Source: Engie Energía Chile

Engie Energía Chile - Presentation to Investors – 9M 2018                                                                      17
PAVING THE WAY FOR OUR ENERGY TRANSFORMATION PLAN

NEW PORT: COST SAVINGS + DIVERSIFICATION OPPORTUNITIES
            New port in Mejillones                          Puerto Andino

   •    Mechanized port, suitable for Cape-
        size carriers (of up to 180,000 DWT)

   •    Capacity to transfer +6,000,000 TPY
        => space for mineral product exports;
        i.e., diversification opportunities

   •    1,136,047 tons of coal + 54,581 tons
        of limestone unloaded since Dec-17.
        19 shipments including 1 Capesize
        carrier

   •    US$122 million total investment at
        our CTA subsidiary

   •    Unloading speed increased from
        1,000 TPH to 3,000 TPH => reduced
        demurrage costs

   •    Conventional + tubular conveyor
        belts => improved environmental
        standards

Source: Engie Energía Chile

Engie Energía Chile - Presentation to Investors – 9M 2018                   18
ROBUST CAPITAL STRUCTURE

AMPLE ROOM TO FINANCE ENERGY TRANSFORMATION PLAN

                          • 2018: THE END OF A CAPEX-INTENSIVE PHASE

                          • FREE CASH-FLOW POSITIVE STATUS STARTING 2019 WILL RELEASE FINANCING
                            CAPACITY FOR ENERGY TRANSFORMATION PLAN

       MUSD                                                                                                                                           4.0
                                                                             TEN 30
           500
                                                                                                                                                      3.5

           400
                                                                                                                                                      3.0
                                                       TEN 35                                                         Debt capacity to
                                                                                                                   finance new CAPEX
                                                                                                                      will increase to                2.5
           300                                                                                                      ~US$1.5bn @ 3.5x
                                                                            IEM & Port                                 Debt/EBITDA
                                                                               436                                                                    2.0

                                                     IEM & Port
           200              TEN 20                      314                                      IEM & Port
                                                                                                                                                      1.5
                                                                                                    197
                            IEM & Port
                               109                                                                                                                    1.0
                                                                                                                  IEM & Port 33
           100
                                                                                                                    Recurring
                                                                                                                                                      0.5
                            Recurring                                                            Recurring
                               88                     Recurring             Recurring               87                 97            Recurring
                                                         56                    58                                                       58
               0                                                                                                                                      0.0
                             2015                       2016                     2017              2018               2019               2020
                                                            EBITDA (left axis)           Net Debt-to-EBITDA (right axis)

  (*) Recurring CAPEX includes upgrade investing in transmission assets

Engie Energía Chile - Presentation to Investors – 9M 2018                                                                                        19
GUIDANCE: MASTERING THE GROWTH ACHIEVED & STARTING OUR TRANSFORMATION

KEY DRIVERS FOR OUR RESULTS

   Contractual position
       +      PPA w/distribution co’s.
       -      PPA renegotiation
                                                                                                         US$ 160 to 180 mln
   Prices
       -      Coal prices
       -      Hydrologic conditions                                                                          US$ 450 to
                                                                                 US$ 140 to 150 mln           470 mln
   Power supply
       -      Delay in full interconnection                                         US$ 350 to
       -      IEM COD 1Q19 (vs.4Q18)                         US$ 87 mln              370 mln
       +      U12/U13 plant closure
                                                            US$ 276 mln
       +      Bridge supply contracts
                                                                                                           1,250 to 1,350
                                                                                                              MW avg.
   Demand                                                                          1,000 to 1,100
                                                                                      MW avg.
       -      Client migration                              ~937 MW avg.
       +      Mining investment + electric mobility

   Regulation                                                  2017                    2018                    2019
       -      Green taxes
                                                              Contracted Sales       EBITDA         Net Recurring Income

     Source: Engie Energía Chile

Engie Energía Chile - Presentation to Investors – 9M 2018                                                             20
AGENDA

     Snapshots

     Key messages

     Financial update

     Addenda

Engie Energía Chile - Presentation to Investors – 9M 2018   21
FINANCIAL UPDATE

REGULATED REVENUE FROM NEW PPA WITH DISTRIBUTION
COMPANIES LARGELY EXPLAINS THE 39% EBITDA INCREASE

      By main effect
      In US$ Million

                                                                                                                +6                      +1                   (53)
                                                          +16                        +3
                               +135                                                                                                  OPEX &
                                                                     Insurance                                  TEN
                                                                                                                                      SG&A                                              (18)
                                                         Contract recovery                                     result
                                                        prices (net)    (BI)                               (50% share)
                                                                                                                                                           Spot                                                        (10)                        278
                                                      Renegotiation (-15)
                                                        Fuel prices &
                                                                                                                                                         purchases                Margin
                                                                                                                                                           (net)                  other                             Sales to
                                                         other (+31)
                                                                                                                                                                                businesses                            free
                                                                                                                                                                                     Gas &                          clients
            200                                                                                                                                                                  Transmission                         (end RT
                                                                                                                                                                                      tolls                             PPA)
                            Regulated
                             energy                                                                                                                                             (reliquidations)
                              sales
          EBITDA            new PPA                                                                                                                                                                                                               EBITDA
           9M17              w/Distr.                                                                                                                                                                                                              9M18
                              Co’s.

            EBITDA 9M17      Energy sales - new PPA      Contract prices (net)   Insurance recovery (BI)   Net income share in TEN   OPEX & SG&A costs    Spot purchase costs     Margin gas & transmission   Physical sales - unregulated PPAs    EBITDA 9M18
                               w/distribution co's                                                                                                                                     (reliquidations)

Engie Energía Chile - Presentation to Investors – 9M 2018                                                                                                                                                                                22
FINANCIAL UPDATE

OPERATING RESULTS EXPLAIN THE NET RECURRING INCOME INCREASE

     In US$ Millions                                            Recurring Results
                                                                                                      121
                                                                                                       +7
                                                                                                     minority     +4          (52)
                                                                          +2          +2             interest
                                                             +57
                                                                                                                Insurance
                                                                       Financial      Other                      recovery
                                                                       expenses      FX Diff.                     (PD)
                                                                                   Depreciation 
                                                                                                                                            73
            69                                                                     Tax effects 
                                                                                                                                            +7
            +6                                     61                                                                                     minority
        minority                                    +6                                                                                    interest
        interest                (8)             minority                                                                    Impairment
                                                interest                                                                     U12 + U13
                          Insurance                          EBITDA
                           recovery                         increase
                             (PD)

                                                 Net                                                   Net
          Net                                                                                                                               Net
                                              Recurring                                             Recurring
        Income                                                                                                                            Income
                                               Income                                                Income
         9M17                                                                                                                              9M18
                                                9M17                                                  9M18

         Net income increased despite the U.12 & U.13 impairment
Engie Energía Chile - Presentation to Investors – 9M 2018                                                                            23
FINANCIAL UPDATE

NET DEBT EVOLUTION REVEALS STRONG CASH GENERATION

       Main cash flows
       In US$ Million
                                                                                         +36         +28      (280)
                                                                           +36
                                                              +59
                                                                                                    Income
                                     +161                                              Accrued
                                                                         Dividends                   Taxes
                                                            Financial    (including   Interest +
                                                                         40% CTH)         var.                                811
              771                                             lease
                                                                                       deferred
                                                              (tolling                                       Operating
                                 CAPEX (*)                  agreement                  financial             cash flow
                                                             w/TEN)                   cost + var.
                                                                                       MTM on
                                                                                        hedges

         Net Debt                                                                                                         Net Debt
           as of                                                                                                            as of
         12/31/17                                                                                                         09/30/18

         (*) excludes capitalized interest

              •     CAPEX mostly financed with operating cash flow

              •     Net debt increase explained by tolling agreement on TEN’s dedicated transmission assets, which is
                    accounted for as a financial lease

Engie Energía Chile - Presentation to Investors – 9M 2018                                                                24
FINANCIAL UPDATE

ROBUST FINANCIAL STRUCTURE: ROOM FOR FURTHER GROWTH

     Net debt/EBITDA below 3.0x                                                            NET DEBT/EBITDA ≤ 3.0 X

      • Strong cash flow generation                                4.00
                                                                  3.500
                                                                                                                             2.8
      • Proceeds from asset sales (TEN) in 2016                    3.00
                                                                  2.500                                                                       2.3
                                                                                              2.0
                                                                   2.00     1.6                              1.7
                                                                  1.500
     Rating confirmed @ BBB (Stable Outlook)                       1.00
                                                                   .500
      • International: S&P & Fitch (July 2018)                       .00
                                                                           Dec 14          Dec 15           Dec 16          Dec 17        Sep 18 (LTM)
      • National scale: Fitch (Jul-18): AA- Stable Outlook;
        Feller Rate (Dec-17): A+ Positive Outlook

                                                                            MODERATE DEBT INCREASE, WITH LOWER
                                                                                      AVERAGE COST
     Debt details:
                                                                            In US$ Millions
                                                                                                                                             910
      • US$ 750 million 144-A/Reg S Notes:                        1,000                                                                                    7%
                                                                                                                            850
                                                                    900
          • 5.625%, US$400 million 2021 (YTM=3.785% at 9/28/18)              750              750            750                                           6%
                                                                    800
          • 4.500%, US$350 million 2025 (YTM=4.516% at 9/28/18)                                                                                            6%
                                                                    700             5.1%             5.1%            5.1%
      • 2.614%, US$115 million bank loans maturing 2018/19          600                                                            4.7%             4.8%
                                                                                                                                                           5%
                                                                    500                                                     772              817
                                                                                                                                                           5%
      • US$60 million 20-yr. financial lease w/TEN for              400                       603
                                                                             481                             471                                           4%
        dedicated transmission assets                               300
                                                                    200                                                                                    4%
      • US$200 million bank revolving credit facility maturing              2014              2015          2016            2017           Sep-18
        June 2020 (undrawn)                                                          Net Debt           Gross Debt           Average coupon rate

Engie Energía Chile - Presentation to Investors – 9M 2018                                                                          25
FINANCIAL UPDATE

     SHAREHOLDER RETURN

                                          DIVIDENDS PAID                                                                                 MARKET CAP & DIVIDEND YIELD
         In US$ Millions                                                                                                     In US$ Millions
90               100%                                                                            100%                                                                                                                  6.00%
                                                           78                                    90%                                                                                5.4%
80
                                                           7                                     80%
                                                                                                                     2,000                                                                                             5.00%
70

                                                                                                 70%
60          56                                                                                                                                                                                                         4.00%
                                                                                                                     1,500                             3.4%
                                                                                                 60%
50                            47
            17                                                                                   50%                                                                                                                   3.00%
40                            12                                                                                                                                                             2,265
                                           34              72                                    40%                 1,000
                                                                                                                                                                                                            1,941
                                    30%           30%               30%        30%     30                                             2.3%                            2.2%
30
                                                                                                 30%                                           1,536                         1,657                                     2.00%
                                           20                                                                                                                 1,440
                                                                                                                              1,363
20          39                35                                          13                     20%                  500                                                                                           1.3%
                                                                                       30                                                                                                                              1.00%
10                                                                                               10%                                                                                                 0.8%
                                           14                             13
-                                                                                                0%                     -                                                                                              .00%
          2013               2014         2015            2016        2017           2018                                      2013            2014           2015           2016            2017           2018

                  Provisional & Additional                       Final               Policy %                                                          Market Cap                     Dividend Yield %

                                                                                      SHARE PRICE EVOLUTION
                                     June 30, 2017                                                                                                                                              Sept 30, 2018
                     130
                                    EECL: CLP 1,213                                                                                                                                        EECL: CLP 1,260 (+3.8%)
                                      IPSA: 4,747                                                                                                                                            IPSA: 5,283 (+11%)
                     120

                     110

                     100

                                                                                                                                                                      IPSA            ECL
                        90
                        Jun-17       Jul-17      Aug-17    Sep-17     Oct-17    Nov-17      Dec-17      Jan-18 Feb-18          Mar-18    Apr-18        May-18   Jun-18       Jul-18     Aug-18

                     Index: 3/31/17 = 100
                     Includes dividends
                     Dividend yield: dividends per share actually paid in year n divided by year n-1 closing price

     Engie Energía Chile - Presentation to Investors – 9M 2018                                                                                                                                 26
FINANCIAL UPDATE

KEY TAKE-AWAYS: VALUE CREATION FOR OUR STAKEHOLDERS

                         DELIVERY AND                          CLIENTS AND
                         DEVELOPMENT                            OPERATION

                                                            LEADERS IN ENERGY
                   IEM+PORT COD 1Q19
                                                            TRANSITION

                   RENEWABLES                               PPA PORTFOLIO
                   PORTFOLIO                                EXTENSION

                                                            NEW PPA WITH
                   ASSET ROTATION
                                                            DISTRIBUTION CO’S

                                                            CAPITAL STRUCTURE &
                   CUSTOMER SOLUTIONS
                                                            LEAN PROGRAM

Engie Energía Chile - Presentation to Investors – 9M 2018             27
AGENDA

     Snapshots

     Key messages

     Financial update

     Addenda

Engie Energía Chile - Presentation to Investors – 9M 2018   28
ADDENDA

LONG-TERM CONTRACTS: THE BASIS FOR STABLE SALES
VOLUMES AND PRICES

                                                                ENERGY SALES AND PRICES
   Energy sales                                                                                                                                         Prices
      GWh                                                                                                                                              US$/MWh

          3,000                                                                                                                                         150

          2,500

          2,000                                                                                                                                         100

          1,500

          1,000                                                                                                                                         50

            500

              -                                                                                                                                          -
                      1Q15       2Q15       3Q15       4Q15   1Q16   2Q16    3Q16   4Q16    1Q17    2Q17       3Q17   4Q17   1Q18     2Q18    3Q18

                              Unregulated                                   Regulated                                 Spot
                              Energy+Capacity Price->Unregulated            Energy+Capacity Price->Regulated          Spot Energy Price-Crucero
                              Spot Energy Price-Quillota

              •      Energy contract prices have moved in line with fuel prices
              •      Spot prices in the SIC have been sensitive to hydrologic conditions

Engie Energía Chile - Presentation to Investors – 9M 2018                                                                                         29
ADDENDA
DEMAND SUPPLIED WITH OWN GENERATION, SPOT PURCHASES
AND BRIDGE CONTRACTS, HEDGED BY OUR INSTALLED CAPACITY

                                           Renewables
                         Diesel 8%            1%

                                                              Coal 58%     •     Increasing spot purchases due to (i) coal, gas and
                                      Installed                                  renewable efficient capacity additions in the grid and (ii)
                Gas                   capacity                                   start of PPA with distribution companies in central Chile
                33%
                                     1,928 MW
                                        (Sept-18)                          •     Higher fuel prices, CO2 taxes and emission-reduction
                                                                                 costs have put pressure on average supply cost

                GWh
                                                ENERGY SOURCES AND AVERAGE SUPPLY COST                                                        US$/MWh

              3,000                                                                                                                                     150

              2,500

              2,000                                                                                                                                     100

              1,500

              1,000                                                                                                                                     50

                500

                   0                                                                                                                                    0
                         1Q15       2Q15      3Q15          4Q15   1Q16   2Q16   3Q16   4Q16   1Q17    2Q17    3Q17   4Q17     1Q18   2Q18   3Q18

                                   Coal          Gas          Diesel      Renewable     Bridge Contracts      Spot Purchases      Average Supply Cost

Engie Energía Chile - Presentation to Investors – 9M 2018                                                                                       30
ADDENDA

GENERATION AND SPOT ENERGY PRICE HISTORY IN THE SING

                       •     Limited exposure to hydrologic risk until interconnection is fully operative

                       •     Long-term contracts with unregulated clients (mining companies) accounting for 89% of demand
                             (bilateral negotiation of prices and supply terms)

                       •     Maximum demand: ~ 2,343 MW in 2018; expected 3.5% compounded average annual growth rate for
                             the 2017 -2026 period

        MW                                                                                                                                     US$/MWh
                                                                    Coal          Gas      Diesel      Renew.      Spot price
       3,000                                                                                                                                       350
                    Average generation (MW)
                    Marginal cost (US$/MWh)
                                                                                                                                                   300
       2,500

                                                                                                                                                   250
       2,000

                                                                                                                                                   200
       1,500
                                                                                                                                                   150

       1,000
                                                                                                                                                   100

         500
                                                                                                                                                   50

            0                                                                                                                                      0
             2004          2005      2006        2007       2008   2009    2010     2011   2012     2013   2014   2015   2016   2017        2018

Engie Energía Chile - Presentation to Investors – 9M 2018                                                                              31
ADDENDA

CURRENT REGULATORY AND GRID COORDINATION CHALLENGES
     MW                                         Generation North SEN – September 1 to 10, 2018                                                                   US$/MWh
     3,000                                                                                                                                                          100

                                                                                                                                                                      90
     2,500
                                                                                                                                                                      80

                                                                                                                                                                      70
     2,000
                                                                                                                                                                      60

     1,500                                                                                                                                                            50

                                                                                                                                                                      40
     1,000
                                                                                                                                                                      30

                                                                                                                                                                      20
       500
                                                                                                                                                                      10

          0                                                                                                                                                           0
              1 5 9 13 17 21 1 5 9 13 17 21 1 5 9 13 17 21 1 5 9 13 17 21 1 5 9 13 17 21 1 5 9 13 17 21 1 5 9 13 17 21 1 5 9 13 17 21 1 5 9 13 17 21 1 5 9 13 17 21
                       1               2                3         4              5              6              7              8              9             10
                           Solar                               Wind                                  Other                                  Coal Others
                           Coal EECL                           LNG EECL                              LNG Others                             Diesel
                           TEN Flows                           SING Demand                           Marginal Cost-Crucero 220kV

                           Penetration of intermittent renewable power sources and interconnection
                   •       Lower marginal costs during sun & wind hours; renewable power imports through the TEN line
                   •       Higher system costs to cope with intermittent output (more frequent CCGT start-ups, greater spinning
                           reserve required to thermal plants)
                   •       New ancillary services regulation required
                   •       Need to develop economic 24 x 7 renewable generation solutions
Source: CEN

Engie Energía Chile - Presentation to Investors – 9M 2018                                                                                                   32
ADDENDA

RECENT GAME CHANGERS IN THE CHILEAN POWER INDUSTRY

                   More agile, diversified, client-focused approach to face industry change

                      INCREASED                                     TECHNOLOGIC                        RECOVERY IN
                      COMPETITION                                   DISRUPTION                         DEMAND GROWTH

            More flexible power auction                       Lower investment cost of          Mining industry recovery
             regulations (Law # 20,805)                         renewable capacity                 w/copper >2.7 $/lb: revival
                 De-risked regulated PPA to                                                       of large mining projects
                  foster competition                           Shorter development period
                                                                for renewables                    GDP growth may be
            Falling energy prices                                                                 reversing
                                                               Improved plant efficiency
            Carbon footprint reduction                                                           Energy saving programs
             => PPAs indexed to CPI                            Lower operational costs            create x-sales opportunities
            Increased difficulty to                                                              Smart grid initiatives and
             execute projects                                                                      electric mobility

                                                                High penetration of
       Evolution of Market Design in                                                                 Trends began to
                                                            Renewables and new energy
            continuous change                                                                    reverse (copper >2.7 $/lb)
                                                              management products

Engie Energía Chile - Presentation to Investors – 9M 2018                                                       33
ADDENDA

THE “SEN”: A LARGER MARKET FOR ALL PLAYERS

                                                                                                SEN – Sep-2018
                                                                                                    24,095 MW
                                                                                                                                     7,844 MW

                       SING              SEN
                                       “Sistema             6,348 MW
                                                                78
                                       Eléctrico
                                       Nacional”                                                                                        3,865

                                                               3,450      4,133 MW
                        SIC                                                   291
                                                                                        3,310 MW
                                                                              831              45                                       1,370

                                                               127
                                                                                          1,611             1,928 MW
                                                                                                               10
                                                                                                              159
                                                               2,033
                                                                              3,011                           623                       2,609
                                                                                                                                         (*)
                                                                                          1,304
                                                                                                                          532 MW
                                                                                                              1,127
                                                               660                                                          532
                                                                                           350

                                                              Enel        AES Gener      Colbún              EECL          Kelar        Other
                                                            Generación

                                                                       Coal    Gas    Diesel        Hydro     Renewable     (*) Thermoelectric

Source:
CNE (www.cne.cl)

Engie Energía Chile - Presentation to Investors – 9M 2018                                                                                34
ADDENDA

PPA PORTFOLIO INDEXATION: SHIFTING AWAY FROM COAL

                    Overall indexation applicable to                                                                Overall indexation applicable to
                     electricity and capacity sales                                                                  electricity and capacity sales
                        (as of September 2018)                                                                           (2021, proforma PPA
                                                                                                                             renegotiation)
                                                                                                                                                               U.S. CPI
                  Gas 11.9%
                                                            U.S. CPI                                                                                           U.S. PPI
                                                            U.S. PPI                                                                                          Node Price
                                                             Node                                                                                               63.4%
                                                             Price
             Coal                                            51.0%
            35.8%               1,527 MW                                                                                           1,467 MW
                               Contracted *                                                                   Coal                Contracted *
                                                                                                             23.3%

                  Marginal                                                                                           Marginal
                   Cost                                                    Indexation frequency:                      Cost                           Gas
                   1.1%                                                      Regulated : Semiannual                   1.1%                          11.9%
                                                                                Others : Monthly
             (*) Maximum contracted demand as of September 2018                                                    (*) Maximum contracted demand projected for 2021

        EMEL contract tariff adjustment:                                                         New PPA with distribution Co’s tariff adjustment:
        •     Energy tariff: ~40% US CPI, ~60 % Henry Hub gas price:                             •    Energy tariff: ~66.5% US CPI, ~22% coal, 11.5% HH gas:
              •    Based on average HH reported in months n-3 to n-6                                  •   Based on average HH reported in months n-3 to n-8
              •    Immediate adjustment triggered in case of any variation of 10% or more             •   Immediate adjustment triggered in case of any variation of 10% or more

        •     Capacity tariff per node price published by the National                           •    Capacity tariff per node price published by the National
              Energy Commission (“CNE”)                                                               Energy Commission (“CNE”)

Engie Energía Chile - Presentation to Investors – 9M 2018                                                                                                35
ADDENDA

TRANSMISSION
           Infrastructure                                EECL, a relevant player in the transmission business

                                                                                      EECL operates 23 substations with
                                        2,293 kms.                                       total capacity of 844 MVA

                                           844 MVA
                                                                                                               5
             US$ 16 million regulated revenue p.a.
                                                                                      Transmission
                                                                                      substations

                                          EECL operates 2,293 kms.
                                            of transmission lines                     Generation                      844
                                                                                      substations                     MVA
                                                                                                                                18

                                                    Kms of transmission lines
                  891
                                                                     8%

                                                                      2,293
                                                                      Kms.               AVI + COMA for National & Zonal systems
                                                                                                         (in millions of US$)
                                                                          92%

                                                       Owned & Operated    Operated

                  589
                                                                                                                      6

                                                                                                     US$ 16 million              National toll
                                                                           351                                                   Zonal toll
                  124                                                                          10
                                                 213
                  98                                                       28
             Dedicated                        National                    Zonal

                           13.8-23 kV       66 kV      110 kV   220 kV

Engie Energía Chile - Presentation to Investors – 9M 2018                                                                       36
ADDENDA

TRANSMISORA ELÉCTRICA DEL NORTE S.A. “TEN” (PAGE 1 OF 2)
           Infrastructure –
           Regulated                                        ~US$0.8bn investment, 50%-owned by EECL

                                                                                                                                    •     Regulated revenues on “national
                                      •          Double circuit, 500 kV, alternate                                                        assets” + contractual toll on
                                                 current (HVAC), 1,500 MW, 600-                                                           “dedicated assets”
                                                 km long transmission line
                                                                                                                                    •     Turnkey EPC contracts:
                                      •          National transmission system
                                                                                                                                         •   Transmission lines: Ingeniería y
                                                 interconnecting SIC and SING
                                                                                                                                             Construcción Sigdo Koppers
        Project                                  grids                                                           Main
                                                                                                                                         •   Substations: GE Grid Solutions
       Highlights                     •          COD: November 24, 2017                                        Contracts
                                                                                                                                    •     Project financing (see next slide)

            Kel
            ar
                                          3 km

                                                                                                                               S/S Nueva Cardones
                                                                                                         S/S Cumbre              (Interchile -ISA)
                 TEN-GIS
                                                                                                           500 kV              500 kV
            CT         13 km
            M3
                                                                                400 km                                190 km
                                                                                                                                                      Maitencillo
            CT                                                                                                                                            
            M2                   1,500 MVA
            IEM                                                                                                                                             S/S Cardones
                             220 kV                            TEN dedicated transmission line project                                       220 kV
                                            500 kV
                                                               TEN national transmission line project
                                                               Interchile (ISA) transmission project
                               S/S Los Changos                                                                                                                  Maitencillo
                                                               Existing lines
                                                               New projects tendered by the CNE
                                                                                                                                                                    

Engie Energía Chile - Presentation to Investors – 9M 2018                                                                                                      37
ADDENDA

TRANSMISORA ELÉCTRICA DEL NORTE S.A. “TEN” (PAGE 2 OF 2)
           Infrastructure –
           Regulated                                        ~US$0.8bn investment, 50%-owned by EECL

                                                                               VI                  Indexation             TEN’s annual revenues:
                                                                                                                                 (in USD millions
                                                                          In MUSD @ Oct      In CLP to      In USD to       at Sep.30, 2018 FX rates)
                                                                           2013 FX Rates     Chile CPI       US CPI
                                                                                                                            AVI (VI annuity): 75.5
                                                                             738.3            41%            59%
                                                                                                                          + COMA (O&M cost): 9.1
                                                                                                                          -------------------------------------------------------
                                                                                                                          = VATT                 84.6
                                                            Regulated &                                                   + Toll (paid by EECL): ~7.0
                                                             contracted
                                                                                                                          AVI = annuity of VI (Investment
                                   TEN                        revenue                                                      value) providing 10% pre-tax
                                                                           AVI + EECL toll ≈ MUSD 83, a good proxy of      return on assets (at least 7%
                                                                                       TEN’s EBITDA p.a.                  post-tax return beginning 2020)

                                                                                                      Project Financing
                                   SIC                                                                              Senior 18-yr USD Loan
                               expansion
                               Interchile                                                                           26-yr USD Fixed-rate note
                                 “ISA”                                                                              Senior 18-yr Local UF Loan
                                                                                     ~US$0.8 bn
                                                                                     of which >85%=                 Equity-RECh
                                                                                     Senior Debt
                                                                                                                    Equity EECL
                                                               Project
                                                             financing                                          Total senior debt = MUSD 707
                                                                                                              + Subordinated VAT Facility ≈ MUSD 90
                                                                                                                    (fully repaid as of 9/30/18)

Engie Energía Chile - Presentation to Investors – 9M 2018                                                                                  38
ADDENDA

INFRAESTRUCTURA ENERGETICA MEJILLONES. “IEM”
          Thermal contracted
          + port                                            Successful plant synchronization on October 29

                                      •    375MWe gross capacity =>                               •   Developed to supply distribution
                                           337MWe net base-load capacity                              companies
                                                                                                  •   Turnkey EPC contracts:
                                      •    Pulverized coal-fired power plant
                                                                                                      •   IEM plant: SK Engineering and
                                           meeting strict environmental                                   Construction (Korea)
                                           standards
                                                                                                      •   Port: BELFI (Chile)
        Project                                                                  Main contracts
       highlights                     •    Mechanized port, suitable for cape-    & Progress      •   Overall progress rate as of
                                           size carriers, already in operation                        Sept. 30, 2018: 99.2%

                                      •    Successful synchronization 29-
                                           Oct-18; maximum load & heat
                                           rate tests scheduled for mid-Jan.

                                      •    Rescheduled completion date:
                                           1Q19, following a short-circuit
      Ongoing                              incident during commissioning
    developments
                                      •    US$1.1 billion investment
                                           (95% paid as of 9/30/18)

Engie Energía Chile - Presentation to Investors – 9M 2018                                                               39
ADDENDA

COPPER INDUSTRY

     US¢/lb                                                                  Copper production in Chile ('000 tons)                                                             GWh
    6,500
       500                                                                                                                                                                      6,000
                                   Copper price LME (US¢/lb)                    SING Electricity demand (GWh)                   SIC Electricity demand (GWh)
          450
    5,500
                                                                                                                                                                                5,000
          400

    4,500
       350
                                                                                                                                                                                4,000
          300
    3,500
          250                                                                                                                                                                   3,000
                                                                                    5,557                                               5,776   5,761   5,772   5,553
                                                            5,413   5,321   5,361           5,328   5,394   5,419       5,263   5,434                                   5,504
       200
    2,500                                      4,904
                 4,602     4,739     4,581
                                                                                                                                                                                2,000
          150
    1,500
          100
                                                                                                                                                                                1,000
         50
       500
            0                                                                                                                                                                   0
                 2000      2001      2002      2003         2004    2005    2006    2007    2008    2009    2010        2011    2012    2013    2014    2015    2016    2017
      -500

      Chile’s world-class copper industry is facing challenges:                                                     Engie is prepared to help our clients:
      •    Scarce water resources => increasing sea water pumping                                                   •    Power production & transmission; financial
           and desalination needs => higher power costs;                                                                 strength; group expertise in the water business;
      •    New port infrastructure required;                                                                        •    Available port infrastructure;
      •    Need to keep cash cost under control;                                                                    •    Ready to provide energy efficiency services;
      •    More demanding environmental and social requirements =>                                                  •    Diversifying power sources to reduce carbon
           need to reduce carbon footprint.                                                                              footprint.

  Source: COCHILCO

Engie Energía Chile - Presentation to Investors – 9M 2018                                                                                                       40
ADDENDA

OWNERSHIP STRUCTURE

                                                  Pension funds           Local institutions    Foreign institutions         Individuals
                       52.76%                               25.49%                    15.20%                  6.12%                     0.43%

                                                                     ENGIE ENERGÍA CHILE S.A.
                     Inversiones Punta de                                                                       Red Eléctrica Chile
                         Rieles Ltda.                                        (“EECL”)                                  S.A.
                                      40%                                                                                       50%

          Central                                    Central                Gasoducto                Edelnor                 Transmisora
      Termoeléctrica                             Termoeléctrica            Norandino S.A.        Transmisión S.A.         Eléctrica del Norte
   Hornitos S.A. (“CTH”)                       Andina S.A. (“CTA”)                                                           S.A. (“TEN”)

                         60%                                100%                      100%                   100%                      50%

                            Electroandina                                   Gasoducto
                                 S.A.                                        Norandino
                                (port)                                     Argentina S.A.

                                            100%                                      100%

Engie Energía Chile - Presentation to Investors – 9M 2018                                                                   41
ADDENDA

EECL ORGANIZATIONAL STRUCTURE

                                                                Shareholders’
                                                                 assembly

                                        Committee                                           Functional committees:
                                                              Board of directors            -   Origination
                                        of directors
                                                                                            -   Development
                                                                                            -   Business knowledge
                                                                                            -   Regulation
                                                                      CEO                   -   Change management
                                                                                            -   Management
                                                                                            -   Steering Committees:
                                                                                                - IEM
                                      Internal auditor

                                                                                                                        Corporate
            Finance                            People       Legal           Commercial          Development
                                                                                                                         affairs

                          Portfolio
                                                                    Operations                                TEN
                         management

  • The Board of directors includes three independent members out of a total of 7 directors
  • The Committee of directors is formed by the three independent members and oversees all transactions among related parties

Engie Energía Chile - Presentation to Investors – 9M 2018                                                              42
FOR MORE INFORMATION ABOUT ENGIE ENERGIA CHILE

                                                                             Ticker: ECL

                                                            +562 2783 3307

                                                            inversionistas@cl.engie.com

                                                            http://www.engie.cl

                                          MORE INFORMATION ON 9M 2018 RESULTS IN OUR WEB PAGE

                                                                                                  2018
                                                                                                9 months

        Presentation                       Addenda                  Press           Recorded    Financial        Analyst
                                                                   Release         conference    report           pack
                                                                                    audiocast

Engie Energía Chile - Presentation to Investors – 9M 2018                                                   44
                                                                                                                           43
Disclaimer

Forward-Looking statements

This presentation may contain certain forward-looking statements and information relating to Engie Energía Chile S.A.
(“EECL” or the “Company”) that reflect the current views and/or expectations of the Company and its management with
respect to its business plan. Forward-looking statements include, without limitation, any statement that may predict,
forecast, indicate or imply future results, performance or achievements, and may contain words like “believe”, “anticipate”,
“expect”, “envisage”, “will likely result”, or any other words or phrases of similar meaning. Such statements are subject to a
number of significant risks, uncertainties and assumptions. We caution that a number of important factors could cause
actual results to differ materially from the plans, objectives, expectations, estimates and intentions expressed in this
presentation. In any event, neither the Company nor any of its affiliates, directors, officers, agents or employees shall be
liable before any third party (including investors) for any investment or business decision made or action taken in reliance
on the information and statements contained in this presentation or for any consequential, special or similar damages. The
Company does not intend to provide eventual holders of shares with any revised forward-looking statements of analysis of
the differences between any forward-looking statements and actual results. There can be no assurance that the estimates
or the underlying assumptions will be realized and that actual results of operations or future events will not be materially
different from such estimates.

This presentation and its contents are proprietary information and may not be reproduced or otherwise disseminated in
whole or in part without EECL’s prior written consent.

Engie Energía Chile - Presentation to Investors – 9M 2018                                                    45
You can also read