CREDIT SUISSE GLOBAL HEALTHCARE CONFERENCE - MARCH 2, 2021

Page created by Marion Hines
 
CONTINUE READING
CREDIT SUISSE GLOBAL HEALTHCARE CONFERENCE - MARCH 2, 2021
CREDIT SUISSE
GLOBAL HEALTHCARE
CONFERENCE

MARCH 2, 2021

                    © Copyright
CREDIT SUISSE GLOBAL HEALTHCARE CONFERENCE - MARCH 2, 2021
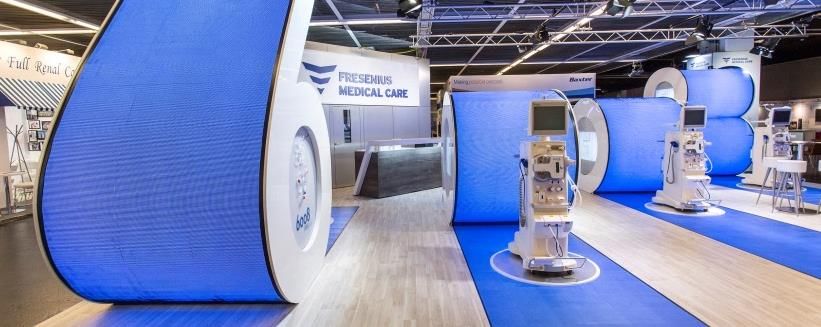
Safe harbor statement: This presentation includes certain forward-looking statements within the
meaning of Section 27A of the U.S. Securities Act of 1933, as amended, and Section 21E of the
U.S. Securities Act of 1934, as amended. Forward-looking statements are inherently subject to
risks and uncertainties, many of which cannot be predicted with accuracy or might not even be
anticipated. The Company has based these forward-looking statements on current estimates and
assumptions which we believe are reasonable and which are made to the best of our knowledge.
Actual results could differ materially from those included in the forward-looking statements due to
various risk factors and uncertainties, including changes in business, economic or competitive
conditions, changes in reimbursement, regulatory compliance issues, regulatory reforms, foreign
exchange rate fluctuations, uncertainties in litigation or investigative proceedings, cyber security
issues and the availability of financing. Given these uncertainties, readers should not put undue
reliance on any forward-looking statements. These and other risks and uncertainties are discussed
in detail in Fresenius Medical Care AG & Co. KGaA’s (FMC AG & Co. KGaA) Annual Report on Form
20-F under the heading “Forward-Looking Statements” and under the headings in that report
referred to therein, and in FMC AG & Co. KGaA’s other reports filed with the Securities and
Exchange Commission (SEC) and the Frankfurt Stock Exchange (Frankfurter Wertpapierbörse).

Forward-looking statements represent estimates and assumptions only as of the date that they
were made. The information contained in this presentation is subject to change without notice and
the company does not undertake any duty to update the forward-looking statements, and the
estimates and assumptions associated with them, except to the extent required by applicable law
and regulations.

If not mentioned differently the term net income after minorities refers to the net income
attributable to the shareholders of Fresenius Medical Care AG Co. KGaA. The term EMEA refers to
the region Europe, Middle East and Africa. Amounts are in Euro if not mentioned otherwise.

                                                                                                       © Copyright
CREDIT SUISSE GLOBAL HEALTHCARE CONFERENCE - MARCH 2, 2021
1   AT A GLACE

         2   STRATEGY

AGENDA   3   MEDICAL UPDATE

         4   BUSINESS UPDATE

         5   FINANCIALS & OUTLOOK
CREDIT SUISSE GLOBAL HEALTHCARE CONFERENCE - MARCH 2, 2021
FY 2020 | QUALITY ON A CONSISTENTLY HIGH LEVEL

                      +2% Clinics                +0% Patients
                      4,092                      346,553

                                                 Quality remains
                      +3% Treatments
                                                 on a consistently
                      53,575,255                 high level

      As of December 31, 2020

                                             Company Presentation   March, 2020   Page 4
CREDIT SUISSE GLOBAL HEALTHCARE CONFERENCE - MARCH 2, 2021
FY 2020 | €17.9BN REVENUE

NORTH AMERICA                                                            EMEA

           Operating                                                                  Operating
 Revenue                 Patients    Clinics                               Revenue                  Patients       Clinics
             Income                                                                     Income
                                                     70%                                                                                 15%
 €12.5bn €2,120m       ~210,300     ~2,640           of total                €2.8bn      €412m      ~66,000         ~800                  of total
                                                     revenue                                                                              revenue
  +4%cc     +20%cc           0%       +2%                                    +5%cc      (6)%cc           0%          +3%

LATIN AMERICA                                                            ASIA-PACIFIC

           Operating                                                                  Operating
 Revenue                 Patients    Clinics
             Income                                   4%                   Revenue
                                                                                        Income
                                                                                                    Patients       Clinics                11%
                                                     of total                                                                             of total
  €0.7bn   €(157)m      ~37,200       ~250           revenue                 €1.9bn      €344m      ~33,100         ~400                  revenue
 +21%cc         n.a.        +7%       +6%                                    +3%cc       +5%cc           0%            0%

                                                                                                                                      cc = at constant currency

              Segment revenue and operating income FY 2020, number of patients and clinics as of YE 2020, yoy change           Service                Product
                                                                                                                              revenue                 revenue

                                                                                                               Company Presentation   March, 2020       Page 5
CREDIT SUISSE GLOBAL HEALTHCARE CONFERENCE - MARCH 2, 2021
1   AT A GLACE

         2   STRATEGY

AGENDA   3   MEDICAL UPDATE

         4   BUSINESS UPDATE

         5   FINANCIALS & OUTLOOK
CREDIT SUISSE GLOBAL HEALTHCARE CONFERENCE - MARCH 2, 2021
WE ARE THE LEADING VERTICALLY INTEGRATED GLOBAL PLAYER

PRODUCTS SERVING MORE
                                                                                                                             LARGEST DIALYSIS
THAN HALF OF THE WORLD’S
                                                                                                                          NETWORK WORLDWIDE
DIALYSIS PATIENTS

                                                                                                                                              13,872

                                 3,604

             757                                                                                                            396

             1996                2019                                                                                     1996                 2019
 Health Care Products revenue (€ million)                                                                     Health Care Services revenue (€ million)

>150    m           >50,000          1 out of 2                        >4,000        Every 0.6        ~350,000                >50     m
                                                           Products                                                                              Dialysis treat-
                                                           available                                                                             ments provided
 dialyzers            dialysis             HD patients                  dialysis   seconds we pro-    dialysis patients         dialysis
                     machines               worldwide      in 150       centers     vide a dialysis                           treatments         in around 50
                                         treated with an   countries                  treatment                                  p. a.              countries
                                          FME machine      worldwide

                                                                                                                     Company Presentation   March, 2020   Page 7
CREDIT SUISSE GLOBAL HEALTHCARE CONFERENCE - MARCH 2, 2021
OUR RECIPE FOR SUCCESS

EMPOWER PEOPLE. ADVANCE CARE. INSPIRE WITH OUR PURPOSE AND VALUES.

                                                                                                                                                             LEADERSHIP
                                                                                                                                                             Our Management
                                                                                                                                                             Board and top leadership
                                                                                                                                                             provides the foundation

                                         DATA
                                                                                                                         MEDICAL
                                         SCIENTISTS
                                         Medical KPIs of more than                                                       EXPERTS
                                         50 million treatments                       5                             1     Our 300+ medical experts
                                         monitored and analyzed                                                          use data insights and latest
                                                                                                                         scientific findings

                                         HEALTH CARE
                                         PROFESSIONALS                                                                   RESEARCH &
                                         55,000 health care                         4                               2    DEVELOPMENT
                                         professionals2 serving                                                          1,200 highly qualified team
                                         350,000 patients                                                                members, 10,000+ patents
                                         in 50 countries

                                                                                                          3
                                                                                              PRODUCTION
                                                                                    16,000 employees1 at 45 production
                                                                                      sites in more than 20 countries

1 Full-time equivalents as at Dec. 31, 2019 | 2 Include nurses, patient care technicians and physician services

                                                                                                                                           Company Presentation   March, 2020   Page 8
CREDIT SUISSE GLOBAL HEALTHCARE CONFERENCE - MARCH 2, 2021
WE BELIEVE THAT HEALTH CARE IN THE FUTURE
WILL DIFFER FROM TODAY

                                                                                                  Global ageing                                                            Health care
                                                                                                  Life expectancy as well as                                               staff shortages
                                                                                                  population over 65 significantly                                         Global health workforce shortage to
                                                                                                  higher1,2                                                                increase further in coming decades

                                                                                                  Chronic diseases                                                         Cost pressure in
                                                                                                  More chronic patients, longer                                            health care systems
                                                                                                  treatment spans3; rising                                                 Health care systems in need
                                                                                                  costs of chronic diseases4                                               of sustainable solutions

                                                                                                                                                                           System limitations
                                                                                                  Fragmented care
                                                                                                                                                                           System designed for acute,
                                                                                                  One patient – several conditions –
                                                                                                                                                                           lack of concepts for multimorbid,
                                                                                                  numerous physicians
                                                                                                                                                                           chronic patients

                                     … disrupts the way we deliver health care
                                                                                                                       COVID-19 AND                                 … will affect health care provision
DIGITALIZATION today. Big data analytics and artificial                                                                                                             worldwide in many ways.
                                     intelligence provide new insights.                                                THE “NEW NORMAL”

1 Life expectancy has steadily increased for more than 150 years with no sign of deceleration. | 2 Between 2000 and 2030, the population over 65 years will more than double from 0.4 bn to 1.0 bn worldwide
(United Nations, Department of Economic and Social Affairs, Population Division (2019). World Population Prospects 2019, Volume II: Demographic Profiles (ST/ESA/SER.A/427)). | 3 The increasing number of
elderly citizens will lead to a rise in age-related chronic conditions. As people grow older, they will need to be treated longer for chronic conditions. In developed countries >50% of all people at retirement age
suffer from two or more chronic conditions simultaneously. | 4 Chronic diseases worldwide cause ~USD 8,000 billion in cost of illness every year.

                                                                                                                                                                     Company Presentation       March, 2020       Page 9
CREDIT SUISSE GLOBAL HEALTHCARE CONFERENCE - MARCH 2, 2021
KEY DRIVERS FOR OUR CORE DIALYSIS BUSINESS REMAIN INTACT

ADDRESSING GLOBAL HEALTH CARE CHALLENGES
      AGEING GLOBAL                                                                                                                                                            DIALYSIS
       POPULATION                                          HYPERTENSION                                                DIABETES                                                PATIENTS

        Global population                                      People living                                         People living                                        People on main-
           aged 65+1                                        with hypertension2                                       with diabetes3                                       tenance dialysis4

                    1.0                                                                                                        578                                                    >6
          2030

                                                                                                                     2030

                                                                                                                                                                         2030
                 billion                                                                                                    million                                               million

      +150%                                                                                                       +280%                                               +460%

                                                              One out of four
             2000

                                                                                                                        2000

                                                                                                                                                                               2000
                     0.4                                     people worldwide                                                   151                                                   1.07
                    billion                                  has hypertension!                                                 million                                                million

1 United Nations, Department of Economic and Social Affairs, Population Division (2019). World Population Prospects 2019, Volume II: Demographic Profiles (ST/ESA/SER.A/427)
2 WHO Global Health Observatory (people >18 years of age) | 3 IDF Diabetes Atlas 2019 (9th edition) | 4 FME Long Range Patient Projection

                                                                                                                                                            Company Presentation      March, 2020   Page 10
THE NEXT STEP IN OUR STRATEGY

RENAL CARE CONTINUUM

           NEW RENAL CARE                                                              CKD AND                                    RENAL
                                                VALUE-BASED CARE
           MODELS                                                                      TRANSPLANTATION                            INNOVATIONS
Transforming renal care               Create medical value while             Treat patients holistically across       Disrupt the way we
with new digital tools:               keeping care affordable:               the Renal Care Continuum:                do dialysis today:
 ▪   Personalized medicine             ▪ Leverage global network and          ▪ Expand value-based care programs       ▪ Cell therapy
 ▪   Expansion of renal care models      vertical integration                   to CKD                                 ▪ Biomaterials with functional
 ▪   Therapeutic innovations           ▪ Drive the development towards a      ▪ Include kidney transplantation in        compatibility to organs and living
 ▪   Holistic home care                  pay-for-performance system             value-based care                         systems
                                       ▪ Offer patients freedom and choice                                             ▪ Enable xeno transplantation
                                         for best treatment options

                                                                                                                    Company Presentation   March, 2020   Page 11
THE NEXT STEP IN OUR STRATEGY

COMPLEMENTARY ASSETS                           CRITICAL CARE
Building out our network and leveraging core   Leverage expertise to address multiple
competencies by partnerships, investments      health challenges
and acquisitions                                Further expand portfolio of critical care products, such as:
 ▪   Coordinating patients efficiently          ▪ Highly effective solutions for renal replacement therapy
 ▪   Standardizing medical procedures             for plasma exchange in a critical care setting
 ▪   Operating outpatient facilities            ▪ Therapies for lung failure via CO2 removal and
 ▪   Innovating products                          oxygenation with acute respiratory failure

                                                                                    Company Presentation   March, 2020   Page 12
THE NEXT STEP IN OUR STRATEGY

LEVERAGING OUR CORE COMPETENCIES

  VALUE-BASED CARE                               CKD AND TRANSPLANTATION
  Create medical value while keeping care         Treat patients holistically across
  affordable                                            the Renal Care Continuum

  NEW RENAL CARE MODELS                            RENAL CARE INNOVATIONS
  Transforming renal care                                  Disrupt the way we
  with new digital tools                                      do dialysis today

  COMPLEMENTARY ASSETS                             CRITICAL CARE SOLUTIONS
  Building out our network and leveraging   Leverage expertise to address multiple
  core competencies by partnerships,                             health challenges
  investments and acquisitions

                                                   Company Presentation   March, 2020   Page 13
SUSTAINABILITY PRIORITIES

COMMITTED TO LONG-TERM SUSTAINABLE DEVELOPMENT

                                INTEGRATION DRIVERS

                                   Global effort
                                   Global sustainability program drives strategic efforts to
                                   integrate sustainability into our business over three years
                                   from 2020-2022: focus on material areas Patients,
                                   Employees, Anti-bribery and –corruption, Human/labor
                                   rights, Data privacy and security, Environment, Sustainable
                                   supply, Occupational health and safety

                                   Targets
                                   Management Compensation System 2020+ linked
                                   to sustainability targets

                                    Strategic approach
                                    Long-term focus on activities that support our mission
                                    to provide theXXXXX
                                                   best possible care and deliver sustainable
                                    solutions for ever more patients in diverse health care
                                    systems
                                                                   Company Presentation   March, 2020   Page 14
2020 SUSTAINABILITY PROGRESS

  ON TRACK TO ACHIEVE CONTINUOUS IMPROVEMENTS

   Commitment                            Performance                             Transparency
   Global standards defined              New global KPI defined                  >100 KPI included in
   for patient care, human               for patient feedback,                   Non-financial Report
   & labor rights and                    product quality,
   supplier management                   sustainable supply,
                                         compliance

      Common responsibilities                  Measurable progress                    Increased disclosure

   SUSTAINABILITY HIGHLIGHTS

        > 440                     8%                >70 Green & Lean              37,000                        Included in Dow
Product improvements      Increased employee       initiatives to reduce   Third parties assessed             Jones Sustainability
    implemented             engagement rate       environmental impact      for compliance risks              Index for 11th time

                                                                                       Company Presentation    March, 2020   Page 15
THE WAY FORWARD

CAPTURING SUSTAINABLE, PROFITABLE GROWTH POTENTIAL

GEO          REVENUE CAGR            CONTRIBUTION                        CONTRIBUTION
VIEW         2020 – 2025             in % of Revenue 2025                in % of Operating Income 2025

                 MID-SINGLE TO
NA
AMPLE ROOM FOR GROWTH 2020 – 2025

ROIC IN % | OUTLOOK 2025: 7.0% – 7.5%

    FUNDING                                               USE OF FUNDING

                                                         GROWTH

                                                                                                                   5,0
                                                                         0.2               0.5
         17,0                                              5,2                                                 Potential to
                                                                                                                generate
                                                                                                             upside to mid-
                                                                                                              term targets
                                             3,5
                               2,6
       Cashflow from          Estimated    Maintenance   Renal Care   Critical Care   Complementary
  Operations available for   Sustainable      Capex      Continuum     Solutions         Assets
 investments (2020-2025)      Dividend

                                                                                      Company Presentation   March, 2020   Page 17
STRONG TRACK RECORD

MID-TERM COMMITMENT: 3.0 – 3.5x (INCL. IFRS 16)                                                                           STABLE INVESTMENT-GRADE RATING
NET DEBT/EBITDA TARGET CORRIDOR

                                                                    3.2x                                                   Current
                                                                    incl. IFRS 16                 2.9x                     ratings                                    Rating                    Outlook
                                                                                         excl. relief funding
                                                                                                                           S&P                                            BBB                      stable
2.1x
                                                                                                  2.7x                     Moody‘s                                      Baa3                       stable
                                                                    2.5x
                                                                    excl. IFRS 16                                          Fitch                                        BBB-                       stable
                                  1.8x

2017                            2018                             2019                              2020

  STRONG AND STABLE                                   MAINTAIN                                            HEADROOM FOR                                         HOLISTIC OPEX AND
  CASH FLOW                                           FINANCIAL                                           ORGANIC AND                                          CAPEX MANAGEMENT
  GENERATION                                          RESILIENCE                                          INORGANIC
                                                                                                          GROWTH

Ratios based on €-figures according to IFRS. | 2017 – 2019 → Excluding IFRS 16 | 2019 – 2020 → Including IFRS 16 | 2020 excl. U.S. federal relief funding and advanced payments under the CARES Act | Latest
rating update: S&P: May 23, 2019; Moody’s: May 20, 2020; Fitch: April 9, 2020

                                                                                                                                                           Company Presentation      March, 2020     Page 18
1   AT A GLACE

         2   STRATEGY

AGENDA   3   MEDICAL UPDATE

         4   BUSINESS UPDATE

         5   FINANCIALS & OUTLOOK
CONFIRMED COVID-19 CASES THROUGHOUT 2020

   GLOBAL | COVID-19 CASES                                                      FME | COVID-19 CASES GLOBALLY

700.000
                                                                           2.500

600.000
                                                                           2.000
500.000

400.000                                                                    1.500

300.000
                                                                           1.000
200.000
                                                                             500
100.000

     0                                                                          0
     Jan-20        Apr-20        Jul-20        Oct-20         Jan-21            Dec-19        Mar-20         Jun-20           Sep-20           Dec-20

              Rolling 7-day average of daily new confirmed COVID-19 cases. Left chart: global data of John Hopkins University CSSE COVID-19
              Data (February 15, 2021), right chart: FME data based on internal sources

                                                                                                              Company Presentation   March, 2020   Page 20
Q4 2020 | QUALITY OF CARE ON A HIGH LEVEL

                                               NORTH AMERICA                      EMEA               LATIN AMERICA                 ASIA-PACIFIC

% of patients                                 Q4 2020       Q4 2019      Q4 2020       Q4 2019      Q4 2020      Q4 2019        Q4 2020          Q4 2019

Kt/V ≥ 1.2                                       97            97           93            94           91          91              94                 95

Hemoglobin = 10–12 g/dl                          71            71           82            82           48          50              52                 56

Calcium = 8.4–10.2 mg/dl                         81            81           78            79           73          76              72                 74

Albumin ≥ 3.5 g/dl                               80            81           90            89           89          91              91                 87

Phosphate ≤ 5.5 mg/dl                            59            60           80            80           76          76              64                 63

Patients without catheter
                                                 79            81           77            78           78          79              81                 83
(after 90 days)

in days

Days in hospital per patient year               9.7           10.3          7.7          7.5          4.0         4.3              3.5                2.6

                Definitions of quality parameters cf. 2019 Annual Report, Section “Non-Financial Group Report”

                                                                                                                 Company Presentation   March, 2020    Page 21
PATTERN OF EXCESS DEATHS DUE TO COVID | 2020 VS. 2019

                                               Δ = 3,705

                                Δ = 2,934
                   Δ = 2,739
                                                                     Excess deaths due
      Δ = 1,001                                                      to COVID-19 were
                                                                     10,379 in 2020
                                                                     compared to
                                                                     traditional seasonal
                                                                     trends for 2019

       Q1            Q2           Q3              Q4

                  TOTAL: 2019    TOTAL: 2020

                                                           Company Presentation   March, 2020   Page 22
WHAT WAS THE IMPACT ON THE DEMOGRAPHICS OF OUR PATIENTS?

                    2020   2019   2018
NORTH AMERICA                                ▪ This does not yet
                                               support a hypothesis
Age (years)         62.8   62.8   62.6
                                               that the mortality
Diabetes %          64.0   63.7   62.9         rate will be less than
                                               the pre-pandemic
                                               baseline
EMEA
                    2020   2019   2020       ▪ The demographics of
                                               the population have
Age (years)         68.6   68.5   68.5         not changed
Diabetes %          31.6   32.6   32.7       ▪ The excess mortality
                                               is seen in all age
                                               cohorts of our
                                               patients

                                          Company Presentation   March, 2020   Page 23
GENERAL PERCENT OF POPULATION VACCINATED BY REGION

                                                                                             North
8                                                                                            America

6
                                                                                             Europe            ▪ Population (or “herd”)
                                                                                                                 immunity requires
                                                                                                                 70-85% of the
4                                                                                                                population to have
                                                                                                                 immunity from either
                                                                                             South               vaccination or
2                                                                                            America             exposure
                                                                                             Asia

0
    1-Jan   8-Jan        15-Jan        22-Jan        29-Jan          5-Feb        12-Feb

            Cumulative COVID-19 vaccination doses administered per 100 people (Official data by Our World in Data as of February 16, 2020)

                                                                                                            Company Presentation   March, 2020   Page 24
1   AT A GLACE

         2   STRATEGY

AGENDA   3   MEDICAL UPDATE

         4   BUSINESS UPDATE

         5   FINANCIALS & OUTLOOK
FY 2020 | MAINTAINING GROWTH IN A CHALLENGING YEAR

                                                         >      Financial targets for 20201 achieved

                                                         >      Q4 impacted by:

                                                            >      Goodwill impairment in Latin America and

                                                            >      Accelerated COVID-19-related excess mortality
                                                                   in North America and EMEA

                                                         >      Growth in home dialysis in the U.S. on track

                                                         >      24th consecutive dividend increase planned to be
                                                                proposed

      1   FY 2020 targets for revenue and net income growth at constant currency excluding special items (Latin America impairment of
          €195 million) and on an adjusted 2019 basis.

                                                                                                         Company Presentation   March, 2020   Page 26
Q4 2020 | COVID-19 INCREASINGLY BURDENSOME FOR EARNINGS

                                        Q4 2020            Q4 2019             Growth              Growth
                                          € million          € million              in %             in %cc

Revenue                                  4,400              4,580                  (4)                   4

                                                                                                                         ▪ COVID-19
                                                                                                                           negatively affecting
Operating income                            462                616               (25)                (18)                  top-line growth
                                                                                                                         ▪ Increased costs for
Excl. special items /                                                                                                      PPE and higher
                                            657                 663                 (1)                  5
adjusted
                                                                                                                           compensation for
                                                                                                                           frontline workers
                                                                                                                         ▪ Substantial
Net income                                  177                343               (48)                (43)                  headwinds from FX
                                                                                                                           translation
Excl. special items /
                                            372                 368                   1                  6
adjusted

                                                                                                                               cc = at constant currency

              Q4 2019 excl. effects from: NxStage costs, Cost Optimization Program and Care Coordination Gain/Loss. | Q4 2020 excluding
              Latin America impairment of goodwill and tradenames (€ 195m).

                                                                                                              Company Presentation   March, 2020      Page 27
FY 2020 | STRONG NET INCOME PERFORMANCE

                                                         2019 Basis
                                   2020 Results          for Targets              Growth              Growth                                Guidance 2020
                                           € million           2020                    in %              in %cc
                                                               € million

                                                                                                                           Mid to high single digit
Revenue                                 17,859              17,477                       2                   5
                                                                                                                                        cc growth

Net income                                 1,164               1,200                   (3)                 (1)

Excl. special items /                                                                                                      Mid to high single digit
                                          1,359               1,236                    10                  12
adjusted                                                                                                                                cc growth

                                                                                                                                         cc = at constant currency

          Special items are effects that are unusual in nature and have not been foreseeable or not foreseeable in size or impact at the time of
          giving guidance. | FY 2019 excl. effects from: NxStage costs, Cost Optimization Program and Care Coordination Gain/Loss. | FY 2020
          excluding Latin America impairment of goodwill and tradenames (€ 195m).

                                                                                                                  Company Presentation      March, 2020      Page 28
DIVIDEND INCREASE PLANNED TO BE PROPOSED

DIVIDEND PER SHARE IN EUR
                                                       +11.7%
                                                                               1.341
                                                                                                        DIVIDEND
 5Y-CAGR +10.9%
                                                                1.20
                                               1.17
                                                                                                        ▪ 24th consecutive
                               1.06                                                                       dividend increase
                                                                                                          planned to be
               0.96
                                                                                                          proposed
                                                                                                        ▪ Planned dividend
  0.80                                                                                                    proposal would
                                                                                                          assure dividend
                                                                                                          continuity despite
                                                                                                          COVID-19 challenges
  2015         2016            2017            2018             2019            2020
         1   Planned dividend proposal for 2020 of €1.34 to be approved by the AGM on May 20, 2021

                                                                                                     Company Presentation   March, 2020   Page 29
2021 | TAIL- AND HEADWINDS

    TAILWINDS
    •   Growth in value-based care programs
    •   Medicare Advantage
    •
    •
        Higher adoption of home dialysis
        Effect from completion of cost optimization measures                 FME25
                                                                             Transformation of
                                                                             global operating
    HEADWINDS                                                                model to sustainably
    • Impact from COVID-19 on treatment volumes and increased costs          reduce the cost base
    • Reduced clinic utilization limits ability to absorb:                   and support our 2025
         • Wage inflation                                                    targets
         • Fixed cost inflation
    • COVID-19 related SG&A savings realized in 2020
    • Calcimimetics
    • Transactional FX losses

                                                                      Company Presentation   March, 2020   Page 30
1   AT A GLACE

         2   STRATEGY

AGENDA   3   MEDICAL UPDATE

         4   BUSINESS UPDATE

         5   FINANCIALS & OUTLOOK
2020 TARGETS ACHIEVED

                                                             5% Revenue growth cc                               Reported
                            1.092
                                                                     18,395
                                                 -174

                                                                                                                 17,859
                                                                                              -536
     17,477
                                                                                                                                 Targets 2020
2019 revenue basis Business growth cc         Net COVID-           2020 revenue               FX               2020 revenue
 for targets 2020                             19 effect cc      target achievement                                                     Achieved our target
                                                                                                                                       2020 for revenue
                                    12% Net Income growth cc
                                                                                                                                       and exceeded net
                  193
                                                                                                                                       income growth at
                                                  1,379
                                    -50
                                                                                 1,359
                                                                                                                                       constant currency
                                                                   -20

   1,236

                                                                                                                   1,164
                                                                                                     -195

   2019 net     Business       Net COVID-        2020 net           FX          2020 net       Special item:     2020 net
income basis    growth cc      19 effect cc   income target                   income excl.     Latin America      income
  for targets                                  achievement                    special items     impairment
     2020

                                                                                                                              Company Presentation   March, 2020   Page 32
Q4 2020 | ORGANIC GROWTH ON A GLOBAL BASIS

NORTH AMERICA     € million

Revenue             2,983     (6%)
                                     NORTH AMERICA
Organic growth                (1%)                                                              EMEA
                                     68%
                                                                                                 16%

EMEA
                                                        4,400
                  € million
                                                          €m                       ASIA-PACIFIC
Revenue               715      1%                                                          12%
                                                          +1%
Organic growth                 5%                        (Organic)

ASIA-PACIFIC      € million                                                       LATIN AMERICA
                                                                                            4%
Revenue               517      4%

Organic growth                 8%
                                      ▪ North America negatively impacted by
                                        COVID-19
LATIN AMERICA     € million           ▪ Solid organic growth development outside
Revenue               177     (9)%      North America
Organic growth                 9%     ▪ Unfavorable FX developments in all regions

                                                           Company Presentation   March, 2020   Page 33
Q4 2020 SERVICES | MORE PRONOUNCED IMPACT BY COVID-19

                                                                                                   Same market
                                                                                         Organic
                                  Q4 2020
                                    € million
                                                Q4 2019
                                                 € million
                                                             Growth
                                                                    in %
                                                                               Growth
                                                                                in %cc
                                                                                         growth
                                                                                                     treatment
                                                                                                        growth
                                                                                                                         Drivers
                                                                                            in %
Revenue                                                                                                    in %

Health Care Services                 3,406        3,607              (6)            2         0              1           + Negative prior year
North America                        2,704         2,893                 (7)        1        (1)             0
                                                                                                                           revenue effect
 of which Care Coordination             292          325           (10)           (2)         1
                                                                                                                         + Reimbursement
                                                                                                                           increases
EMEA                                    337          352                 (4)        1         0            (1)
                                                                                                                         + Treatment growth
Asia-Pacific                            235          230                  2         5         7              9
                                                                                                                         − Loss of treatments
 of which Care Coordination              77           68                 14        15        10                            due to COVID-19
Latin America                           125          132                 (6)       20         9            (2)             in North America
                                                                                                                           and EMEA
                                                                                                   EMEA                  − Headwind from
                                                             3,406                                  10%
                         NORTH AMERICA                                                                                     calcimimetics
                                                              €m                         ASIA-PACIFIC
                         79%                                 +0%                                    7%                   − FX translation
                                                             (Organic)

                                                                                     LATIN AMERICA
                                                                                                    4%                 cc = at constant currency

                North America: same market treatment growth relates to growth in the U.S.

                                                                                                              Company Presentation   March, 2020   Page 34
Q4 2020 PRODUCTS | STRONG UNDERLYING ORGANIC GROWTH

                                                                                             Organic
                                  Q4 2020          Q4 2019          Growth      Growth
                                       € million     € million         in %       in %cc
                                                                                             growth
Revenue                                                                                         in %

Health Care Products                      994            973             2            9           8

Dialysis Products                         968            953             2            8           7
                                                                                                              Drivers
 North America                            279             281          (1)            7           6
                                                                                                              + Products for acute
                                                                                                                care treatments
 EMEA                                     353             337            5          11            8
                                                                                                              + In-center
 Asia-Pacific                             282             269            5            8           8             disposables
 Latin America                              52                 61     (15)            8           8           + PD products
Non-Dialysis Products                      26                  20      28           30           30           + Home HD products
                                                                                                              − Lower sales of
                        EMEA                                           NORTH AMERICA                            machines for chronic
                        38%                                                            28%
                                                   994                                                          treatment
                                                    €m
                                                    +8%
                                                                                                              − FX translation
                       LATIN AMERICA               (Organic)                 ASIA-PACIFIC
                       5%                                                              29%
                                                                                                            cc = at constant currency

                                                                                                   Company Presentation   March, 2020   Page 35
Q4 2020 | IMPAIRMENT WEIGHING ON PROFITABILITY

     Operating income in €m and margins in %

                             20.6%
                                                                  Q4 margin drivers
                                             n/a
                18.7%                                             + Negative prior year earnings effect
                               107
  17.9%                                     -186          10.5%   + Continued benefit from lower G&A spend
                 134
                                                                  ‒ Impairment loss Latin America
                                  %
                                                                  ‒ COVID-19 related excess mortality and
                                                           588      additional costs negatively impacted in
   533
                                                                    particular North America and EMEA
                                                                  ‒ Lower reimbursement for calcimimetics
   North        EMEA       Asia Pacific    Latin          Group
  America                                 America

            Operating income in €m, excluding Corporate

                                                                                    Company Presentation   March, 2020   Page 36
Q4 2020 | DECREASING NET LEVERAGE

                                                                                                             Q4 2020                                 Q4 2019
                                                                                                                € million                                 € million

Operating cash flow                                                                                                584                                       771

 in % of revenue                                                                                                  13.3                                      16.8

 Capital expenditures, net                                                                                       (306)                                     (337)

Free cash flow                                                                                                     283                                       434

Free cash flow after investing activities                                                                          130                                       230

NET LEVERAGE RATIO (NET DEBT/EBITDA)1

                                                                Current ratings5                      S&P                   Moody’s                         Fitch
                                            3.22      2.94
 2.6        2.3       2.1                                       Rating                                BBB                      Baa3                         BBB-
                                 1.8
                                            2.53      2.7       Outlook                             stable                    stable                      stable

2015       2016      2017       2018        2019     2020

                1 See Chart 48 for a reconciliation of EBITDA │2 Incl. IFRS 16│3 Excl. IFRS 16 | 4 Excl. U.S. federal relief funding and advanced
                payments under the CARES Act | 5 Latest update: S&P: May 23, 2019; Moody’s: May 20, 2020; Fitch: April 9, 2020

                                                                                                                     Company Presentation   March, 2020     Page 37
2021 TARGETS

                                          Assumptions:
REVENUE              NET INCOME           •   Excess mortality to continue to
(constant currency   (constant currency       accumulate in the first half of 2021
growth in %)         decline in %)        •   COVID-19-related additional costs in the
                                              Dialysis Services business to remain on

       +                     -            •
                                              high level
                                              Besides the extended suspension of the
                                              Medicare sequestration through March
Low to mid-          High-teens to            2021 no further public relief funding
single digits        mid-twenties             assumed

                                          Excluding special items:
                                          Special items include costs related to FME25
                                          and effects that are unusual in nature and
                                          have not been foreseeable or not
2020: EUR 17,859m    2020: EUR 1,359m     foreseeable in size or impact at the time of
                                          giving guidance.

                                                           Company Presentation   March, 2020   Page 38
HEAD- AND TAILWINDS TO OUR TARGETS 2021

                                     Revenue: Low to mid single-digit growth

          17,859

       2020 revenue      Business growth   Value-Based Care        Medicare        COVID-19 effect     Calcimimetics          2021
                                                                  Advantage                                               revenue at cc

                                     Net Income: High-teens to mid-twenties decline

        1,359

       2020 net       Business     Value-       Medicare       Home &         COVID-      Cost inflation Calcimimetics Transaction     2021 net
     income excl.      growth    Based Care    Advantage      COP savings     19 effect                                   losses     income at cc
     special items

        Charts are indicative to illustrate the most important drivers for 2021.

                                                                                                                       Company Presentation   March, 2020   Page 39
TRANSFORMATION OF THE OPERATING MODEL | FME25

>   To support our 2025 strategy, further strengthen profitability and compensate for the
    COVID-19 effects, FME25 to be launched in 2021

>   Invest up to €500m by 2025 to sustainably reduce the cost base and minimally improve
    operating income by the same amount

                                 FME25 addresses the simplification of the Fresenius
                                 Medical Care operating model and shall include

    FME25                             >

                                      >
                                           Simplifying and streamlining the global
                                           operating model
                                           Apply learnings from the “new normal”
                                      >    Accelerating our digitalization agenda

                                                                       Company Presentation   March, 2020   Page 40
MID-TERM TARGETS 2020-2025

                                                Assumptions:
                                                It is assumed that FME25 compensates
REVENUE                 NET INCOME              for the anticipated COVID-19 related
(CAGR, constant         (CAGR, constant         effects
currency growth in %)   currency growth in %)

                                                Excluding special items:
Mid-single digit        High-single digit       Special items include costs related to
                                                FME25 and effects that are unusual in
                                                nature and have not been foreseeable or
                                                not foreseeable in size or impact at the
                                                time of giving guidance.

                                                                Company Presentation   March, 2020   Page 41
Your Questions
Are Welcome!
Q4 2020 | PROFIT AND LOSS

                                                        Q4 2020      Q4 2019           Growth                      Growth
                                                         € million    € million              in %                      in %cc

Revenue                                                   4,400        4,580                 (4)                           4

Operating income                                            462          616               (25)                        (18)

   Operating income margin in %                             10.5         13.5

Operating income excl. special items / adjusted             657          663                 (1)                           5

   Operating income margin excl. special items / adj.       14.9         14.5

Net interest expense                                          84          102               (18)                        (12)

Income before taxes                                          378          514               (27)                        (19)

Income tax expense                                           139          109                  27                         39

   Tax rate in %                                            36.7         21.3

Non-controlling interest                                      62           62                 (1)                          8

Net income                                                  177          343               (48)                        (43)

   Excl. special items / adjusted                            372          368                   1                          6

                                                                                                    cc = at constant currency

                                                                                  Company Presentation   March, 2020    Page 43
FY 2020 | PROFIT AND LOSS

                                                        FY 2020      FY 2019           Growth                      Growth
                                                         € million    € million              in %                      in %cc

Revenue                                                  17,859       17,477                    2                          5

Operating income                                          2,304        2,270                    2                          4

   Operating income margin in %                             12.9         13.0

Operating income excl. special items / adjusted           2,499        2,356                    6                          8

   Operating income margin excl. special items / adj.       14.0         13.5

Net interest expense                                         368          429               (14)                        (12)

Income before taxes                                       1,936        1,841                    5                          7

Income tax expense                                           501          402                  25                         28

   Tax rate in %                                            25.9         21.8

Non-controlling interest                                     271          239                  14                         16

Net income                                                1,164        1,200                 (3)                         (1)

   Excl. special items / adjusted                         1,359        1,236                   10                         12

                                                                                                    cc = at constant currency

                                                                                  Company Presentation   March, 2020    Page 44
FY 2020 | SERVICES

                                   FY 2020       FY 2019         Growth         Growth    Organic    Same market
                                                                                          growth          growth
                                     € million     € million           in %      in %cc       in %           in %

Total                               14,114        13,872                   2        5           3              2

North America                        11,364       11,157                   2         4          2              1

  of which Care Coordination          1,307         1,184                  10      13          17

EMEA                                  1,365         1,354                  1         4          3              1

Asia-Pacific                            876           862                  2         2          3              8

  of which Care Coordination            249           241                   3        5        (2)

Latin America                           485           499              (3)         23         15               2

                                                                                                     EMEA
                                                                                                      10%
                         NORTH AMERICA                          €m
                         81%                                14,114                        ASIA-PACIFIC
                                                                +3%                                   6%
                                                               (Organic)

                                                                                      LATIN AMERICA
                                                                                                      3%
North America: same market treatment growth relates to growth in the U.S.

                                                                                                                Company Presentation   March, 2020   Page 45
FY 2020 | PRODUCTS

                                FY 2020      FY 2019           Growth      Growth       Organic
                                                                                        growth
                                 € million     € million          in %       in %cc        in %

Total Health Care Products           3,745      3,605               4            7           5

Dialysis Products                    3,644      3,529               3            7           4

 North America                       1,113       1,038              7            9           4

 EMEA                                1,303       1,263              3            6           4

 Asia-Pacific                        1,013           997            2            4           4

 Latin America                         199           210          (5)          17           16

Non-Dialysis Products                 101                 76      34           34           34

                        EMEA                                      NORTH AMERICA
                        38%                                                       30%
                                             3.745
                                               €m
                                              +5%
                     LATIN AMERICA            (Organic)                 ASIA-PACIFIC
                     5%                                                           27%

                                                                                              Company Presentation   March, 2020   Page 46
DEBT
RECONCILIATION OF NON-IFRS FINANCIAL MEASURES TO THE MOST DIRECTLY COMPARABLE IFRS FINANCIAL MEASURES

                                                                   FY 2020      FY 2019                         FY 2018
                                                                    € million    € million                           € million

Debt
Short term debt from unrelated parties                                   63        1,150                              1,205
+ Short term debt from related parties                                   17            22                                189
+ Current portion of long-term debt                                  1,008         1,447                              1,107
+ Current portion of long-term lease liabilities                        588          622
+ Current portion of long-term lease liabilities from related
                                                                         21            17
  parties
+ Long-term debt, less current portion                               6,800         6,458                              5,045
+ Long-term lease liabilities, less current portion                  3,764         3,960
+ Long-term lease liabilities from related parties, less current
                                                                        119          106
  portion
Total debt and lease liabilities                                    12,380       13,782                              7,546
− Cash and cash equivalents                                         (1,082)      (1,008)                             (2,146)
Total net debt and lease liabilities                                11,298       12,774                              5,400

                                                                                Company Presentation   March, 2020      Page 47
EBITDA
RECONCILIATION OF ANNUALIZED ADJUSTED EBITDA AND NET LEVERAGE RATIO TO THE MOST DIRECTLY COMPARABLE
IFRS FINANCIAL MEASURES

                                                                                      FY 2020                    FY 2019                          FY 2018
                                                                                        € million                  € million                           € million

Net income                                                                               1,435                       1,439                              2,226
+ Income tax expense                                                                        501                        402                                 511
− Interest income                                                                          (42)                        (62)                              (147)
+ Interest expense                                                                          410                        491                                 448
+ Depreciation and amortization                                                          1,587                       1,553                                 725
+ Adjustments                                                                               249                        110                              (722)
Adjusted EBITDA (annualized)                                                             4,140                      3,933                              3,041
Net leverage ratio (Net debt/EBITDA)                                                        2.7                        3.2                                 1.8

             Adjustments: Acquisitions and divestitures made for the last twelve months with a purchase price above a €50 M threshold as defined in
             the Amended 2012 Credit Agreement (2019: -€71 M), NxStage related transaction costs (2019: €95 M), non-cash charges, primarily
             related to pension expense (2020: €50 M; 2019: €46 M) and impairment loss (2020: €199 M; 2019: €40 M).

                                                                                                                  Company Presentation   March, 2020      Page 48
2020 BASE FOR TARGETS 2021, RECONCILIATION ADJUSTMENTS

                                                                      FY 2020      Q1 2020      Q2 2020               Q3 2020                Q4 2020
                                                                       € million    € million    € million               € million                 € million

Revenue                                                                17,859        4,488        4,557                   4,414                    4,400

Net income excl. special items                                          1,359          283          351                      354                      372

RECONCILIATION OF NON-IFRS FINANCIAL MEASURES TO THE MOST DIRECTLY COMPARABLE IFRS FINANCIAL
MEASURES
                                                                                                  Q4 2020                                    Q4 2019
                                                                                                     € million                                     € million
Revenue                                                                                               4,400                                        4,580

Net income                                                                                               177                                          343
NxStage costs                                                                                                                                             1
Cost optimization costs                                                                                                                                 44
(Gain) loss related to divestitures of Care Coordination activities                                                                                   (20)
Net income adjusted                                                                                                                                   368

Special item: Impairment in the Latin America segment                                                    195
Net income excl. special items                                                                           372

                                                                                                             Company Presentation    March, 2020      Page 49
RETURN ON INVESTED CAPITAL (ROIC)

                                                                                                                      ▪ Long-term value
                                            12.4% rep.                                                                  creation based on
                                                                                                                        accretive
                                                                                                                        acquisitions and
                                                                                                                        organic growth
                           8.6%                                                                                       ▪ 2018 positive impact
        7.8%                                8.0% adj.                  8.0% adj.                                        from Sound
7.1%                                                                                                                    divestiture
                                                                         6.6% excl. special item
                                                                 6.1% rep.                                            ▪ 2019 negative
                                                                                            5.8% rep.                   impact from
2015     2016                2017                2018                2019                2020                           NxStage acquisition
                                                                                                                      ▪ 2019 negative
                                                                                                                        impact from Latin
                                                                                                                        America impairment
       • For the years 2015-17 ROIC as reported within the Form-20-F.
       • ROIC adjusted in 2018 for the divestiture of Care Coordination activities, FCPA related charge, U.S. Ballot Initiatives, U.S. tax reform /
         including these effects, ROIC for FY 2018 was 12.4%
       • ROIC adjusted in 2019 for the effects of IFRS 16, NxStage, FCPA, Cost optimization costs, divestiture of Care Coordination activities /
         including these effects, ROIC for FY 2019 was 6.8% (excl. IFRS 16)
       • ROIC in 2020 excl. the impact of the Latin America impairment (special item)
       • ROIC for 2020 was 7.5% excl. IFRS 16 and excl. Latin America impairment

                                                                                                             Company Presentation   March, 2020   Page 50
EXCHANGE RATES, U.S. DIALYSIS DAYS PER QUARTER, DEFINITIONS

EXCHANGE RATES                                      U.S. DIALYSIS DAYS PER QUARTER

Euro vs.                  2020     2019     2018                    Q1             Q2           Q3               Q4      Full year
€:$        Period end     1.227    1.123    1.145   2021            77             78            79              79            313

           Average        1.142    1.119    1.181   2020            77             78            79              79            313
                                                    2019            76             78            79              80            313

€:CNY      Period end     8.023    7.821    7.875   2018            77             78            78              80            313
                                                    2017            77             78            79              79            313
           Average        7.875    7.735    7.808
                                                    2016            78             78            79              79            314
                                                    2015            76             78            79              79            312
€:RUB      Period end    91.467   69.956   79.715
           Average       82.725   72.455   74.026

                                                    DEFINITIONS
€:ARS      Period end   102.900   67.212   43.039
           Average       81.042   53.948   32.984
                                                    cc            Constant currency
                                                    HD            Hemodialysis
€:BRL      Period end     6.374    4.516    4.444   PD            Peritoneal dialysis
           Average        5.894    4.413    4.308   Net income    Net income attributable to shareholders of FME

                                                                                          Company Presentation   March, 2020   Page 51
FY 2020 | PATIENTS, TREATMENTS, CLINICS

                Patients         Treatments       Clinics          Patients         Treatments                 Clinics
                as of Dec. 30,   as of Dec. 30,   as of Dec. 30,   as of Dec. 30,   as of Dec. 30,             as of Dec. 30,
                2020             2020             2020             2019             2019                       2019

North America   210,260          32,843,592       2,639            211,064          32,138,448                 2,579

Growth in %     0                2                2                3                4                          2

EMEA            66,008           10,189,373       804              66,217           10.042,109                 781

Growth in %     0                1                3                2                3                          1

Asia-Pacific    33,106           4,660,875        400              33,005           4,579,220                  400

Growth in %     0                2                0                5                5                          2

Latin America   37,179           5,881,415        249              34,810           5,388,330                  234

Growth in %     7                9                6                6                6                          2

Total           346,553          53,575,255       4,092            345,096          52,148,107                 3,994

Growth in %     0                3                2                4                4                          2

                                                                                        Company Presentation   March, 2020   Page 52
FINANCIAL CALENDAR 2020

REPORTING DATES & AGM
May 6              Q1 2021 Earnings Release and Conference Call
May 20             Annual General Meeting 2021 (Virtual)
July 30            Q2 2021 Earnings Release and Conference Call
November 2         Q3 2021 Earnings Release and Conference Call

CONFERENCES & MEET THE MANAGMENT
March 2                   Virtual European MedTech & Services Conference
March 2                   Credit Suisse London Healthcare Conference
March 10 & 11             Global Healthcare Conference 2021 (Miami)
March 15                  Barclays C-Suite Call Series with CEO Rice Powell
March 29                  Expert Call Mapping a Digital Future for Kidney Care with Frank Maddux, MD

           Please note that dates and/or participation might be subject to change

                                                                                    Company Presentation   March, 2020   Page 53
CONTACTS

FME INVESTOR
RELATIONS
Else-Kröner-Str. 1
61352 Bad Homburg v.d.H.   DR. DOMINIK HEGER             ROBERT ADOLPH                   PHILIPP GEBHARDT
Germany
                           Head of Investor Relations,   Vice President                  Director
                           Strategic Development &       Investor Relations              Investor Relations
                           Communications | EVP
TICKER:
FME or FMS (NYSE)          +49(0) 6172-609-2601          +49(0) 6172-609-2477            +49(0) 6172-609-95011
                           dominik.heger@fmc-ag.com      robert.adolph@fmc-ag.com        philipp.gebhardt@fmc-ag.com
WKN:
578 580
ISIN:
DE00057858002

                                                                                                           March,
                                                                                    Company Presentation            Page 54
                                                                                                            2020
You can also read