Company Presentation - May 2017 - Minor International

Page created by Peggy Castro
 
CONTINUE READING
Company Presentation - May 2017 - Minor International
Company Presentation – May 2017
Company Presentation - May 2017 - Minor International
FORWARD LOOKING STATEMENT

Statements included or incorporated in these materials that use the words "believe", "anticipate", "estimate", "target", or "hope", or that
otherwise relate to objectives, strategies, plans, intentions, beliefs or expectations or that have been constructed as statements as to future
performance or events, are "forward-looking statements" within the meaning are not guarantees of future performance and involve risks and
uncertainties that could cause actual results to differ materially from historical results or those anticipated at the time the forward-looking
statements are made. MINT undertakes no obligation to publicly update or revise any forward-looking statement, whether as a result of new
information, future events or otherwise. MINT makes no representation whatsoever about the opinion or statements of any analyst or other
third party. MINT does not monitor or control the content of third party opinions or statements and does not endorse or accept any
responsibility for the content or the use of any such opinion or statement.

                                                                  Disclaimer                                                                      2
Company Presentation - May 2017 - Minor International
Agenda
 1Q17 Performance Recap & Recent Updates
 Key Drivers of 2017
 Minor Hotels
 Minor Food
 Minor Lifestyle
 Corporate Information
Company Presentation - May 2017 - Minor International
1Q17 Performance Recap &
           Recent Updates

               AVANI Avenida Liberdade Lisbon
Company Presentation - May 2017 - Minor International
RESILIENT PERFORMANCE WITH QUICK TURNAROUND
1Q17 net profit increased by 17% from 1Q16 core net profit, from the strong performance of both Minor Hotels and Minor
Food. The quick turnaround from the national mourning period signified MINT’s strengths, including robust multi-brand
portfolios, geographical diversification and business agility.
                                                                            REVENUE
   THB million

     18,000                                                                                                                      Excl special gain
                                                                                                                                    +11% y-y

     16,000        15,816                                                                                                            15,379

     14,000
                   13,884

     12,000

     10,000
                   1Q16                        Minor Hotels                     Minor Food                    Minor Lifestyle         1Q17

                                                                           NET PROFIT
     THB million

      4,000
                    3,575
                                                                                                                                 Excl special gain
      3,000                                                                                                                         +17% y-y

                                                                                                                                       1,924
      2,000
                    1,643
      1,000

          0
                   1Q16                         Minor Hotels                     Minor Food                    Minor Lifestyle         1Q17

                            Non-recurring item: gain from bargain purchase of the Tivoli Hotels & Resorts of THB 1,932 million

                                                                    1Q17 Performance Recap                                                           5
Company Presentation - May 2017 - Minor International
INTERNATIONAL PRESENCE
With solid diversification strategy, MINT’s presence was in 32 countries at the end of 1Q17 across its hospitality and restaurant
businesses.
                REVENUE CONTRIBUTION
100%                                                                                                                  Minor Hotels
            13%
 75%                   50%       44%    52%     International                                                         Minor Food

 50%                                            Thailand
            87%                                                                                                       Combination
 25%                   50%       56%    48%

  0%
           2008        2016      1Q17   2021F
* Excludes non-recurring gains

                                                                MINT’s Footprint                                                     6
Company Presentation - May 2017 - Minor International
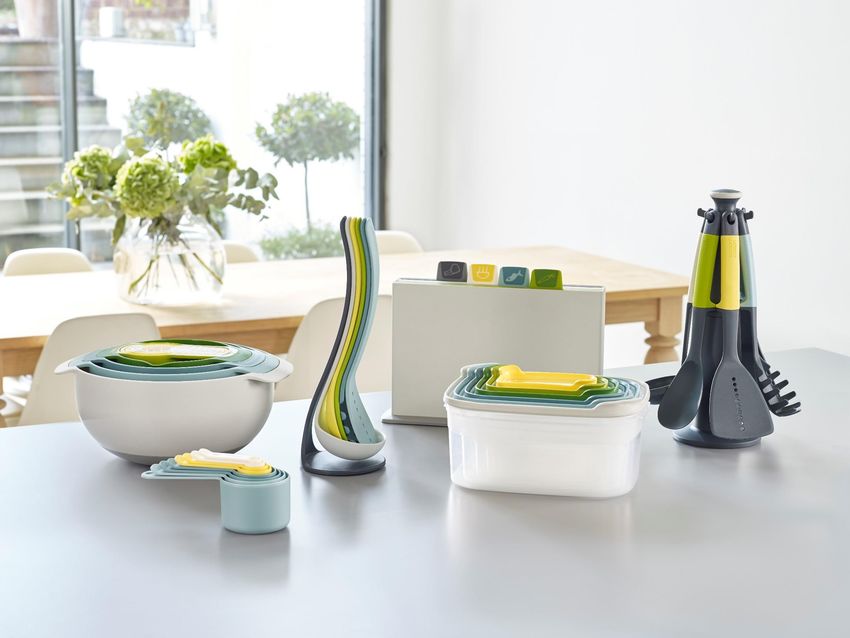
WHAT’S NEW IN 1Q17 TO DATE
                         MINOR HOTELS                                                          MINOR FOOD
Hotel Investment                                                         Launch of Franchise in China
               • Opened Oaks Bodhgaya, a 25% joint-venture                 • Launched the first Thai Express franchise outlet at the
                 property in Bihar, India in January 2017                    Beijing Capital International Airport

               • Brought Anantara and AVANI to Europe for the
                 first time with the rebranding of two Tivoli
                 hotels in April 2017:
                   - Anantara Vilamoura Algarve, Portugal
                   - AVANI Avenida Liberdade Lisbon, Portugal

Oaks
               • Assumed MLR contract of Metro Suites in
                 Auckland, New Zealand in May 2017                                           MINOR LIFESTYLE

                                                                         New Brand Launch
                                                                           • Launched Joseph Joseph, design-led houseware products
                                                                             from England, in March 2017

Anantara Vacation Club

               • Added five units in Phuket to the inventory pool
                 of Anantara Vacation Club

                                                            Recent Development                                                         7
Company Presentation - May 2017 - Minor International
LATEST INVESTMENTS TO REAFFIRM MINT’S LEADERSHIP POSITION IN PHUKET
MINT unveils three new mixed-use projects with total economic value of over THB 9 billion to drive sustainable growth of its
mixed-use business.
                                                                                          ANANTARA VACATION CLUB
        AVADINA HILLS BY ANANTARA
                                                                                             MAI KHAO PHASE III

                                                      Mai Khao Beach

                                                                                    Project Details:
                                                                                    • 97 newly-designed luxury apartments and
                                                                                      pool villas and facilities on 20 rais of land
                                                      Layan Beach                   • Estimated real estate value of THB 3 billion
 50% joint-venture with Kajima Corporation, the                                     Expected Launch Date: 2018
 project is situated adjacent to Anantara Layan
 Phuket
                                                         Phuket                          TURTLE VILLAGE MAI KHAO II
 Project Details:
 • 16 luxury villas on 99 rais of land with total                                   Project Details:
   sales value of THB 6 billion                                                     • 3-storey mixed-use
                                                                                      building with
 • 6-8 bedroom pool villas with approximate size
                                                                                      approximately 1,270
   ranging from 2,158-3,251 sq.m.
                                                                                      sq.m. of retail space
                                                                                      & 534 sq.m. of office
                                                                                      space
  Expected Launch                                                                   • Strategic location in northern Phuket,
  Date: 2018                                                                          surrounded by leading hotels and
                                                                                      vacation clubs
                                                                                    Expected Launch Date: 2019

                                                      Recent Development                                                              8
Company Presentation - May 2017 - Minor International
Key Drivers of 2017 and Beyond
Company Presentation - May 2017 - Minor International
KEY DRIVERS OF 2017 AND BEYOND – MINOR HOTELS
  PORTUGAL - STRONG GROWTH TO                                                                                                            THAILAND - BACK IN FULL SWING
            CONTINUE
                                                                                                                                     h Demand:
h Demand:                                                                                                                               • TAT forecast of international tourist
   • Shift of European tourists to                                                                                                        arrivals growth of 9% in 2017
     geopolitical stable regions                                                                                                     h ADR & RevPar:
   • Affordability of the country with                                                                                                  • Hotel renovations: Anantara Siam
     weakening of Euro against USD                                                                                                        Bangkok (Phase 2), AVANI Pattaya,
h ADR & RevPar:                                                                                                                           Anantara Mai Khao Phuket Villas
   • Hotel renovations                                                                                                                    and Four Seasons Tented Camp

   • Hotels rebranding: Anantara                                                                                                    AUSTRALIA – MORE PROMISING GROWTH
     Vilamoura Algarve and AVANI                                                                                                                 OUTLOOK
     Avenida Liberdade Lisbon
                                                                                                                                    h Demand:
                                                                                                                                       • International tourists driven by
AFRICA - POSITIVE GROWTH PROSPECTS                                                                                                       Asian markets – Chinese and India
     FUELED BY ROBUST DEMAND
                                                                                                                                        • Domestic market driven by
h Demand:                                                                                                                                 previously weakened AUD
   • Improving economy,                                                                                                             h ADR & RevPar:
     infrastructure and flight                MALDIVES - PROMOTING RESILIENCY                                                          • Hotel renovations, such as Oaks
     connectivity                                                                          HOTEL MANAGEMENT CONTRACT
                                                 THROUGH DIVERSIFICATION                                                                 Cypress Lakes
   • Victoria Falls as a main attraction
                                             h Occupancy:                               h Number of hotels:                         h profitability:
h ADR & RevPar:                                 • Targeted and dynamic marketing                                                       • Ramping up of new properties – The
                                                                                           • Over 20 management contracts
   • Renovation of AVANI Gaborone in              tactics                                    signed and to be opened over next           Milton Brisbane and Oaks
     Botswana                                   • Diversification to new markets,            three years                                 Southbank
h Profitability:                                  such as Middle East                       • Over 100 hotels under                 h Room count:
   • Leverage of MINT’s global               h Quality of products and services:              management by 2021                       • Expansion of Oaks brand both in
     platform and operational                   • Earn global recognitions                  • Potential rebranding opportunities         home market and outside e.g. India
     excellence                                                                                                                          and Middle East
                                     • Strong pick-up of residential sales: The Residences by Anantara, Layan, Phuket (3 sold in 1Q17); Anantara Chiang Mai Serviced Suites (3
                                       sold in 1Q17); Torres Rani (1 penthouse sold in 1Q17); more units of these projects are to be sold while additional new pipeline include
    REAL ESTATE BUSINESS               Desaru, Ubud and Avadina Hills.
                                     • Turnaround of AVC through enhanced product offerings, accelerated cash flow, strengthened risk management procedures and
                                       targeted sales and marketing strategy; new inventory is to be added to provide more points to sell.
                                                                                2017 and Beyond                                                                               10
KEY DRIVERS OF 2017 AND BEYOND – MINOR FOOD

               Thailand
                                                                                                                                                    Australia
                                                              China                                    Singapore

                                                                                                                                    STABLE OPERATIONS WITH FURTHER
 MAINTAINING LEADERSHIP POSITION                    PROFITABLE EXPANSION                     PORTFOLIO RATIONALIZATION
                                                                                                                                               GROWTH
+ Macro environment:                        + Revenue potential:                        + New management:                          + Revenue potential:
  • Recovery of domestic consumption,         • Product improvement to capture            • Rebuilding a strong foundation for       • Strengthening of franchise
    with increased infrastructure               rising middle-class consumption and         sustainable growth in the long-term        capabilities through leverage of
    spending, higher farm income and            urbanization                                                                           MINT’s operational excellence and
                                                                                        + Revenue potential:
    lower household debt after expiry of                                                                                               global platform
                                              • Expansion of delivery channel
    the first-car scheme                                                                  • Strengthening of Thai food portfolio
                                                                                            to prepare for economic turnaround
+ Minor Food’s strengths:
  • Strong brand portfolio with
    significant market share in most
    categories
                                              • Continued development of Thai             • Adopting effective segmentation          • Franchise opportunities of The
  • Product & service innovations               Express, with first franchised outlet       strategy                                   Coffee Club brand both in Australia
                                                in Beijing Capital International                                                       and overseas e.g. Middle East,
                                                                                          • Expansion of Thai Express’s
                                                Airport in Jan17, and one more in                                                      Thailand etc.
                                                                                            franchise outside of Singapore such
                                                May17
                                                                                            as Vietnam and Malaysia                + Efficiency & profitability
                                              • Potential stake increase in Riverside
                                                                                                                                     • Expansion of the higher margin
                                                based on the original agreement
                                                                                                                                       coffee roasting business
                                                with the Founders
  • Leading digital strategy and delivery
    platform to enhance customer            + Efficiency & profitability
    experience; e.g. TPC’s
                                              • Improvement of operational
    online delivery order
                                                excellence, supply chain
    contribution jumped                                                                 + Efficiency & profitability
                                                management and network planning
    from +10% to almost
                                                                                          • Ongoing portfolio rationalization
    40% of total delivery
    dockets in one year

                                                                              2017 and Beyond                                                                                11
Minor Hotels

               Anantara Vilamoura Algarve, Portugal
FINANCIAL PERFORMANCE – MINOR HOTELS
 1Q17 revenues of hotel & mixed-use business grew by 19%, as a result of increase in revenues of owned hotels, Oaks,
 management contracts and real estate business. 1Q17 EBITDA increased by 19%, while net profit increased by 21%, primarily
 attributable to the strong performance of Oaks and the real estate business.

                                                                                                                                KEY HIGHLIGHTS
  THB million
                                                                                +19% y-y
                                                                                                      Owned hotels            • Revenue grew by 7%, as a result of
                                                                                  8,388                                         improved overall operations, together
                           7,078
                                        6,099
                                                       7,237         7,344                            49%                       with the incremental revenue from new
                                                                                                      of 1Q17 hospitality       hotels.
    Revenue                                                                                           revenue

                                                                                                      Oaks                    • Revenue increased by 11%, primarily from
                                                                                                                                the RevPar growth of 7% (in THB term).
                                                                                 +19% y-y             19%
                                                                                   2,594
                                                                                                      of 1Q17 hospitality
                           2,175                                     2,132                            revenue
     EBITDA                                            1,723
                                         1,117
                                                                                                      Management contracts • Revenue increased by 21%, primarily
    EBITDA                                                                                                                   attributable to good performance of
    Margin                 30.7%        18.3%         23.8%          29.0%         30.9%              4%                     existing hotels, together with additional
                                                                                                      of 1Q17 hospitality
                                                                                                                             management fees from newly managed
                                                                                 +21% y-y             revenue
                                                                                                                             hotels.
                                                                                    1,361
                          1,124
      NPAT                                                            889
                                                        561                                           Real estate             • Revenue increased by over 60% from
                                          237
                                                                                                                                strong performance of both residential
    Net
                          15.9%          3.9%          7.8%          12.1%         16.2%
                                                                                                      25%                       sales and Anantara Vacation Club after
    Margin                                                                                            of 1Q17 hospitality       the adjustment of its business model.
                                                                                                      revenue
                          1Q16           2Q16          3Q16          4Q16          1Q17

* The financials above reflect performance from operation, and therefore exclude non-recurring items as detailed on page 40

                                                                                             Minor Hotels                                                                  13
MINOR HOTELS - INTERNATIONAL PRESENCE
In recent years, MINT has implemented a solid diversification strategy. At the end of 1Q17, MINT operates hotels and spas under
a combination of investment, joint-venture and management business models in 25 countries, with another 4 countries in the
pipeline over the next three years.
                  REVENUE CONTRIBUTION
100%         6%
 75%                   63%       54%            International
                                        68%
 50%                                            Thailand
            94%
 25%
                       37%       46%    32%
  0%
           2008        2016      1Q17   2021F
* Excludes non-recurring gains

       Investment

       Management

       Combination

       New Destinations in Pipeline

       Hubs

                                                                Minor Hotels                                                 14
SYSTEM-WIDE HOTEL OPERATIONS
Excluding new hotels and impact from exchange rate, organic RevPar of the entire portfolio increased by 3% in 1Q17, driven by
higher occupancy. However, 1Q17 system-wide RevPar decreased by 2%, primarily from newly-added overseas hotels which were
either recently acquired or are still in the ramping-up stage.

                       NUMBER OF HOTEL ROOMS                                                              ADR
No of Rooms                                        +4% y-y                       THB
                                                                                                                     Organic excl FX System-wide
              19,006   19,115   19,512   19,776    19,794
 20,000                                                                          8,000                                  -1% y-y         -1% y-y

 15,000                                                                                  6,431                               6,397 6,338
                                                                                                                  5,963
                                                                MLR / Oaks       6,000                   5,410
                                                                                                 5,198
 10,000                                                         Managed
                                                                Joint-venture    4,000
  5,000
                                                                Owned

        0                                                                        2,000
              1Q16     2Q16      3Q16    4Q16      1Q17                                  1Q16     2Q16   3Q16     4Q16           1Q17

                                OCCUPANCY                                                                REVPAR
  90%                                                                            THB
                                                                                                                     Organic excl FX System-wide
                                                                                                                        +3% y-y         -2% y-y
  80%                                                                           5,000
                                   70%                                                   4,337                                4,450 4,270
                                                          70%     Organic                                         3,858
  70%          67%                                                +3% y-y       4,000                    3,793
                         64%                 65%
                                                                                                 3,327
                                                                System-wide     3,000
                                                        67%        Flat y-y
  60%
                                                                                2,000
  50%                                                                           1,000
              1Q16     2Q16       3Q16      4Q16       1Q17                               1Q16    2Q16   3Q16     4Q16           1Q17

                                                                        Minor Hotels                                                          15
OWNED-HOTELS OPERATIONS
  1Q17 HOSPITALITY           Owned hotels contribute almost half of hotel & mixed-use revenues in 1Q17. Excluding new hotels and
REVENUE CONTRIBUTION
                             foreign exchange impact, 1Q17 organic RevPar grew by 4%, driven by both overseas and Thai hotels. Including
              49%            new hotels, system-wide RevPar declined by 4%, primarily from the addition of Tivoli portfolio in Feb 2016. In
             Owned-
             hotels          addition, first quarter was the low season for Portugal and some Tivoli properties were under renovation.

                            NUMBER OF HOTEL ROOMS                                                                                              ADR
           +Tivoli Victoria
           +Tivoli Palacio de                                                                                                                                     Organic excl FX System-wide
            Sateais                                                                                    THB
           +Tivoli Jardin                  +Anantara Kalutara                                                                                                        +2% y-y        +1% y-y
           +Tivoli Lagos                   +Royal Livingstone                   +8% y-y
 No of     +Tivoli Sintra                   by Anantara       +Elements                               8,000
Rooms      +Tivoli Coimbra                 +AVANI Victoria     Boutique
           +AVANI Riverside Bkk             Falls              Resort & Spa                                    6,733                                                         6,863 6,791
8,000                                                                                                                                                         6,143
                                                7,084            7,118           7,118                6,000                                   5,572
7,000          6,566              6,566                                                                                        4,926
6,000                                                                                                 4,000
5,000
4,000                                                                                                 2,000
               1Q16               2Q16           3Q16            4Q16            1Q17                           1Q16           2Q16           3Q16            4Q16              1Q17

                                          OCCUPANCY                                                                                          REVPAR

  90%                                                                                                  THB                                                        Organic excl FX System-wide
                                                                                                      6,000                                                          +4% y-y         -4% y-y
  80%                                        73%
                                                                                                                4,063                          4,041                         4,208 3,907
  70%                         64%                                                 Organic             4,000
               60%                                                       61%                                                    3,129                        3,445
                                                           56%                    +1% y-y
  60%
                                                                                System-wide
                                                                         58%                          2,000
  50%                                                                              -2% y-y

  40%                                                                                                      0
              1Q16          2Q16           3Q16          4Q16           1Q17                                    1Q16           2Q16           3Q16            4Q16              1Q17
* Change in 1Q16 stats because of retroactive classification of hotels in Zambia from JV hotels to owned hotels as a result of change in investment status effective 3Q16.

                                                                                          Minor Hotels                                                                                     16
OWNED-HOTELS OPERATIONS – THAILAND vs. OVERSEAS
  1Q17 HOSPITALITY      Thailand hotels continued to be the largest contributor to the hospitality business, with revenue of owned
REVENUE CONTRIBUTION
           Thailand     hotels in Thailand accounting for 30% of hospitality revenue. Following the acquisition of Tivoli hotels
           hotels       portfolio, overseas hotels contributed 19% of hospitality revenue.
           30%
     Overseas
     hotels 19%

                                BANGKOK                                                                                              OVERSEAS
RevPar Growth                                                          Organic            RevPar Growth                                                                           Organic
(y-y)       -3%          -8%           +2%              -3%             +4%               (y-y)      -48%                   -18%             +11%                -35%              +8%
  THB                                                                                     THB
 6,000   5,178                                                                          10,000
                                                     5,103            5,048
                       4,367         4,240                                4,098          8,000                                              72%
               3,923                                                                                                                                                            6,838
 4,000                                   3,173               3,596                                    6,021                63%           5,817              5,643
                           2,717                                        81%              6,000                                                                  48%
             76%                        75%                                                             48%             4,727                    4,217                               46%
                         62%                             70%
                                                                                         4,000            2,903                 2,959                                                 3,148
 2,000                                                                                                                                                             2,711
                                                                                         2,000
    0                                                                                           0
           1Q16          2Q16          3Q16            4Q16             1Q17                             1Q16              2Q16               3Q16              4Q16               1Q17

                         THAILAND PROVINCES                                                                                     KEY HIGHLIGHTS
RevPar Growth                                                          Organic           • Bangkok: organic owned RevPar increase of 4% in 1Q17, driven by
(y-y)      +11%          +4%           +6%              +2%             +1%                occupancy. Including the new AVANI Riverside which is still in the ramping-
 THB                                                                                       up stage, system-wide owned RevPar increased by lesser magnitude of 2%
10,000   9,132                                                        9,257                in 1Q17.
               7,188                                  8,355                7,229
 8,000                 5,956
                                     6,125                                               • Thailand provinces: organic owned RevPar increase of 1% in 1Q17,
            79%                                              5,582       78%
 6,000                                70%                                                  primarily from hotels in the North of Thailand, including Chiang Mai and
                          67%                         67%
                                             4,311                                         Chiang Rai.
 4,000                       4,015
                                                                                         • Overseas: increase in 1Q17 organic owned RevPar of 8% due to the
 2,000                                                                                     turnaround of hotels in Brazil and some of the renovated hotels in Portugal.
     0                                                                                     With the addition of new hotels which commanded lower RevPar than the
            1Q16         2Q16          3Q16            4Q16             1Q17               portfolio’s average, system-wide owned RevPar was down 7% in 1Q17.
                                                                                        * Change in 1Q16 stats because of retroactive classification of hotels in Zambia from JV hotels to owned
                  % Occupancy                 ADR                    RevPar               hotels as a result of change in investment status effective 3Q16.

                                                                                 Minor Hotels                                                                                                      17
OWNED-HOTELS OPERATIONS BY KEY MARKETS
  1Q17 HOSPITALITY               In 1Q17, owned hotels in Thailand and Brazil led the overall RevPar performance of the owned hotel
REVENUE CONTRIBUTION
                                 portfolio and helped offset the softness of the Maldives and Africa, as well as the impact of renovation in
              49%                Portugal.
             Owned-
             hotels

               1Q17 REVENUE CONTRIBUTION
                                                                                              KEY MARKET HIGHLIGHTS
              OF OWNED HOTELS BY GEOGRAPHY
                              Others, 3%                           Thailand    • International tourist arrivals grew moderately by 2% in 1Q17, while
                    Africa, 8%                                                   Minor Hotels outperformed the industry with room nights of hotels in
             Maldives, 9%                                                        Thailand growing at a faster rate of 10%.
                                                                               • Excluding new hotels, organic RevPar of Thailand owned hotels
           Brazil, 11%                                                           recovered from the mourning period with an increase of 1% in 1Q17.
                                                                               • 1Q17 system-wide RevPar of Thailand owned hotels was down by 1%
                                                 Thailand, 62%
              Portugal, 7%                                                       due to the addition of AVANI Riverside.
                                                                   Portugal    • Tivoli hotels in Portugal reported negative RevPar growth in 1Q17
* Excludes non-recurring items
                                                                                 because of the ongoing renovation of three hotels.
                                                                               • The hotels that were renovated since last year – Tivoli Oriente and
            1Q17 ORGANIC REVPAR GROWTH (Y-Y)
                                                                                 Tivoli Marina Vilamoura Algarve – saw double digit RevPar growth in
                                                                                 1Q17.
                                             27%
                                                                   Maldives    • The Maldives portfolio started to see an improving trend of its RevPar,
                                                                                 with a decline of only 5% in 1Q17 compared to -15% in 2016.
                                                                               • RevPar growth of the Maldives portfolio was positive in March and also
                                                                                 going into April of 2017.
        1%                                                                     • RevPar of hotels in Brazil grew by 27% as a result of the completion of
                                                                   Brazil
                                                                                 the hotel renovation, together with improving political and macro-
                                    -5%                                          economic environment.
                      -6%
                                                                   Africa      • Performance of African operations declined due to the slow low
                                                         -14%
                                                                                 season in Zambia. However, the RevPar started to see an improving
     Thailand      Portugal       Maldives   Brazil     Africa                   trend going into April 2017.

                                                                       Minor Hotels                                                                        18
OAKS’ OPERATIONS
   1Q17 HOSPITALITY
REVENUE CONTRIBUTION     Oaks’ serviced-suites operation is the second largest segment in the hotel and mixed-use business, with
                         almost 20% revenue contribution in 1Q17. Oaks continues to provide the hotel & mixed-use business with
                         stable performance throughout the year, compared to hotel operations which is more seasonal. Oaks’ 1Q17
        19%              revenues in THB increased by 11%, primarily from the increase in RevPar.
        Oaks

                       NUMBER OF MANAGED ROOMS                                                        ADR
 No of                                                                     THB                                          THB     AUD
Rooms                                                   +1% y-y                                                       +5% y-y
                                                                          6,000                                                 190
7,000                                                                                                         4,772    4,830
                                                                                     4,592           4,515
                          6,347               6,339     6,328                                4,327
               6,257                  6,360                                                                                     180
                                                                          4,000      179                                181
6,000                                                                                                          180
                                                                                                                       AUD      170
                                                                                                      171             +2% y-y
5,000                                                                     2,000
                                                                                              165                               160

4,000                                                                            0                                              150
               1Q16       2Q16        3Q16    4Q16      1Q17                         1Q16    2Q16     3Q16    4Q16     1Q17

                                  OCCUPANCY                                                          REVPAR
                                                                           THB                                                  AUD
 90%                                                                                                                    THB
                                                        +2% y-y           5,000                                       +7% y-y   160

                                                                                     3,531            3,528   3,749    3,793
                                       78%    79%        79%              4,000
 80%           77%                                                                           3,162
                                                                                                                                140
                           73%                                            3,000                                141     142
                                                                                      137
                                                                                                       134             AUD
                                                                          2,000
 70%                                                                                                                  +4% y-y   120
                                                                          1,000               120

 60%                                                                             0                                              100
               1Q16       2Q16        3Q16    4Q16      1Q17                         1Q16    2Q16     3Q16    4Q16    1Q17

                                                                  Minor Hotels                                                        19
MANAGED-HOTELS OPERATIONS
  1Q17 HOSPITALITY
REVENUE CONTRIBUTION          In 1Q17, managed hotels contributed 4% of hotel & mixed-use revenues. Organic RevPar excluding foreign
                              exchange impact of managed hotels portfolio was up 3%, primarily from increase in occupancy of managed
    4%                        hotels in the Middle East and Seychelles. With RevPar growth and the increase in room counts, 1Q17
       Management
                              revenue from management service increased by 21%.
       Contracts

                           NUMBER OF HOTEL ROOMS                                                                                   ADR

                                                                                                                                             Organic excl FX System-wide
No of     +The              +Loisaba Tented    +AVANI Khon    +Anantara Al Jabal
                                                                                    +12% y-y                                                    -2% y-y         -8% y-y
Rooms      Residences at Camp                   Kaen           Al Akhdar, Oman                          THB
           Victoria, Tivoli +Loisaba Star      +AVANI Deira   +Al Baleed Salalah
                             Beds               Dubai          by Anantara                              8,000     7,605                                7,457
5,000                                                                                                                                      6,886                7,034
                                                                   4,533              4,484                               6,291   6,068
              3,998                                 4,282                                               6,000
                               4,017
4,000
                                                                                                        4,000
3,000
                                                                                                        2,000

2,000                                                                                                         0
              1Q16             2Q16                 3Q16           4Q16               1Q17                         1Q16   2Q16    3Q16     4Q16           1Q17

                                       OCCUPANCY                                                                                  REVPAR

                                                                                                                                              Organic excl FX System-wide
                                                                                                        THB                                      +3% y-y         -6% y-y
 80%                                                                                 Organic
                                                                                     +4% y-y            6,000     5,280                                 5,416
                                                                           73%                                                                                  4,952
             69%                                                                                                                           4,244
 70%                                                                               System-wide                            3,741    3,788
                                                                                                        4,000
                                              62%           62%          70%         +1% y-y
                             59%
 60%                                                                                                    2,000

 50%                                                                                                          0
                                                                                                                   1Q16   2Q16    3Q16     4Q16           1Q17
           1Q16           2Q16            3Q16              4Q16        1Q17

                                                                                               Minor Hotels                                                             20
HOTEL EXPANSION PIPELINE
 Expansion inside and outside Thailand will contribute to revenue & profit in coming years.
                                 HOTEL INVESTMENT                                                      MANAGEMENT CONTRACTS

                                            • Bodhgaya,                   • Guiyang, China                                 • Brasilia, Brazil• Auckland,
2017F                                                                       (218 rms)
                                              India* (78                                                                     (395 rms)         New Zealand
                                              rms)                                                                         • Doha, Qatar       (370 rms)
                                                                                                                             (150 rms)       • Doha, Qatar
                                                                                                                           • Al Wakrah,        (102 rms)
                                                                                                                             Qatar (101 rms)
        • Quy Nhon,                                                       • Shanghai, China (260 rms) • Queensland,
2018F     Vietnam                                                                                       Australia
                                                                          • Qiandao Lake, China
          (25 rms)                                                          (120 rms)                      (219 rms)
                                                                          • Lijiang, China (678 rms)
                                                                          • Tozeur, Tunisia (93 rms)
        • Desaru,                                          • Warangi,     • Zhuhai, China (110 rms)      • Zhuhai, China
2019F     Malaysia                                          Serengeti     • Le Chaland, Mauritius        (300 rms)
          (103 rms)                                         National        (164 rms)                  • Jebel Dhanna,
        • Ubud, Bali,                                       Park,                                        UAE
                                                            Tanzania*     • Al Houara Tangier,
          Indonesia*                                                        Morocco (150 rms)            (228 rms)
          (80 rms)                                          (12 rms)
                                                                          • Oman (198 rms)             • Busan, Korea
                                                                                                         (400 rms)
                                                                          • Zanzibar, Tanzania
                                                                            (150 rms)
                                                                          • Jebel Dhanna, UAE (60 rms)
                                                                          • Dubai Creek, UAE (292 rms)
                                                                          • Ras Al Khaimah, UAE
                                                                            (306 rms)

2020F                      • Khao Lak,                                    • Jeddah, Saudi Arabia          • Dubai, UAE
                              Thailand                                      (328 rms)                      (372 rms)
                              (327 rms)                                                                   • Ras Al
                                                                                                           Khaimah, UAE
                                                                                                           (200 rms)
Total                               6 Hotels / 625 Rooms                                                   25 Hotels / 5,964 Rooms
        * Note: Joint-ventured properties

                                                                        Minor Hotels                                                                   21
REAL ESTATE BUSINESS - RESIDENTIAL
  1Q17 HOSPITALITY
REVENUE CONTRIBUTION
                       In addition to the current projects, three joint-venture projects have been announced, in order to ensure the
                       revenue stream from residential sales in the coming years. The residential projects in the pipeline include
    25%                Avadina Hills in Phuket, Desaru in Malaysia and Ubud in Indonesia. Other residential projects will be
    Real Estates
                       selectively considered in various hotel destinations in order to increase returns of the overall project.

THE RESIDENCES BY ANANTARA, LAYAN, PHUKET                 ANANTARA CHIANG MAI SERVICED SUITES                            THE ESTATES SAMUI
                                                                                                              Above a secluded cove of
                                                                                                              powder-white sands and                Inventory
                                                                                                                                                       21%
                                                                                                              crystal-blue waters, The
                                                                                                              Estates Samui offers 14        Sold
                                                                                                              luxury villas adjacent to      79%
                                                                                                              Four Seasons, Koh Samui.

                                                                                                                       TORRES RANI, MAPUTO
The project is situated on Layan beach, one of the        A 50% joint-venture with U City Pcl., the project
most picturesque bays on west coast of Phuket.            is in the city center of Chiang Mai, across from
                                                          Anantara Chiang Mai Resort & Spa.                                                  2 out of 6
 ● 15 uniquely designed pool      20% sold &                                                   6% sold &                                  penthouse units
   villas                         transferred              ●   44 units in 7-storey    13%    transferred                                   sold to date;
                                    in 1Q17                                         deposited                                             1 unit deposited
 ● Up to 8 bedrooms, each                                      condominium building & contract in 1Q17
                                                                                      signed
   with 21 meter private                                   ● 65 to 162 sq.m. (one                             A 49% joint-venture with Rani Investment, the
   infinity pool                                             to three bedrooms)                               project is 5 minutes from Maputo CBD.
 ● 1,313 to 2,317 sq.m. of                    Inventory    ● 26 units sold to date     Inventory
                                                 38%
                                                             (3 sold in 1Q17); 5          32%                   ● 18-storey residential tower, comprising
   built-up area                       Sold                                                                       181 keys for rent and 6 penthouse units
 ● Construction of the project         42%                   units reserved and                    Sold           for sale
   is completed                                              expected to be                        49%
                                                             transferred in 1Q17                                ● 20,926 sq.m., 21-storey office tower

                                                                        Minor Hotels                                                                         22
REAL ESTATE BUSINESS – ANANTARA VACATION CLUB
   1Q17 HOSPITALITY                Part of the real estate business, Anantara Vacation Club is another important contributor to Minor Hotels.
 REVENUE CONTRIBUTION
                                   Growth of members are driven by four main markets – China, Thailand, Hong Kong and Singapore. With the
                                   change of the sales model since 2015 which resulted in smaller package, accelerated cash flow, as well as
     25%
     Real Estates                  lower bad debt and cancellation rate, AVC is seeing the turnaround of its performance since 4Q16. In 1Q17,
                                   AVC revenues increased by 27% y-y.

                             TOTAL NUMBER OF MEMBERS                                                                MEMBERS PRIMARILY IN ASIA
 Growth (y-y) +67%                  +41%       +28%           +15%        +18%                                      US, 1% Others, 10%
                                                                                                      Philippines, 1%
 No. of                                                                                                    Taiwan, 2%
Members                                                                                                      UAE, 2%
                                                                          8,502
                                                              8,000                                    Australia, 3%                               China, 39%
   8,000                                       6,928
                                                                                                        Japan, 4%
   6,000                            5,431
                                                                                                     Malaysia, 8%
   4,000            3,857

                                                                                                           Singapore,
   2,000
                                                                                                               9%
         0                                                                                                          Hong Kong,             Thailand,
                  2013              2014       2015           2016        1Q17                                         10%                   10%                As at Mar 2017

             INVENTORY TO ACCOMMODATE GROWING MEMBERS                                                        GROWTH DRIVEN BY FOUR MARKETS
No. of Units                                      7 Destinations:                                                China
                                                                      10 Destinations      No. of
                                                   Queenstown                             Members                Hong Kong
   500                                                  Bali                                                                                                       5,870
                                                                           450             6,000                                                       5,553
                                                      Sanya                                                      Thailand
   400                                                Samui                                                      Singapore           4,896
                                                      Phuket
   300                                               Bangkok                                4,000                       3,731                          +17%         +19%
                                                    Chiang Mai                                                                       +48%
   200                                                                                                    2,460         +111%
                                              160       165
                                      137                                                   2,000        +300%                                         +11%         +11%
               106          119                                                                                          +35%        +38%
   100                                                                                                    +39%                                         +7%          +11%
                                                                                                          +23%           +19%            +5%
                                                                                                          +36%           +12%        +10%              +10%         +9%
     0                                                                                           0
               2013         2014      2015    2016     1Q17               2021F                           2013           2014        2015              2016         1Q17

                                                                                  Minor Hotels                                                                               23
Minor Food
FINANCIAL PERFORMANCE – MINOR FOOD
1Q17 revenue of Minor Food increased by 3%, attributable to strong performance of Thailand and China hubs, which helped
offset the slowdown of Singapore hub. EBITDA and net profit grew by 7% and 12% respectively, primarily from the higher
operating leverage of Thailand hub and improved profitability of Veneziano the coffee roasting business in Australia.
                                                                                                                                 KEY HIGHLIGHTS
  THB million
                                                                                   +3% y-y              Total-system-sales    • The Pizza Company, Burger King, Riverside
                                                                                    6,028               growth of               and BreadTalk (Thailand) reported strong
                            5,841                      5,794
                                          5,766                       5,621                                                     double-digit total-system-sales growth in
    Revenue                                                                                             8.2%                    1Q17.
                                                                                                        in 1Q17

                                                                                                        Outlet expansion      • In 1Q17, Burger King, BreadTalk (Thailand),
                                                                                                        of                      The Pizza Company and Riverside achieved
                                                                                   +7% y-y                                      the fastest outlet expansion y-y (in terms
                                                                                                        8%                      of percentage growth).
                           1,051                                                    1,126               in 1Q17
                                                         982           933
                                           876
     EBITDA                                                                                                                   • Positive same-store-sales growth in 1Q17
                                                                                                                                was led by The Pizza Company, Swensen’s,
   EBITDA                                                                                                                       Riverside in China and BreadTalk (Thailand).
                           18.0%         15.2%         17.0%         16.6%          18.7%
   Margin
                                                                                                                              • Thai Express Group in Singapore continued
                                                                                  +12% y-y               Same-store-sales       to be soft amidst challenging macro
                                                                                     540                 growth of              condition and intensifying competition in
                            481                                                                                                 Singapore.
                                                        420            425
      NPAT                                359                                                            1.3%
                                                                                                         in 1Q17              • Despite challenges in Minor Food’s key
                                                                                                                                operating markets, the strength of its multi-
                                                                                                                                brand portfolio, diversification strategy and
   Net
   Margin                  8.2%          6.2%           7.2%          7.6%           9.0%                                       operational excellence enabled Minor Food
                          1Q16           2Q16           3Q16          4Q16          1Q17                                        to maintain resilience and weather through
                                                                                                                                the difficult time.
* The financials above reflect performance from operation, and therefore exclude non-recurring items as detailed on page 40

                                                                                           Minor Food                                                                       25
MINOR FOOD - INTERNATIONAL PRESENCE
MINT operates four restaurant hubs: Thailand, Singapore, Australia and China. MINT’s restaurant presence is now in 19 countries
across the region, operating owned, franchised and a combination of both business models. MINT continues to look for
opportunities to expand, especially in these existing markets.
                 REVENUE CONTRIBUTION
100%
             19%
  75%                   41%       37%   46%
                                                International
  50%
             81%                                Thailand
                        59%       63%   54%
  25%

   0%
            2008       2016      1Q17   2021F
* Excludes nonrecurring gains

                    Owned

                    Franchised

                    Combination

                    Hub

                                                                Minor Food                                                   26
MINOR FOOD – OPERATIONAL PERFORMANCE
1Q17 total-system-sales of Minor Food grew 8.2%, primarily from same-store-sales growth of 1.3% and outlet expansion of 8%,
mostly in Thailand, Vietnam and China. Thailand and China hubs achieved robust operational performance, which helped offset
negative same-store-sales growth of Singapore hub in 1Q17.

                          SSS & TSS GROWTH                                                  RESTAURANT OUTLETS BY GEOGRAPHY

                                                                                 International                                3,409
 20%
                                                                                 Thailand
                                                                                                             +8% y-y          39%

 15%                                                                                                 1,996    2,017

                                     11.3%                                                            36%      36%
                                                                                1,043
                         9.9%
          8.8%                                                                  33%                                           61%
 10%                                                              8.2%                                        64%
                                                                                                      64%
                                                   6.4%                         67%

                                                                                2008                 2016     1Q17            2021F
  5%                                 3.0%
                        2.3%
                                                                1.3%
          0.9%                                                                              RESTAURANT OUTLETS BY OWNERSHIP
                                                  -0.9%
  0%
                                                                                 Franchised                                   3,409
                                                                                 Owned
                                                                                                             +8% y-y
 -5%                                                                                                                           49%
          1Q16          2Q16         3Q16         4Q16          1Q17                                 1,996    2,017
No. of
          1,859        1,883         1,928       1,996          2,017                                         49%
Outlets                                                                         1,043                49%
                                                                                38%                                            51%
                                                                                                                               59%

           Same-Store-Sales Growth           Total-System-Sales Growth                               53%
                                                                                                     51%      50%
                                                                                                              51%
                                                                                82%
                                                                                62%

                                                                                2008                 2016     1Q17            2021F

                                                                   Minor Food                                                         27
THAILAND HUB
  1Q17 RESTAURANT
REVENUE CONTRIBUTION   Revenues from domestic operations remained the biggest contributor to Minor Food, accounting for 63% of
                       total restaurant revenue in 1Q17. Diversification, product innovation and effective marketing strategy
                       afforded Minor Food to stay ahead of competition and achieved positive same-store-sales growth for the
          63%
         Thailand      quarter.

                    THAILAND’S SSS & TSS GROWTH                                           RESILIENT OPERATIONS

 Thailand hub experienced gradual recovery from the mourning
  period and outperformed the industry with same-store-sales
                                                                               Continued to build on innovation of products and services,
                                                                               including new promotional products and user-friendly
     growth of 2.6% in 1Q17. The two brands that performed well                mobile app, to enhance customer traffic.
     during the quarter were The Pizza Company and Swensen’s.
                                                                               Successfully launched new sundaes with improved
 With  consistent outlet expansion, Thailand hub saw total-system-
  sales growth of 10.4% in 1Q17.
                                                                               presentation, focused on the kid’s segment and
                                                                               strengthened delivery channel, with the aim to increase
                                                                               customer traffic.
 20%
                                                                               Continued to emphasize Sizzler as a healthy, high quality
                                                                               choice with the offer of Royal Project and organic
 15%                                                                           ingredients on salad bar and innovative products.

 10%                                                                           Grew the network of outlets with focus on universities and
                                                                               hospitals, and expanded sales channel to delivery services
                                                                               by partnering with independent delivery operators.
  5%
                                                                               Launched innovative, limited-time-offer products such as
  0%                                                                           Thai spiced chicken with sticky rice and chicken cheese
                                                                               pop, which helped increase number of trials and
                                                                               frequency.
  -5%
           1Q16         2Q16        3Q16        4Q16          1Q17
                                                                               Drove expansion, especially in shopping malls and
                                                                               hypermarket locations in both Bangkok and key cities in
          Same-Store-Sales Growth           Total-System-Sales Growth          upcountry.

                                                                  Minor Food                                                                28
CHINA HUB
  1Q17 RESTAURANT
REVENUE CONTRIBUTION       China hub maintained strong growth momentum and reported positive same-store-sales growth for the fifth
       13%                 consecutive quarter. MINT is confident in the strong growth prospect of the country, supported by growing
       China
                           middle class and increased urbanization trend. With its focus on increasing the scale, while instilling
                           productivity and efficiency in the everyday operations of all brands, MINT expects its China hub to yield a
                           meaningful contribution in the future.

                          CHINA’S SSS & TSS GROWTH                                             DRIVING GROWTH AND PRODUCTIVITY

 Same-store-sales of China operations continued to improve in
  1Q17, primarily from the strong operational performance of
                                                                                 Riverside reported strong same-store-sales growth in both the
                                                                                  north (Beijing) and south (Shanghai) of China.
       Riverside brand.
                                                                                 China hub will continue to expand its outlets across the three
      1Q17 total-system-sales growth remained strong at 16.6%, from
       the expansion of all three brands (Riverside, Sizzler and Thai
                                                                                  brands – Riverside, Sizzler and Thai Express.

       Express).                                                                 Inmanner,
                                                                                     order to support the continued outlet expansion in a scalable
                                                                                            China hub remains focused on building exceptional
                                                                                     operational excellence, including the supply chain management.
 25%

                                                                                 The plan to increase Minor Food’s stake in Riverside based on
                                                                                  the original agreement with the Founders, in order to capture
 20%
                                                                                     the strong growth prospect of the brand, remains intact.

 15%

 10%

  5%

  0%
               1Q16         2Q16         3Q16      4Q16          1Q17

               Same-Store-Sales Growth          Total-System-Sales Growth

                                                                        Minor Food                                                                    29
AUSTRALIA HUB
  1Q17 RESTAURANT
REVENUE CONTRIBUTION        Australia hub’s revenue contributed 13% of total restaurant business in 1Q17. Australia hub has provided
                            Minor Food with stable financial performance despite the temporary impact from the slowdown of the
                            domestic economy, as majority of revenue was franchise income. Apart from franchise business, stronger
   13%                      performance of Veneziano coffee roasting business also helped drive profitability of Australia hub in 1Q17.
   Australia

                       AUSTRALIA’S SSS & TSS GROWTH                                      STABLE PERFORMANCE WITH BRIGHTER OUTLOOK

 Same-store-sales    of Australia hub remained flat in 1Q17, as
                                                                                 Although The Coffee Club in Australia has been impacted by the
    Queensland continued to experience the prolonged slowdown of                  domestic economic slowdown, the operation in other markets
    the mining industry.                                                             including New Zealand, the Middle East and Thailand reported
                                                                                     strong performance in 1Q17.
 Consequently, total-system-sales grew by 1.8%, as Australia hub
  remains cautious in expanding its outlets in the midst of
    challenging economic environment.                                            Veneziano  Group performed well with roasting volume 3.5% over
                                                                                  budget in 1Q17.
10.0%
                                                                                 Australia hub will remain cautious in outlet expansion with focus
                                                                                  on product improvement and store renovation to strengthen its
                                                                                     performance when the economic condition turns around.

 5.0%

 0.0%
               1Q16         2Q16         3Q16      4Q16          1Q17

-5.0%

               Same-Store-Sales Growth          Total-System-Sales Growth

                                                                        Minor Food                                                                30
SINGAPORE HUB
  1Q17 RESTAURANT
REVENUE CONTRIBUTION    Like many other F&B operators in the market, the Singapore hub has been impacted by the economic
                        slowdown and increased competition. The hub is not only rationalizing its store portfolio but also
                        strengthening its operations, including the appointment of new management, its product offerings, effective
    8% Singapore        customer segmentation, brand portfolio and operating platform to prepare for the economic turnaround.

                   SINGAPORE’S SSS & TSS GROWTH                                                 STRENGTHENING OF THAI FOOD PORTFOLIO

 Same-store-sales growth of Singapore hub remained negative in
  1Q17 amidst the challenging industry conditions.                                 5%
                                                                                           Percentage Change in F&B Services Index – Restaurants (y-y)

 Consequently, total-system-sales growth was negative in 1Q17 as
  Singapore hub continued to be cautious in outlet expansion with
                                                                                   0%

    the rationalization of its portfolio.
                                                                                   -5%

   0%                                                                          -10%

                                                                               -15%

  -5%                                                                          -20%

                                                                                   Source: Department of Statistics Singapore
 -10%

                                                                               The F&B industry in Singapore has been weak throughout 2016
                                                                                and 2M17, as evidenced by the y-y negative change in Singapore
                                                                                     F&B Services Index of the Restaurant Sector above.
 -15%
           1Q16          2Q16          3Q16      4Q16          1Q17            InSingapore
                                                                                     addition to the quality of total customer experience, the
                                                                                             hub will focus on operational efficiency and cost
                                                                                     control.
          Same-Store-Sales Growth             Total-System-Sales Growth

                                                                      Minor Food                                                                         31
Minor Lifestyle
FINANCIAL PERFORMANCE – MINOR LIFESTYLE
1Q17 revenue of Minor Lifestyle was flat, as the revenue increase of retail trading business was offset by the soft performance of
contract manufacturing business which faced pressure from sluggish performance of its key customers. Net profit declined by
37% y-y, at a higher rate than the decline in revenue, because of the ramping-up stage of the new brands and lower operating
leverage of the contract manufacturing business.
                                                                                                 KEY HIGHLIGHTS
 THB million
                                                       Flat y-y
                                                                      Total-system-sales        • Total-system-sales growth was primarily
                   964                                  963           growth of                   attributable to Charles & Keith and Banana
  Revenue                   794      836       910
                                                                                                  Republic, together with the additional sales
                                                                      5.7%                        from new brands.
                                                                      in 1Q17

                                                                      Same-store-sales          • Charles & Keith and Pedro were the two
                                                                      growth of                   brands in the portfolio that reported
                                                      -29% y-y                                    positive same-store-sales growth in 1Q17.
                                               91
                                                                      -8.5%
                    85
   EBITDA                                                             in 1Q17
                                      52                  60
                             40

                                                                      Retail trading            • 1Q17 revenue from retail trading increased
  EBITDA                                                                                          by 7%, mainly from Charles & Keith,
                   8.8%     5.1%     6.2%     10.0%     6.2%
  Margin                                                              75%                         together with additional sales from new
                                                                      of 1Q17 Minor Lifestyle     brands.
                                                       -37% y-y       revenue
                   38
                                               34
                                                          24
    NPAT                                                              Contract manufacturing • 1Q17     revenue        from      contract
                                      9                                                        manufacturing declined by 17% from soft
                             1
  Net                                                                 25%                      performance of its key customers.
  Margin          3.9%      0.1%     1.1%      3.7%      2.5%
                                                                      of 1Q17 Minor Lifestyle
                  1Q16     2Q16      3Q16     4Q16      1Q17          revenue

                                                          Minor Lifestyle                                                                        33
MINOR LIFESTYLE – OPERATIONAL PERFORMANCE
Retail trading business reported total-system-sales growth of 5.7% in 1Q17 from new brands launched, primarily the opening of
Anello, Etam and Radley outlets. Sales per sq.m. is seeing an improving trend, signifying the higher efficiency of the business.

                         SSS & TSS GROWTH                                                                            SALES PER SQ. M.

20%                                                                                   THB
                                      16.4%                                      35,000

                                                                                 30,000
10%                    8.8%
                                                     6.5%
                                                                 5.7%
          4.2%                                                                   25,000                                                                            25,238
                                       3.2%                                                      23,850                                               24,259

                                                                                                                 20,893             20,699
                                                                                 20,000
 0%
                      0.4%
          -0.1%
                                                -3.4%                            15,000
                                                                  -8.5%

-10%                                                                             10,000
          1Q16         2Q16           3Q16         4Q16          1Q17                            1Q16              2Q16              3Q16              4Q16          1Q17
 No. of                                                                           No. of
 Shops    307          300            292          327           329              Shops           307               300               292               327           329

            Same-Store-Sales Growth           Total-System-Sales Growth                                  Fashion & Home & Kitchenware Sales per Sq. m.

                                                                                * Note: sales per sq.m. was restated to exclude sales of contract manufacturing.

                                                                    Minor Lifestyle                                                                                         34
Corporate Information

                        Oaks Bodhgaya, India
CAPEX & BALANCE SHEET STRENGTH
In addition to committed CAPEX, MINT also set aside additional CAPEX for future investments and new opportunities in the
pipeline. Even with recent acquisitions, leverage ratio remains below the internal policy. With its solid balance sheet, MINT will
be able to primarily use its internal cash flow and debt financing to fund its CAPEX requirements going forward. In addition,
MINT and its senior debenture have “A+” rating by TRIS.
           CAPEX PLANS – COMMITTED & NEW OPPORTUNITIES                                                                         LEVERAGE RATIOS

THB million                                                                              X        X
 15,000                                                                                  6.0      1.4                                                                              Internal
                                                                                                                                                                                    Policy
                                                                                                  1.2                                                                      1.21x
                                                                                                                                                                           1.09x
                                                                                         5.0      1.0
 12,000
                                                                                                  0.8
                                                                                         4.0      0.6
  9,000
                                                                                                  0.4
                                                                                         3.0                 1Q16        2Q16           3Q16         4Q16           1Q17
                                                                                                                Interest Bearing Debt            Net Interest Bearing
  6,000                                                                                                         to Equity                        Debt to Equity
                                                                                         2.0
                                                                                                                             BACK-UP FINANCING
  3,000
                                                                                         1.0                                                   Note: Cash on hand as at end of 1Q17
                                                                                                 THB million
                                                                                                                                                     was THB 5,113 million
                                                                                                  100,000
       -                                                                                 -
                                                                                                    80,000            Shareholders’
              2016A      2017F        2018F       2019F       2020F       2021F                                          Equity
                                                                                                    60,000               42,159
                 Minor Food              Minor Hotels            Minor Lifestyle
                                                                                                    40,000                                                Equity*
              Additional CAPEX (non-committed average per annum)                                                           Debt                            7,687
              for New Investments/Opportunities                                                     20,000                51,007                           Debt
                                                                                                                                                          29,087
              EBITDA coverage on committed CAPEX                                                         0
                                                                                                             Outstanding Borrowing & Equity         Un-Utilized Facility
   * 2016 committed CAPEX includes the final stage of Tivoli acquisition and increased
     shareholding in the hotel portfolio in Africa                                             * Incremental capital increase from MINT-W5 exercise, assuming 100% MINT-W5 conversion

                                                                             Corporate Information                                                                                       36
FIVE-YEAR ASPIRATIONS

                                                                     2021F
                                                               > 250 hotels
                                                               > 300 residences built
                                     1Q17                      > 450 timeshare units
                                                               > 3,400 restaurants
                             155 hotels                       > 500 retail shops & POS
         2009                132 residences built to           (> 39,000 Sqm)
                              date
                             165 timeshare units
  30 hotels                 2,017 restaurants
  1,112 restaurants         329 retail shops & POS
  292 retail shops & POS     (26,910 Sqm)
   (14,275 Sqm)

                                                 6.6bn                       2021F

NPAT                                                 2016
(THB)
      1.4bn
      2009

                             Corporate Information                                         37
MINT’S FIVE-YEAR STRATEGY 2017-2021
Five-year strategy consists of the following three key pillars, with clear goals and measurements.

     2021
                          NPAT growth of 15-20% CAGR                                         ROIC of >14%
     Goals

                       Drive a Portfolio of Own
                                                                                                Expand Through Existing and
                       Brands, With Additional                  Maximize Asset Value
                                                                                               Future Strategic Investments &
                      Contribution From Selected                 and Productivity
                                                                                                        Acquisitions
                         International Brands
   Growth
    Pillars                                                      Strengthening of Hub /
                                                                     Cluster System

                                                               Asset-light    Mixed-use
                                                                 Model        Initiatives

                     Total-system-sales growth                                                  Revenue from overseas of
                               of 15%                                                                     50%
  Measure-                                                  Improvement of margins
   ments                   Revenue growth                                                        Net profit from overseas
                             of over 10%                                                                  of 50%

                                                      Corporate Information                                                     38
You can also read