FY20 RESULTS PRESENTATION - 17 AUGUST 2020 - Kogan.com
←
→
Page content transcription
If your browser does not render page correctly, please read the page content below

FY20 RESULTS PRESENTATION
17 AUGUST 2020
IMPORTANT NOTICE
This disclaimer applies to this presentation and the information contained in it (the “Presentation”).

By reading this disclaimer you agree to be bound by it.

Important notice and disclaimer: This Presentation contains a general summary of the activities of Kogan.com Ltd (the Company; the Business; Kogan.com), does not purport
to be complete and is to be read in conjunction with all other announcements filed with the Australian Securities Exchange (ASX), including Kogan.com’s full year results filed
with the ASX on 17 August 2020. Information in this Presentation is current as at the date of this Presentation 17 August 2020 and remains subject to change without notice.
Financial information in this Presentation is unaudited. Kogan.com does not warrant the accuracy, adequacy or reliability of the information in this Presentation and, to the
maximum extent permitted by law, disclaims all liability and responsibility flowing from the use of or reliance on such information by any person.

Not an offer or financial product advice: This Presentation is not investment or financial product advice or any recommendation (nor tax, accounting or legal advice) and is not
intended to be used as the basis for making an investment decision. In providing this document, Kogan.com has not considered the objectives, financial position or needs of
any particular recipients. Each recipient should consult with its professional adviser(s), conduct its own investigation and perform its own analysis in order to satisfy themselves
of the accuracy and completeness of the information, statements and opinions contained in this document. This Presentation does not constitute an offer to issue or sell
securities or other financial products in any jurisdiction. The distribution of this Presentation outside Australia may be restricted by law.

Forward looking statements: This Presentation contains forward looking statements and comments about future events, which reflect Kogan.com’s intent, belief or
expectation as at the date of this Presentation. Such forward looking statements may include forecast financial and operating information about Kogan.com, its projects and
strategies and statements about the industries and locations in which Kogan.com operates. Forward looking statements can be identified by forward-looking terminology
including, without limitation, “expect”, “anticipate”, “likely”, “intend”, “should”, “could”, “may”, “predict”, “plan”, “propose”, “will”, “believe”, “forecast”, “estimate”, “target”, “due
to” and other similar expressions within the meaning of securities laws of applicable jurisdictions. Indications of, and guidance or outlook on, future earnings or financial
position or performance are also forward looking statements. Forward looking statements involve inherent known and unknown risks, uncertainties and contingencies, both
general and specific, many of which are beyond Kogan.com’s control, and there is a risk that such predictions, forecasts, projections and other forward looking statements will
not be achieved. Actual results may be materially different from those expressed or implied. Forward looking statements are provided as a general guide only and should not
be relied on as an indication, representation or guarantee of future performance. Undue reliance should not be placed on any forward looking statement. Kogan.com does not
undertake to update or review any forward looking statements.

Past performance: Past performance should not be relied upon as (and is not) an indication or guarantee of Kogan.com’s future performance or condition.

Financial data: All financial amounts contained in this Presentation are expressed in Australian currency, unless otherwise stated. Any discrepancies between totals and sums
of components in tables and figures contained in this Presentation are due to rounding.

Non-IFRS measures: Throughout this Presentation, Kogan.com has included certain non-IFRS financial information, including EBITDA, Adjusted EBITDA and Gross Sales.
Kogan.com believes that these non-IFRS financial and operating measures provide useful information to recipients for measuring the underlying operating performance of
Kogan.com’s business. Non-IFRS measures have not been subject to audit.

                                                                                                                                                                                               2
CONTENTS

           CEO Update
           Page 4 - 18

           Financial Update
           Page 19 - 30

           Outlook
           Page 31 - 34

                              3
CEO Update
          Ruslan Kogan
Founder, CEO and Executive Director

                                      4
FY20 HIGHLIGHTS
In FY20 our Business thrived through adversity as years of preparation met opportunity, resulting in Gross Sales1,
Gross Profit and Adjusted EBITDA2 growth of 39.3%, 39.6% and 57.6%, respectively.

                                                                                                   ● Gross Sales1 of $768.9 million outperformed the prior year by 39.3%
             FINANCIAL PERFORMANCE                                                                 ● Revenue, Gross Profit and Adjusted EBITDA2 outperformed the prior year by 13.5%, 39.6% and 57.6%,
                                                                                                     respectively
                                                                                                   ● Growth in Gross Sales1, Gross Profit and Adjusted EBITDA2 accelerated through the period with 2HFY20
                                                                                                     year-on-year (YoY) growth of 62.5%, 68.3% and 74.1% respectively
                                                                                                   ● The Business finished the year with a cash balance of $146.7 million and an undrawn bank debt facility

                                                                                                   ● 2,183,000 Active Customers as at 30 June 2020 – an increase of 35.7% YoY
                     PLATFORM GROWTH                                                               ● Percentage of new Customers who placed a Repeat Order within 1 month of their First Order grew by more
                                                                                                     than 40% in 2HFY20 compared to the prior corresponding period

                                                                                                    ● Kogan Marketplace Gross Sales1 grew by 71.2% in 2HFY20 compared to 1HFY20
                STRONG PERFORMANCE
                                                                                                    ● Exclusive Brands Revenue and Gross profit grew by 26.4% and 43.7% respectively
                 FROM KEY INITIATIVES
                                                                                                    ● Third-Party Brands Gross Profit grew by 3.3%
                                                                                                    ● Kogan Internet grew Customers by 90.9%
                                                                                                    ● Kogan Insurance grew commission-based Revenue by 36.0%
                                                                                                    ● Kogan First loyalty program continues to grow, with Kogan First members purchasing on average much more often
                                                                                                      than non-members, demonstrating loyalty to the platform

                                                                                                   ● The Company acquired Matt Blatt, one of Australia’s premier furniture and homewares brands and a pioneer of
                                                                                                     the online furniture industry in Australia
                               ACQUISITION
                                                                                                   ● The new Matt Blatt website, under the Company’s management, was operational within 1 day of signing the deal

                                                                                                   ● Final dividend announced of 13.5 cents per share, fully franked
                                    DIVIDEND

1.
2.
     The Company believes Gross Sales is a key metric of the Business, given that gross transaction values of Kogan Marketplace, Kogan Mobile, and other New Verticals are not reflected in Revenue.
     Adjusted EBITDA is a measure of the underlying performance of the Business, it removes non-cash items including the unrealised FX gain/ (loss), equity-based compensation and one-off non-recurring items.       5
FY20 RESULTS
Adjusted EBITDA1 of $49.7 million exceeded FY19 Adjusted EBITDA1 by 57.6%, driven by Gross Profit
growth of 39.6%.

                                                                                                                                                                                                                                           FY19 vs FY20
     $m                                                                                                                                             FY19                                                               FY20                    Variance

     Gross Sales2                                                                                                                                  551.8                                                              768.9                    39.3% ▲
     Revenue3                                                                                                                                     438.7                                                                497.9                    13.5% ▲

     Gross Profit                                                                                                                                     90.7                                                              126.5                  39.6% ▲

     Gross Margin                                                                                                                                20.7%                                                                25.4%                4.7pp/23% ▲

     EBITDA                                                                                                                                            30.1                                                               46.5                 54.5% ▲

     Adjusted EBITDA1                                                                                                                                 31.5                                                                49.7                 57.6% ▲

     NPAT                                                                                                                                              17.2                                                              26.8                  55.9% ▲

1.   Adjusted EBITDA is a measure of the underlying performance of the Business, it removes non-cash items including the unrealised FX gain/ (loss), equity-based compensation and one-off non-recurring items.
2.
3.
     The Company believes Gross Sales is a key metric of the Business, given that gross transaction values of Kogan Marketplace, Kogan Mobile, and other New Verticals are not reflected in Revenue.
     The differential between Revenue and Gross Sales is reflective of Kogan Marketplace and New Verticals recognising only seller fee or commission-based Revenue while the gross transaction values are recognised within Gross Sales.                  6
2HFY20 RESULTS
Growth in Gross Sales1, Gross Profit, Adjusted EBITDA2 and NPAT accelerated in 2HFY20.

                                                                                                                                                                                                                                           2HFY19 vs 2HFY20
     $m                                                                                                                                     2HFY19                                                             2HFY20                               Variance

     Gross Sales1                                                                                                                                 274.5                                                                 446.1                       62.5% ▲
     Revenue3                                                                                                                                     206.9                                                                278.4                        34.5% ▲

     Gross Profit                                                                                                                                    45.5                                                                  76.6                     68.3% ▲

     Gross Margin                                                                                                                                22.0%                                                                27.5%                    5.5pp/25.1% ▲

     EBITDA                                                                                                                                            16.5                                                               29.8                      80.3% ▲

     Adjusted EBITDA2                                                                                                                                   18.1                                                               31.5                      74.1% ▲

     NPAT                                                                                                                                                9.8                                                                17.9                    82.3% ▲

1.   The Company believes Gross Sales is a key metric of the Business, given that gross transaction values of Kogan Marketplace, Kogan Mobile, and other New Verticals are not reflected in Revenue.
2.
3.
     Adjusted EBITDA is a measure of the underlying performance of the Business, it removes non-cash items including the unrealised FX gain/ (loss), equity-based compensation and one-off non-recurring items.
     The differential between Revenue and Gross Sales is reflective of Kogan Marketplace and New Verticals recognising only seller fee or commission-based Revenue while the gross transaction values are recognised within Gross Sales.                       7
FINANCIAL HIGHLIGHTS
Improving Operating Leverage over many years has allowed Kogan.com to grow Adjusted EBITDA1
at a faster rate than Gross Sales2 and Gross Profit.

               GROSS SALES2                                                                       GROSS PROFIT                                                                  ADJUSTED EBITDA1                                     NPAT

                                39.3% ▲                                                                            39.6% ▲                                                                              57.6% ▲                       55.9% ▲

                                             768.9                                                                               126.5                                                                            49.7                       26.8

                              551.8                                                                              90.7

              492.6                                                                               80.6                                                                                                 31.5                           17.2
     $m

                                                                                       $m

                                                                                                                                                                            $m

                                                                                                                                                                                                                         $m
                                                                                                                                                                                      25.8                                    14.1
                FY18

                                FY19

                                               FY20

                                                                                                   FY18

                                                                                                                  FY19

                                                                                                                                  FY20

                                                                                                                                                                                        FY18

                                                                                                                                                                                                       FY19

                                                                                                                                                                                                                  FY20

                                                                                                                                                                                                                              FY18

                                                                                                                                                                                                                                      FY19

                                                                                                                                                                                                                                             FY20
1.
2.
     Adjusted EBITDA is a measure of the underlying performance of the Business, it removes non-cash items including the unrealised FX gain/ (loss), equity-based compensation and one-off non-recurring items.
     The Company believes Gross Sales is a key metric of the Business, given that gross transaction values of Kogan Marketplace, Kogan Mobile, and other New Verticals are not reflected in Revenue.                                                8
WHO WE ARE
We have built a Business that allows us to be agile, bold and innovative. Our growing portfolio of businesses
enables us to scale significantly while mitigating operational risks.

                                                                                    2,200

                                                                                    2,100

                                                         Active Customers (000's)
                                                                                    2,000

                                                                                    1,900

                 2,183,000
                                                                                    1,800

                                                                                    1,700

                                                                                    1,600

               Active Customers
                                                                                    1,500

                                                                                            Jun 2019

                                                                                                       Jul 2019

                                                                                                                  Aug 2019

                                                                                                                             Sep 2019

                                                                                                                                        Oct 2019

                                                                                                                                                   Nov 2019

                                                                                                                                                              Dec 2019

                                                                                                                                                                         Jan 2020

                                                                                                                                                                                    Feb 2020

                                                                                                                                                                                               Mar 2020

                                                                                                                                                                                                          Apr 2020

                                                                                                                                                                                                                     May 2020

                                                                                                                                                                                                                                Jun 2020
                                                                                                                                                                                                                                           9
DEDICATED TO SERVE OUR CUSTOMERS
We continue to deliver a high level of customer satisfaction across a wide range of products and services.
Three-peat! Third year running, winner of the People’s Choice Award at the
Australia Post Online Retail Industry Awards 2019 (ORIAS) NET PROMOTER SCORE1
100 Average NPS: 58.5
50
NPS
0
-50
-100
Sep-2018
Dec-2018
Mar-2019
Jun-2019
Sep-2019
Dec-2019
Mar-2020
Jun-2020
MOZO Experts Choice Awards
MOZO People’s Choice Awards for
for Kogan Internet, Kogan Life
Kogan Mobile
Insurance & Kogan Energy
How do we continue to delight our customers?
• Offer a wide range of in-demand products & services at the
best prices
• Execute fast & efficient delivery with excellent customer
Rate City Gold Awards service
Variable Home Loan, 3-year Fixed Home Loan, Investor Finder Best NBN 100 Plan
Variable Home Loan, Investor 3-year Fixed Homes Loan
• Always strive to exceed customer expectations
1. Net Promoter Score (NPS) is calculated based on answers to the question, “How likely is it that you would recommend Kogan.com to a friend or colleague?”. Kogan.com measures its NPS as the percentage of customers who are “promoters” rating its products and
services 9 or 10 out of a possible 10, less the percentage of ”detractors”, rating its products and services 0 to 6 out of a possible 10. The maximum possible NPS is 100, and the minimum possible NPS is -100. 10KOGAN KINETICS
Our mission is to make the most in-demand products and services more affordable and accessible for all.
ENHANCED CONSUMER OFFERING CUSTOMER & PLATFORM GROWTH
• Broader selection • Scale of efficiencies
• Improved pricing • Customer acquisition & retention
The Kogan.com
Virtuous Cycle
MORE PARTNERS & PRODUCTS
• More brands
• Additional verticals
• Top tier manufacturing partners
• More Marketplace sellers
11BUILDING THE KOGAN.COM PLATFORM
Annual Gross Sales per Customer1 is expected to benefit as recently acquired Customers continue to shop
through the remainder of their first year.
REPEAT BUSINESS - CREATING BRAND LOYALTY REPEAT BUSINESS - NEW CUSTOMERS
More than 40% growth YoY in 2HFY20 of new customers
2,000,000 who placed a repeat purchase within 1 month.
% of New Customer Repeat Orders3
1,500,000
Number of orders
1,000,000
500,000
0
2HFY18 1HFY19 2HFY19 1HFY20 2HFY20
First Orders2 Repeat Orders2 1HFY19 2HFY19 1HFY20 2HFY20
LTM CUSTOMER ORDERS & AVERAGE
Repeat business from new Customers, Repeat Orders is
GROSS SALES PER CUSTOMER1
rapidly accelerating, as customers access loyalty benefits and
360
3,900 breadth of range. This is particularly visible in the growth of
3,700 350 Avg Gross Sales $ per customer
New Customer Repeat Orders3, which shows the percentage
3,500
of Customers who placed a Repeat Order2 within 1 month
340
LTM Orders (000's)
of their First Order2 grew by more than 40% in 2HFY20
3,300
330 compared to the prior corresponding period.
3,100
320
2,900 LTM customer orders & average Gross Sales per Customer1,
2,700
310 the number of customer orders is rapidly accelerating with
the significant growth in Active Customers in recent months.
2,500 300
Annual Gross Sales per Customer1 is expected to benefit as
Jul-19
Aug-19
Sep-19
Oct-19
Nov-19
Dec-19
Jan-20
Feb-20
Mar-20
Apr-20
May-20
Jun-20
recently acquired Customers continue to shop through the
remainder of their first year.
LTM Orders Avg Gross Sales $ per Customer1
1. Gross sales $ per customer is Gross Sales within the prior 365 days/no. of Active Customers within the prior 365 days.
2. First Orders means orders placed during the period by customers who had not previously transacted with the Business. Repeat Orders means orders placed during the period by customers who had previously transacted with the Business at the time of their order.
3. New Customer Repeat Orders refers to the percentage of customers who place a Repeat Order within 1 month of their First Order. 12BUILDING THE KOGAN.COM PLATFORM
Free traffic continues to represent more than 70% of all traffic following significant investment in our platform.
LTM RETURN ON INVESTMENT IN MARKETING1
$58
$56
LTM return on investment in marketing1, we
$31
have invested heavily in our platform and
growing Active Customers in 2HFY20, recording
our largest marketing spend ever in FY20. This is
expected to have ongoing long-term benefits as
$17 new Active Customers continue repurchasing.
Gross profit per Active Marketing spend per new Active
Customer Customer
FY19 FY20
TRAFFIC - FREE (BRAND DRIVERS) VS PAID MARKETING
Free Sources
29.2% • Direct website traffic Free vs paid marketing, proportion of traffic
• Direct App traffic from paid sources has increased following
70.8% • Brand searches significant marketing investment, while free
• Other organic search queries traffic continues to represent more than 70% of
all traffic (FY19: Free 74%, Paid: 26%).
• Email-based direct marketing
• Others
Free Paid
1. LTM Gross Profit /LTM Active Customers FY19 vs FY20; marketing costs/sum of new Active Customers in FY20 vs FY19. 13KOGAN MARKETPLACE
Gross Sales1 in 2HFY20 grew by 71.2% on 1HFY20. The pipeline for new sellers remains strong and
continues to grow.
KOGAN MARKETPLACE GROSS SALES1 ACHIEVED SIGNIFICANT GROWTH HALF-ON-HALF
71.2% ▲
100.0
75.0
Gross Sales1 ($m)
50.0
25.0
0.0
2HFY192 1HFY20 2HFY20
The growth of Kogan Marketplace demonstrates the scalability of the platform and the strong customer and seller
engagement achieved to date, while also indicating the size of the opportunity as the Kogan Marketplace expands its offering,
makes it easier for sellers to list products on Kogan.com, and launches in New Zealand.
1. The Company believes Gross Sales is a key metric of the Business, given that gross transaction values of Kogan Marketplace, Kogan Mobile, and other New Verticals are not reflected in Revenue.
2. Kogan Marketplace launched in 3QFY19, the prior period (2HFY19) does not reflect a full half of trading. 14EXCLUSIVE BRANDS STRATEGY
Exclusive Brands achieved Revenue growth of 34.1% in 2HFY20 vs 2HFY19, continuing to meet strong
consumer demand across a wide-array of products.
YoY GROWTH IN EXCLUSIVE BRANDS REVENUE ACCELERATED IN 2HFY20
34.1% ▲
150 Exclusive Brands growth rate increased YoY
and benefits from:
• Full control of the end-to-end supply chain
100
• Strong competitive advantage
Revenue $m
• Building trusted brands renowned for value
50 • Compelling consumer offering
• Ever expanding range of in-demand products
• 14+ years’ experience
0
2HFY19 2HFY20
15KOGAN FIRST
Kogan First provides members with a suite of consumer benefits, creating a large and growing community
of loyal customers who access free shipping and a range of exclusive benefits.
KOGAN FIRST MEMBERS1
Kogan First members purchase on
average much more often than non-
members, demonstrating loyalty to
the platform, and also demonstrating
the significant savings available
through the loyalty program.
2HFY192 1HFY20 2HFY20
1. Kogan First Members excludes Kogan First customers who are in a trial period or have received complimentary Kogan First Membership, and includes only those members who have paid membership fees.
2. Kogan First launched in 4QFY19, the prior period (2HFY19) does not reflect a full half of trading. 16OUR PROPRIETARY TECHNOLOGY
IT solutions powering scale.
PLATFORM FOR
SCALE & GROWTH
TECHNOLOGY PLATFORM
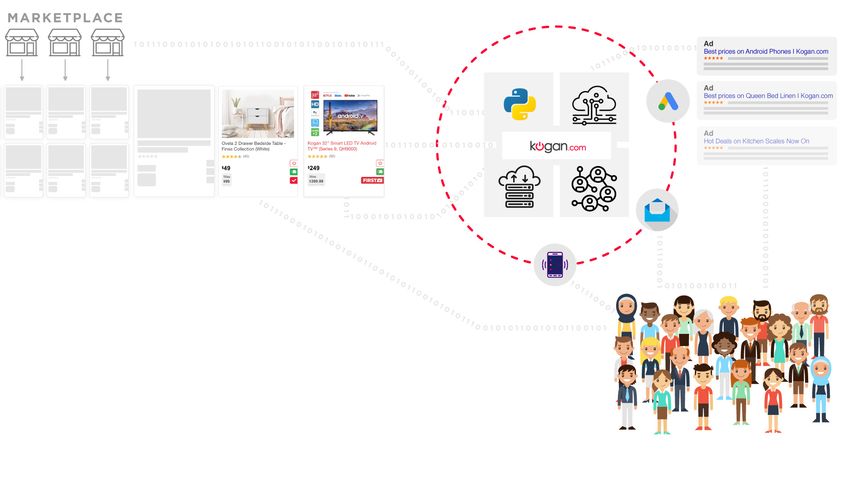
Proprietary eCommerce Engine Refined Team Technical Capability
• Offers over 13 payment methods - including BNPL • Proprietary Product Search algorithm • Strong development processes
• Secure platform & Identity Management • Unified 360˚ Customer Data Platform • Full stack cross functional capabilty
• Behavioural Marketing & A.I. • Automated & optimised digital ad generation • Refined tooling & continuous delivery
• Multi-brand, multi-region eCommerce capability • Production deployments daily
17OUR PROPRIETARY TECHNOLOGY
ALGORITHMS & A.I.
POWERING SCALE
Kogan’s proprietary technology processes millions of events
each day to achieve industry leading personalisation and
optimisation across:
• A.I. powered recommendations on site and in outbound marketing;
• Dynamic and personalised marketing messages;
• Enhanced search results;
• Industry leading anomaly and fraud detection; and
• Automatic ad generation and spend optimisation across hundreds of thousands of
SKUs, millions of keyword combinations - all optimised for individual performance.
18Financial Update
David Shafer
CFO, COO and Executive Director
19FY20 RESULTS COMPARED TO FY19
Adjusted EBITDA1 growth to $49.7 million represents an increase of 57.6%.
$m FY19 FY20 Variance %
Gross Sales2 551.8 768.9 39.3% Overview
Revenue3 438.7 497.9 13.5% Gross Sales2 reflects the total transactional value of Kogan Retail,
Cost of sales (348.0) (371.4) Kogan Marketplace and New Verticals. Revenue reflects the
6.7%
accounting Revenue of Kogan Retail and only the commission or
Gross Profit 90.7 126.5 39.6% seller fees received from Kogan Marketplace and New Verticals.
Gross margin 20.7% 25.4% 4.7pp/23% Revenue3 was driven by the growth from Exclusive Brands and
Variable costs (18.1) (20.1) 10.9% Kogan Marketplace increasing 26.4% and 768.4% YoY, respectively.
Kogan Internet, Kogan Insurance, Kogan First and advertising
Marketing costs (18.7) (27.6) 47.9% income all grew YoY. Third-Party Brands Revenue stabilised.
Contribution Profit 53.8 78.8 46.4%
Gross Margin increased by 4.7pp to 25.4% as a result of the growth
Contribution margin 12.3% 15.8% 3.6% in commission-based or seller-fee-based Revenue across the New
People costs (16.5) (20.2) 22.0% Verticals and Kogan Marketplace. Gross Margin within Exclusive
Brands and Third-Party Brands also increased YoY.
Other costs (7.0) (10.6) 52.1%
Total operating costs (60.4) (78.6) Variable costs reflect the increased volume in transactions and
30.2%
stock holdings that has allowed the Business to deliver its largest
Unrealised FX gain/(loss) (0.2) (1.4) 659.2% Gross Sales1 and Gross Profit ever.
EBITDA 30.1 46.5 54.5% Marketing costs reflect a strategic investment in marketing and has
EBITDA Margin 6.9% 9.3% 2.5pp/36.2% delivered Active Customer growth of 35.7% since FY19, equating to
574,000 incremental Active Customers.
Unrealised FX gain/(loss) (0.2) (1.4) 659.2%
Equity-based compensation (1.2) (1.0) (16.2%) Contribution profit grew 46.4% YoY owing to the investment made
in our platform, technology and supply chain.
Penalties & costs provision 0.0 (0.7) 0.0%
Adjusted EBITDA 1
31.5 49.7 EBITDA of $46.5 million reflects an increase in EBITDA margin of
57.6%
2.5pp to 9.3%. EBITDA was impacted by unrealised FX losses of $1.4
Depreciation & amortisation (6.7) (7.4) 10.1% million which are non-cash. Adjusted EBITDA1 excluding unrealised
EBIT 23.4 39.1 FX losses, equity-based compensation and provision for penalties &
67.4% costs grew to $49.7 million.
Interest 0.0 (0.2) (719.3%)
Profit before tax 23.4 38.9 66.0%
Income tax expense (6.2) (12.0) 94.0%
NPAT 17.2 26.8 55.9%
1. Adjusted EBITDA is a measure of the underlying performance of the Business, it removes non-cash items including the unrealised FX gain/ (loss), equity-based compensation and one-off non-recurring items.
2. The Company believes Gross Sales is a key metric of the Business, given that gross transaction values of Kogan Marketplace, Kogan Mobile, and other New Verticals are not reflected in Revenue.
3. The differential between Revenue and Gross Sales is reflective of Kogan Marketplace and New Verticals recognising only commission-based Revenue while the gross transaction values are recognised within Gross Sales. 202HFY20 RESULTS COMPARED TO 2HFY19
2HFY20 reflected a period of strong acceleration in key metrics.
$m 2HYFY19 2HFY20 Variance %
Gross Sales1 274.5 446.1 62.5% Overview
Revenue2 206.9 278.4 34.5% Gross Sales1 growth accelerated through the period. Our diversified
Cost of sales (161.4) (201.8) 25.0% supply chain and business preparation over many years enabled us
to meet growing consumer demand.
Gross Profit 45.5 76.6 68.3%
Gross margin 22.0% 27.5% 5.5pp/25.1% Gross Margin increased by 5.5pp to 27.5% as a result of commission-
based or seller-fee-based Revenue growth across the New Verticals
Variable costs (9.3) (10.3) 10.1% and Kogan Marketplace. Gross Margin within Exclusive Brands and
Third-Party Brands also increased YoY. Gross Margin also improved
Marketing costs (7.1) (18.9) 168.6%
in 2HFY20 compared to the prior half driven by growth in Kogan
Contribution Profit 29.1 47.4 62.6% Marketplace and expansion in product margins across the Business.
Contribution margin 14.1% 17.0% 2.9% Marketing costs reflect the significant investment made by the
People costs (8.6) (11.0) 28.6% Business in growing our platform and Active Customers in 2HFY20.
Other costs (3.2) (6.0) 85.8% Contribution profit grew 62.6% over the period driven by the
Total operating costs (28.2) (46.2) 64.1% investment made in our platform, technology and supply chain.
Unrealised FX gain/(loss) (0.8) (0.6) (31.4%) People costs includes a provision of $0.9 million for STI bonus
payments to the management team in respect of FY20
EBITDA 16.5 29.8 80.3%
outperformance.
EBITDA Margin 8.0% 10.7% 2.7pp/34%
EBITDA of $29.8 million reflects an increase in EBITDA margin of
Unrealised FX gain/(loss) (0.8) (0.6) (31.4%) 2.7pp to 10.7%. EBITDA was impacted by unrealised FX losses of
Equity-based compensation (0.7) (0.4) (40.9%) $0.6 million which are non-cash and the $0.7 million provisions
for penalties & costs. Adjusted EBITDA3 excluding unrealised FX
Penalties & costs provision 0.0 (0.7) 0.0% losses, equity-based compensation and provision for penalties &
Adjusted EBITDA 3
18.1 31.5 74.1% costs grew to $31.5 million, an increase of 74.1% on the prior half
2HFY19. Notwithstanding the significant investment in Marketing,
Depreciation & amortisation (3.5) (3.6) 1.5% the Business was able to further improve operating leverage due to
EBIT 13.0 26.3 101.7% strong repeat purchasing behaviour by consumers.
Interest (0.1) (0.2) 109.3%
Profit before tax 12.9 26.1 101.6%
Income tax expense (3.1) (8.2) 162.6%
NPAT 9.8 17.9 82.3%
1. The Company believes Gross Sales is a key metric of the Business, given that gross transaction values of Kogan Marketplace, Kogan Mobile, and other New Verticals are not reflected in Revenue.
2. The differential between Revenue and Gross Sales is reflective of Kogan Marketplace and New Verticals recognising only commission-based Revenue while the gross transaction values are recognised within Gross Sales.
3. Adjusted EBITDA is a measure of the underlying performance of the Business, it removes non-cash items including the unrealised FX gain/ (loss), equity-based compensation and one-off non-recurring items. 21KEY DRIVERS OF KOGAN.COM
FY20 FINANCIAL PERFORMANCE
Kogan.com shines through adversity as preparation meets opportunity.
The Business achieved growth in Active Customers of 35.7% in FY20. At 30 June 2020 the Business had
PLATFORM GROWTH 2,183,000 Active Customers.
Kogan First memberships scaled significantly during FY20 as more and more customers recognise the
significant value we are offering via our loyalty program.
The Business strategically increased its marketing activities in order to grow Active Customers. The
significant investment to grow our platform and Active Customers had an immediate impact on growth
in Active Customers and is also expected to have ongoing long-term benefits to our Business.
Exclusive Brands continued to achieve year-on-year Revenue growth with an increase of 26.4% on
PRODUCT DIVISIONS FY19. Exclusive Brands also achieved Gross Profit growth of 43.7%, resulting in a contribution of
51.3% to overall Gross Profit in FY20. This was achieved through ongoing investment in Exclusive
Brands inventory to broaden our range and meet consumer demand from the growing base of Active
Customers.
Third-Party Brands returned to growth in Gross Profit, delivering an increase of 3.3% on FY19, through
improved product selection and sourcing.
The success of Kogan Marketplace has resulted in Gross Sales1 increasing by 71.2% in 2HFY20
KOGAN MARKETPLACE compared to 1HFY20. The platform continues to resonate with sellers, with Kogan Marketplace having
increased the number of sellers significantly, while there continues to be a long backlog of sellers ready
to be onboarded.
The exceptional growth of Kogan Marketplace has led to a period of transition for the Business. We
are continually improving our proprietary marketplace platform which enables the Business to achieve
ongoing growth without a corresponding investment in inventory. The growth of Kogan Marketplace
means that customers have more choice than ever.
1. The Company believes Gross Sales is a key metric of the Business, given that gross transaction values of Kogan Marketplace, Kogan Mobile, and other New Verticals are not reflected in Revenue. 22KEY DRIVERS OF KOGAN.COM
FY20 FINANCIAL PERFORMANCE
Kogan Mobile performed relatively in line with FY19, contributing over 10% of total Gross Profit and setting
NEW VERTICALS up a solid foundation for growth of Kogan Mobile New Zealand. Kogan Internet Customers grew 90.9%
year-on-year, resulting in commission-based Revenue increasing by 144.9% over the same time period.
Kogan Insurance, which includes our suite of insurance products, continues to scale. Commission-based
Revenues grew 36.0% year-on-year.
New Verticals launched in 1HFY20, Kogan Cars, Kogan Credit Cards, Kogan Superannuation,
Kogan Energy and Kogan Mobile NZ are growing. Customers continue to receive great deals on the
services they need.
Variable Costs predominantly consist of warehousing and selling costs. The increase in these costs is
VARIABLE COSTS largely driven by growing volumes of transactions and stock holdings that has allowed the Business to
deliver its largest Gross Sales1 and Gross Profit ever.
In order to retain key talent and align their interests with our Shareholders, the Business has made
INVESTMENT IN OUR TEAM strategic investments in team members. People Costs are inclusive of the annual Short-Term Incentive of
$0.9 million for Senior Management following significant outperformance of budget. Long-Term Incentives
remain in place and People Costs have increased year-on-year, partly as a result. The majority of equity-
based compensation was issued in the period surrounding the IPO.
1. The Company believes Gross Sales is a key metric of the Business, given that gross transaction values of Kogan Marketplace, Kogan Mobile, and other New Verticals are not reflected in Revenue. 23IMPROVING OPERATING LEVERAGE
FY17 FY18 FY19 FY20
Revenue 100.0% 100.0% 100.0% 100.0%
Gross Margin 17.9% 19.5% 20.7% 25.4%
Delivered Margin (after all logistics costs) 14.2% 16.1% 16.5% 21.4%
Marketing costs 3.7% 4.8% 4.3% 5.6%
Contribution Margin 10.6% 11.3% 12.3% 15.8%
Fixed costs 6.3% 5.0% 5.4% 6.2%
EBITDA Margin 4.3% 6.3% 6.9% 9.3%
Adjusted EBITDA Margin 5.2% 6.3% 7.2% 10.0%
Over the past four years, we have delivered growth in Gross Margin, Contribution Margin, EBITDA Margin and Adjusted
EBITDA Margin. We continue to deliver significant projects to grow our products and services offering, while heavily investing
in our platform.
24FY20 GROSS PROFIT PRODUCT & BUSINESS MIX
More than half of our Gross Profit is generated from our Exclusive Brands Products.
Other Income1 5.6%
Advertising Income 2.9%
Kogan Mobile Australia 10.1%
Kogan Marketplace 10.3%
Exclusive Brands 51.3%
Kogan Marketplace outperformed
all expectations in FY20. Exclusive Brands products
continue to deliver the
majority of our Gross Profit.
Third-Party Brands 19.8%
Third-Party Brands returned to
growth by increasing YoY Gross
Profit by 3.3%.
1. Other income includes Kogan Travel, Kogan Insurance, Kogan Internet, Kogan Mobile NZ, Kogan Cars, Kogan Energy and Kogan First. 25KOGAN MOBILE & KOGAN INTERNET
Kogan Mobile Australia and Kogan Internet continue to achieve growth in number of Customers.
Kogan Mobile NZ launched during 1HFY20.
KOGAN INTERNET CUSTOMERS1
Kogan Internet commission-based Revenue
grew 144.9% year-on-year driven by Customer
growth of 90.9%. Management are actively
Customers
working with Vodafone to continue delivering
competitive consumer offerings.
Kogan Mobile Australia, continues to
contribute significantly to Gross Profit.
The Business is continuing to work on new
FY18 FY19 FY20
offerings to accelerate growth in FY21 and
beyond.
KOGAN MOBILE AUSTRALIA CUSTOMERS1
Kogan Mobile New Zealand, in partnership
with Vodafone NZ, was launched during
1HFY20. Vodafone NZ is New Zealand’s largest
mobile network operator.
Customers
FY16 FY17 FY18 FY19 FY20
1. Are those customers whose services are active at the relevant reporting date. 26KOGAN SUPER, KOGAN ENERGY,
KOGAN CREDIT CARDS
Recently launched Kogan Super, Kogan Energy and Kogan Credit Cards are growing strongly.
KOGAN SUPER FUNDS UNDER MANAGEMENT1 KOGAN ENERGY CUSTOMERS2
Funds Under Management
Active Customers
1HFY20 2HFY20 1HFY20 2HFY20
KOGAN CREDIT CARDS CUSTOMERS2 Kogan Super is an ultra low-fee superannuation fund which
launched in August 2019 in partnership with Mercer.
Kogan Energy offers competitive power and gas deals and was
launched in September 2019 in partnership with part of the
Meridian Energy Limited group.
Active Customers
Kogan Credit Cards is a credit card with uncapped Kogan
reward points, no annual fee, complimentary Kogan First
membership, and competitive rates and fees. It was launched in
October 2019 in partnership with Citi.
1HFY20 2HFY20
1. Funds Under Management represents the market value of the financial assets managed under Kogan Super.
2. Only includes those customers with an active utilities or credit card account at the relevant reporting date. 27KOGAN INSURANCE
Kogan Insurance commission-based Revenues for FY20 grew by 36.0% year-on-year.
KOGAN INSURANCE COMMISSION-BASED REVENUES
1,000
Commission-based revenue ($'000)
750
500
250
0
FY181 FY19 FY20
Kogan Insurance, which includes our suite of insurance products, continues its strong growth in FY20.
1. Kogan Insurance launched in 1QFY18. As such, FY18 does not reflect a full year of commission-based Revenues. 28NET ASSETS
A strong balance sheet at 30 June 2020 with $146.7 million of cash and an undrawn debt facility.
$m Jun-20
Cash balance at 30 June 2020 of $146.7 million is
CURRENT ASSETS inclusive of the proceeds from the $100.0 million
Cash 146.7 Placement, and exclusive of the proceeds from the
Trade and other receivables 6.8
$20.0 million share purchase plan completed in
July 2020.
Inventories 112.9
Total current assets 266.4
Inventories held at 30 June 2020 was comprised
NON-CURRENT ASSETS of:
Property, plant and equipment 0.3
Right of use asset 2.4 • $80.4 million in warehouse; and
Intangible assets 8.3 • $32.5 million in transit.
Deferred tax assets 2.4
Total non-current assets 13.3 More than 99% of inventory in warehouse was less
Total assets 279.7 than 365 days old.
CURRENT LIABILITIES
The purchase of Matt Blatt included the
Trade and other payables 88.0
capitalisation of intellectual property worth $4.0m,
Lease liability 2.0
which has been included within the intangible
Provisions 4.3
assets balance.
Deferred income 19.3
Financial liabilities 1.1 Financial liabilities is reflective of the unrealised FX
Total current liabilities 114.6 loss recognised against forward contracts, which is
NON-CURRENT LIABILITIES non-cash.
Lease liability 0.5
Deferred income and provisions 0.6 Trade and other payables reached a seasonal
Total non-current liabilities 1.0 high following the end of financial year peak sales
period.
Total liabilities 115.6
Net ASSETS 164.0
As at the balance date, the business had an
undrawn bank debt facility of $30.0 million.
29FY20 STATUTORY CASH FLOW
$m
CASH FLOWS FROM OPERATING ACTIVITIES
Receipts from customers 578.0
Payments to suppliers and employees (522.8)
Interest received 0.1
Finance costs paid (0.6)
Income tax paid (9.0)
The Business delivered cash flow from
Net cash provided by operating activities 45.6 operating activities of $45.6 million in FY20,
CASH FLOWS FROM INVESTING ACTIVITIES demonstrating strong cash generation across
the Company’s portfolio of businesses.
Purchase of property, plant and equipment (0.2)
Purchase of intangible assets (7.9)
Net cash (used in) investing activities (8.1)
CASH FLOWS FROM FINANCING ACTIVITIES
Net proceeds from issue of shares 100.0
Transaction costs related to the issue of shares (2.6)
Dividends paid (14.0)
Repayments of lease liabilities (1.6)
Net cash provided by financing activities 81.8
Net increase in cash held 119.3
Cash and cash equivalents at beginning of financial year 27.5
Cash and cash equivalents at end of financial year 146.7
30Outlook
31PORTFOLIO BUSINESS - MARKET
Achieved greater than
Portfolio Business Partner Launch date Market size 1% market share?
Kogan Retail n/a FY06 $29.4 billion1 ✓
Kogan Marketplace n/a Launched FY19 $29.4 billion1 -
Kogan Internet Vodafone Launched 4QFY18 11.6 million premises2 -
Kogan Insurance Hollard Launched 1QFY18 $51.0 billion3 -
Kogan Health Medibank Launched 3QFY18 $25.4 billion4 -
Kogan Life Greenstone Launched 4QFY18 $46.5 billion5 -
Kogan Pet PetSure Launched 4QFY18 $490 million6 -
Kogan Mobile Vodafone Launched 2QFY16 32.89 million mobile phone connections 7
✓
Kogan Mobile NZ Vodafone Launched 1HFY20 3.8 million users8 -
Kogan Money Home Loans Pepper & Adelaide Bank Launched 2QFY19 $85.6 billion 9
-
Kogan Money Super Mercer Launched 1HFY20 15.6 million account holders10 -
Kogan Money Credit Card Citi Launched 1HFY20 16.0 million cards 11
-
Kogan Cars Firstmac Launched 4QFY19 1.1 million cars12 -
Kogan Energy Powershop (part of Meridian Energy) Launched 1HFY20 $40.8 billion13 -
1. Source: https://www.ibisworld.com.au/industry-trends/market-research-reports/thematic-reports/online-shopping.html
2. Number of households connected or ready to connect to the NBN at Jun 2019. Source: https://www2.nbnco.com.au/content/dam/nbnco2/2020/documents/how-we-are-tracking/nbn-may-2020-monthly-progress-report.pdf
3. Source: https://www.apra.gov.au/sites/default/files/2020-05/Quarterly%20general%20insurance%20performance%20statistics%20highlights%20March%202020_0.pdf
4. Source: https://www.ibisworld.com/au/market-size/health-insurance/
5. Source: https://www.ibisworld.com/au/industry/life-insurance/522/
6. Source: Canstar - www.canstar.com.au/pet-insurance/how-much-do-we-spend-on-our-pets/
7. Source: https://www.statista.com/statistics/680482/australia-number-of-mobile-subscriptions/
8. Source: http://archive.stats.govt.nz/browse_for_stats/industry_sectors/information_technology_and_communications/isp-2017-mobile-connections-story.aspx
9. Source: https://www.ibisworld.com/au/industry/mortgages/1909/
10. Source: https://www.ato.gov.au/About-ATO/Research-and-statistics/In-detail/Super-statistics/Super-accounts-data/Multiple-super-accounts-data/
11. Source: https://qsuper.qld.gov.au/news-hub/articles/2018/03/13/04/46/credit-cards-the-stats
12. Source: https://www.caradvice.com.au/817278/vfacts-2019-new-car-sales-results/
13. Source: https://www.ibisworld.com/au/industry/electricity-retailing/2147/ 32FY21 OUTLOOK
We expect that FY21 will see further growth in Exclusive Brands, the scaling up of Kogan Marketplace
and New Verticals, and further growth in the Active Customer base.
Consistent with prior years, the Company will not be providing formal
Adjusted EBITDA1 guidance for FY21. However, the Company will
provide regular business updates during the year.
July 2020 unaudited management accounts show:
• Gross Sales2 growth of more than 110% YoY
• Gross Profit growth of more than 160% YoY
• Adjusted EBITDA1 of more than $10.0 million
IN FY21, WE EXPECT:
Growth of Active Customer base
Growth in Exclusive Brands and Third-Party Brands
Growth in Kogan Marketplace, and launch in New Zealand
Growth across New Verticals
Growth by acquisition
1. Adjusted EBITDA is a measure of the underlying performance of the Business, it removes non-cash items including the unrealised FX gain/ (loss), equity-based compensation and one-off non-recurring items.
2. The Company believes Gross Sales is a key metric of the Business, given that gross transaction values of Kogan Marketplace, Kogan Mobile, and other New Verticals are not reflected in Revenue. 33DIVIDEND
The Board has declared a fully franked final Dividend of 13.5 cents per share, which reflects total
Dividends of 21.0 cents per share in respect of FY20. The Dividend Reinvestment Plan will apply to the
final Dividend at a 2.5% discount to the 5-day volume weighted average price of shares sold on ASX from
the trading day prior to the record date.
DPS (cents) Franking (%) Record date Election date1 Payment date
Dividend per share 13.5 100.0 24 August 2020 25 August 2020 19 October 2020
(cents)
1. The date by which an eligible Shareholder must have notified Kogan.com Ltd that it will participate in the DRP. 34GLOSSARY
1HFYxx: the six months ended 31 December 20xx.
2HFYxx: the six months ended 30 June 20xx.
1QFYxx: the three months ended 30 September 20xx.
2QFYxx: the three months ended 31 December 20xx.
3QFYxx: the three months ended 31 March 20xx.
4QFYxx: the three months ended 30 June 20xx.
Active Customers: unique customers who have purchased in the last twelve months from 1 July 2020, rounded to the nearest thousand.
Adjusted EBITDA: earnings before interest, tax, depreciation, amortisation, unrealised FX gain/(loss) , equity-based compensation and one-off non-recurring items.
Contribution Margin: Gross Profit less variable costs divided by Revenue.
Core Website Channels: Kogan.com, Kogan Apps (iPhone and Android), Dick Smith and Matt Blatt Assets.
EBIT: earnings before interest and tax.
EBITDA: earnings before interest, tax, depreciation and amortisation.
EBITDA Margin: EBITDA divided by Revenue.
Exclusive Brands: products sold under brands owned by Kogan.com.
First Orders: refer to orders placed during the period by Active Customers who had not previously transacted with the Business.
Funds Under Management (FUM): represents the market value of the financial assets managed under Kogan Super.
FYxx: financial year ended 30 June 20xx.
Gross Margin: Gross Profit divided by Revenue.
Gross Profit: Revenue less cost of goods sold.
Gross Sales: is the gross transaction value, on a cash basis, of products and services sold, of Kogan Retail, Kogan Marketplace and the New Verticals.
Kogan Cars: New Vertical launched in 4QFY19 offering competitive prices on new-car purchases.
Kogan Energy: New Vertical launched in 1HFY20 offering low cost power and gas whilst allowing customers to easily track their energy usage on-demand, in partnership
with Powershop (part of Meridian Energy).
Kogan First: our loyalty program offering members free/upgraded express shipping along with special offers across thousands of our products.
Kogan Health: New Vertical launched in 3QFY18 offering health insurance online.
Kogan Insurance: New Vertical launched in 1QFY18 offering Insurance online.
Kogan Internet: New Vertical launched in 4QFY18 offering NBN plans via Vodafone’s fixed line NBN network.
Kogan Life: New Vertical launched in 4QFY18 offering life insurance online.
35GLOSSARY
Kogan Marketplace: a platform launched in 3QFY19 for sellers and buyers to complete transactions on Kogan.com, with commission-based Revenue being earned by Kogan.com.
Kogan Mobile Australia: launched in 2QFY16, vertical offering pre-paid mobile phone plans available online using Vodafone’s mobile network in Australia.
Kogan Mobile New Zealand: New Vertical launched in 1HFY20 offering pre-paid mobile phone plans available online using Vodafone’s mobile network in New Zealand.
Kogan Money Credit Cards: New Vertical launched in 1HFY20 offering a competitively priced credit card with compelling loyalty incentives for consumers to shop on Kogan.com and
elsewhere, in partnership with Citi.
Kogan Money Home Loans: New Vertical launched in 2QFY19 offering competitive home loan products, in partnership with Adelaide Bank and Pepper Group.
Kogan Money Super: New Vertical launched in 1HFY20 offering a new no frills, ultra low fee Australian super fund, in partnership with Mercer.
Kogan Pet: vertical launched in 4QFY18 offering pet insurance online.
Kogan Retail: Exclusive Brands and Third-Party Brands sales through the Core Website Channels and eBay, Amazon.com.au, TradeMe and other platforms.
Kogan Travel: vertical offering online holiday packages and hotel and cruise bookings.
LTM: last twelve months.
New Customer Repeat Orders: refers to the percentage of customers who place a Repeat Order within 1 month of their First Order.
New Verticals: Kogan Cars, Kogan Credit Cards, Kogan Energy, Kogan Health, Kogan Insurance, Kogan Internet, Kogan Life, Kogan Marketplace, Kogan Mobile Australia, Kogan Mobile
New Zealand, Kogan Money, Kogan Pet, Kogan Super and Kogan Travel.
Operating Leverage: the efficiency by which a business converts its Revenue into Net Profit.
Partners: refers to the companies Kogan.com has conducted business with.
Product Division: means Exclusive Brands and Third-Party Brands.
QoQ: quarter-on-quarter.
Repeat Orders: refer to orders placed during the period by Active Customers who had previously transacted with the Business at the time of their order.
ROI: return on investment.
The Business: refers to Kogan.com Ltd.
The Company: refers to Kogan.com Ltd.
The Presentation: refers to this document, titled ‘Kogan.com - FY20 Results Presentation’.
Third-Party Brands: products sold under brands owned by third parties, which are sourced domestically in Australia and internationally.
Working Capital: total of trade and other receivables, inventories and prepayments which are included within other assets, less trade and other payables, deferred income, employee
benefits and current provisions.
YoY: year-on-year.
36ANNEXURE 1
FY20 REVENUE GROWTH BY PORTFOLIO BUSINESS
Revenue growth was driven by Exclusive Brands and Kogan Marketplace.
FY19 FY20
$m Revenue Revenue YoY Revenue growth %
Exclusive Brands 184.1 232.7 26.4%
Third-Party Brands 233.2 228.6 (2.0%)
Kogan Marketplace 1.5 13.0 768.4%
Product Divisions 418.8 474.3 13.2%
Kogan Travel 0.8 0.5 (34.1%)
Kogan Insurance 0.6 0.8 36.0%
Kogan Internet 0.4 1.0 144.9%
Kogan Mobile 13.2 12.8 (2.9%)
Kogan Money 0.0 0.2 >1,000%
Kogan First 0.0 2.4 >1,000%
Total 433.9 492.0 13.4%
Advertising 2.4 3.7 53.2%
Other Income 2.4 2.2 (9.1%)
Total 438.7 497.9 13.5%
37You can also read


