Connecting Means the World - STRENGTH THROUGH STRATEGY: Halifax Stanfield International Airport
←
→
Page content transcription
If your browser does not render page correctly, please read the page content below

STRENGTH THROUGH STRATEGY:
Connecting Means the World

    Halifax International Airport Authority   2018 Business Plan (Prepared in December 2017)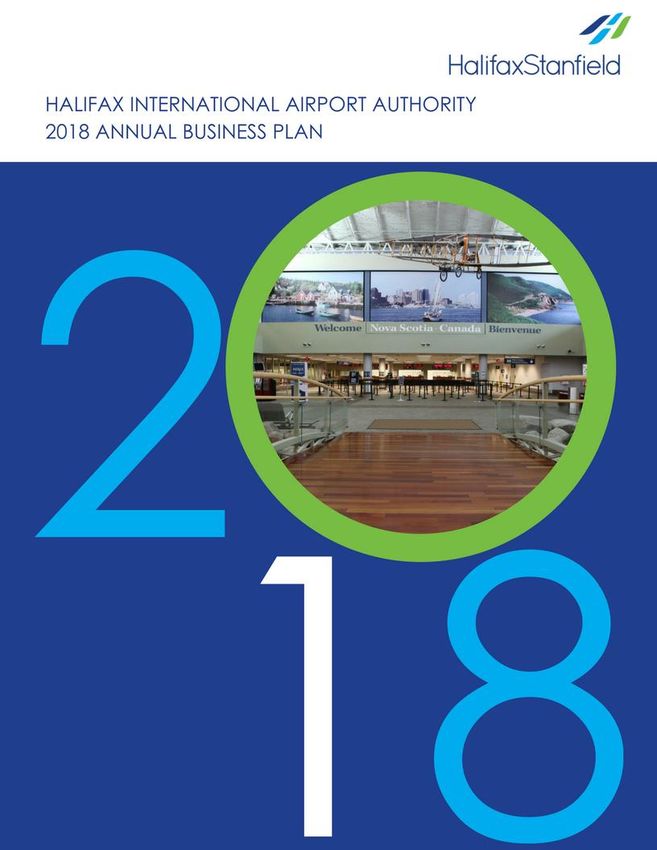
A
    Table of Contents

    A         EXECUTIVE SUMMARY ........................................................................ 5
                      PLANNING PROCESS .......................................................................... 5
                      2018 BUSINESS PLAN ......................................................................... 6

    B         STRATEGIC OVERVIEW ....................................................................... 7
                      MISSION, VISION AND VALUES ....................................................... 7
                      STRATEGIC PRIORITIES .................................................................... 7

    C         2018 PLAN .................................................................................................... 8
                      ECONOMIC OUTLOOK ........................................................................ 8

                            Aviation Industry Trends ...................................................................... 9
                            Passengers .......................................................................................... 10
                           Ecomonic Development Potential ...................................................... 11
                           Cargo .................................................................................................... 12
                      2018 OBJECTIVES AND GOALS .................................................... 13
                      FINANCIAL PLAN ................................................................................ 15
                            Revenue ............................................................................................... 15
                            Expenses ............................................................................................. 16
                            Capital Program .................................................................................. 16
                      FINANCIAL SCHEDULES .................................................................. 18
                            Proforma Balance Sheet ..................................................................... 18
                            Proforma Statement of Operations .................................................... 19
                            Proforma Statement of Cash Flows ................................................... 20

    Halifax International Airport Authority                                2018 Business Plan (Prepared in December 2017)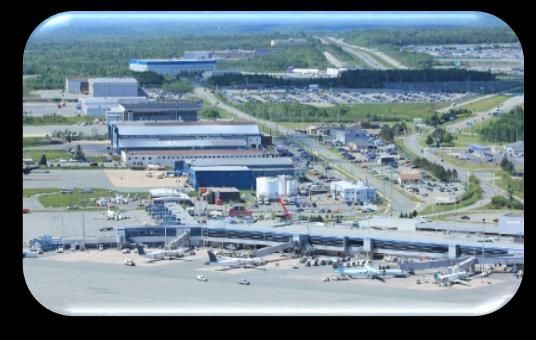
EXECUTIVE SUMMARY

PLANNING PROCESS
Halifax International Airport Authority (HIAA) has a four-tiered planning process to guide airport operations
and development in the long, medium and short term.

                                          The 20-year Master Plan serves as a
                                          framework to guide the long-term development
                                          of the facility to meet the needs of the
                                          community, our stakeholders and the industry.

                                            The 10-Year Capital and Financial Plan
                                            determines HIAA’s infrastructure and funding
                                            requirements over the plan timeline.

                                            The Strategic Plan covers a five-year period and
                                            includes our Mission, Vision, Values and Goals. It
                                            also includes an assessment of the general
                                            economic conditions expected to prevail, as well
                                            as an evaluation of the current and future state of
                                            the aviation industry.

                                           The annual Business Plan draws its direction
                                           from the Strategic Plan and creates specific,
                                           measurable, actionable, results-oriented, and time-
                                           linked goals to support our long-term strategies.

                                                      3
Halifax International Airport Authority                    2018 Business Plan (Prepared in December 2017)
STRENGTH THROUGH STRATEGY: Geared For Growth

2018 BUSINESS PLAN

Halifax International Airport Authority’s (HIAA) 2018 Business Plan is focused on building the foundation
for the realization of many of HIAA’s key strategic priorities identified in the 2017-2021 Strategic Plan. The
theme for the 2018 Business Plan (the Plan) is “Strength through Strategy – Geared For Growth” The plan
provides a roadmap to facilitate the further development of Halifax Stanfield as a gateway to Canada and
a connecting hub to international markets. It focuses on innovation as a primary driver for future cost
management and service improvement with a continued emphasis on diversification and renewal of non-
aeronautical revenue sources.
The Plan considers the impacts of the economic environment HIAA operates within and takes a measured
approach in achieving its’ strategic goals. It reflects
continued       global   economic    concerns      and
uncertainties regarding the stability of the global
economy, as well as industry and local factors that
will impact the demand for air service expansion. Of
specific relevance to HIAA is increased major project
investment associated with the Irving Shipbuilding
contract, the Maritime Link and continued offshore
exploration.       These projects are creating air
transportation opportunities in both domestic and
international markets while the Comprehensive
Economic Trade Agreement (CETA) will further
facilitate international cargo growth opportunities in
2018.
Capital investment in 2018 will focus on passenger experience improvements, utility infrastructure
replacement, airside surface restoration work and terminal infrastructure upgrades. The Air Terminal
Building (ATB) work will feature an expansion to create a larger Pre-Board Screening area capable to
accommodate new screening equipment to improve the flow of passenger processing. The airfield
restoration program will enter its second year, focused on maintaining the runways, taxiways and de-icing
areas. HIAA will also continue to invest in technology to enhance efficiencies with upgrades to Common
Use Terminal Equipment systems, parking applications and software and network security.
HIAA’s financial plan for 2018 focuses on moderate revenue growth, improved operational efficiencies and
strategic investments. Operating revenues are expected to grow by 2.9% compared to the 2017 forecast
with growth in both aeronautical and non-aeronautical revenue flows, driven by anticipated passenger
growth of 1.8% and additional service offerings within the terminal. Operating expenses are also expected
to increase over 2017 but at a moderate rate, resulting in an operating margin of 8.6%. The overall excess
of revenue over expenses is projected at $3.2 million that will be fully reinvested into the operations for
HIAA and capital investments.
2017 is anticipated to be a record year for the number of passengers at Halifax Stanfield and the budget
for 2018 anticipates this growth trend to continue, albeit at a slower rate with a projected overall passenger
increase of 1.8%. Advancement of HIAA’s hub strategy will continue to support growth as potential service
market expansion in both existing and new markets are aided by the anticipated deployment of the new
Boeing 737 MAX aircraft, operated by both Air Canada and Westjet.
HIAA’s expectations for aeronautical and non-aeronautical revenue growth opportunities are focused on
increased service to the community and the enhanced competitiveness of HIAA. This balanced approach
will continue to provide benefit to passengers, airlines and the approximately 5,700 employees working
within the airport campus while continuing to significantly contribute to the economy of the region.

                                                      4
Halifax International Airport Authority                    2018 Business Plan (Prepared in December 2017)
B STRATEGIC OVERVIEW
  MISSION, VISION AND VALUES
  HIAA’s mission and vision statements, as well as core values guide decision making, actions and behaviors.
  These statements were affirmed as part of the 5-Year Strategic Plan and the vision, mission and value
  statements for HIAA are as follows:

  STRATEGIC PRIORITIES
  There are four strategic priorities outlined in HIAA’s 5-Year Strategic Plan and used to build the 2018 Annual
  Business Plan. These key business strategies will help guide the organization in the execution of this Plan
  and     are       aligned    with     other      key    planning     documents      such      as     the   20-
  Year Master Plan and the 10-year Capital and Financial Plan. Progress towards achievement of these
  strategic priorities along with specific long-term metrics will be used to guide and measure performance in
  2018.
  In addition to the four strategic priorities, four critical foundation elements were identified that will support
  all strategic activities and help guide the airport towards achievement of its vision. The following diagram
  represents the relationship between these elements and their support of HIAA’s vision.

                                                                       Vision
                                                                    Great people creating
                                                                 the best airport community
                                                                        in the world

                                                                Strategic Priorities
                                      Air Service          Cargo Service         Non-Aeronautical       Maximizing
                                     Development           Development               Revenue         Airport Efficiency
                                                                                   Development
                                            Q
                                         Q
                                     Q

                                                               Foundation Elements

                                      Safety, Security and        Professional      Customer-First      Facility
                                    Environmental Excellence       Excellence          Culture        Development

                                                                             5
  Halifax International Airport Authority                                           2018 Business Plan (Prepared in December 2017)
C 2018 PLAN
  ECONOMIC OUTLOOK
  The global economy is continuing to strengthen with the IMF expecting global GDP to grow 3.6% in 2017
  and 3.7% in 20181, the strongest growth since 2011. Advanced economies continue to rebound to more
  moderate growth levels lead by Canada, Japan and Russia, with the UK slowing following Brexit and US
  growth more uncertain due to policy uncertainty. While mature economies in North America and Europe
  face lower expected growth rates, many emerging economies in Asia, South America, and Africa are
  projecting GDP growth rates above the global average. As emerging economies continue to grow and
  develop, air travel, and particularly international air travel, will become more viable to a wider range of the
  global population. The Chinese aviation industry saw the highest growth rate of any region at 10.6% in
  2016. 2
  Lagging inflation below established targets in most advanced economies, weak productivity growth, aging
  populations, and stricter fiscal policies all present downside risks to the economy. Geopolitical tensions,
  continued policy uncertainty in the US, and the unresolved renegotiation of North American Free Trade
  Agreement (NAFTA) have the potential to impact global markets and other trade agreements. However,
  commodity prices are expected to stabilize in 2018 after slight gains in 2017.
  Nationally, despite the strengthening Canadian Dollar, global demand should sustain Canadian exports in
  2018. Growth in Canadian GDP is expected to slow next year to 2.1% growth, impacted by a slower housing
  market, rising interest rates, and low wage growth, which could lower consumer spending. Other risk
  considerations include uncertainty with US policies and the outcome of NAFTA re-negotiations which could
  impact Canadian exports to the US. Over the medium-term, national GDP is forecast to average 2.2% per
  annum from 2017 to 2025.

  The overall economic outlook for Atlantic Canada in 2018 is one of modest growth with Newfoundland and
  Labrador declining, while Prince Edward Island experiences rapid growth. Nova Scotia and New Brunswick
  are expected to experience slower growth than the national average as consumer spending slows and
  provincial fiscal policies provide limited stimulus.

  A positive outlook remains for Atlantic Canada exports facilitated by strong economic growth in the US and
  potential impact of trade agreements with the EU, however, there is some offsetting risk stemming from the
  uncertainty surrounding the North American Free Trade Agreement (NAFTA) renegotiation. Seafood
  exports should continue to be a main driver of non-energy exports3 and present a positive opportunity for
  export cargo growth from the region due to the Canada-European Union Comprehensive Economic & Trade
  Agreement (CETA). Once fully enacted, CETA is expected to have a strong impact in Atlantic Canada as
  almost 96% of Nova Scotia seafood products into Europe will be duty-free. The first benefit of CETA was
  the removal of the 8% tariff from live lobster in September 2017.
  Population growth, albeit moderate, continues in Nova Scotia (0.6%) 4, contributing to consumer spending
  and housing starts. Tourism growth in Nova Scotia continues to contribute to demand for air services, with
  tourism visits by air up 11%, driven by Ontario (45%) and Western Canada (31%).5 Major project spending
  in relation to the shipbuilding project is expected to continue to contribute significantly to the economy. The
  national shipbuilding contract alone is expected to generate 11,500 total jobs and $500 to $600 million in
  wages for Nova Scotia, along with over $619 million in contracts awarded within the province to date.6

  1
    International Monetary Fund World Economic Outlook, October 2017
  2
    IATA, 2017
  3
    APEC, Atlantic Canada Economic Outlook 2018 – Fall 2017
  4
    APEC, Atlantic Canada Economic Outlook 2018 - Fall 2017
  5
    APEC, Atlantic Canada Economic Outlook 2018 – Fall 2017
  6
    Shipsstarthere.ca
                                                                6
  Halifax International Airport Authority                            2018 Business Plan (Prepared in December 2017)
Figure -1: Historical and Forecast Real GDP Growth, 2016-2018
                                                                                 Growth trends in the
                                                                                 Atlantic region as shown in
                                                                                 Figure 2-1 as per the
                                                                                 Atlantic Report.7 In 2017,
                                                                                 Nova Scotia was poised to
                                                                                 have      moderate       GDP
                                                                                 growth.      Nova       Scotia
                                                                                 growth will be supported by
                                                                                 investment spending of
                                                                                 offshore oil activity, mining,
                                                                                 and continued building of
                                                                                 Arctic Offshore Patrol
                                                                                 Ships. Newfoundland &
                                                                                 Labrador will see negative
                                                                                 growth rates in 2017 and
                                                                                 2018 due to completion of
major project spending and the impact of lower oil prices. Overall, New Brunswick growth will be positive
due to increases in project spending for renewable energy, transportation, and the Port of Saint John. Prince
Edward Island’s economy is expected to continue with the highest growth in the region due to increased
immigration, infrastructure and transportation projects, and continued growth in the bioscience industry.
In summary, global growth is projected to be sustained over the next couple of years due to a rebound in
commodity exporters. Air transportation is closely linked to the oil sector as it is a derived demand linked to
economic growth, and its costs are directly linked to fuel prices.

Aviation Industry Trends
The global aviation industry has shown continued resilience. In spite of bankruptcies, economic recessions,
health crises such as Ebola Virus Disease (EVD) and SARS, natural disasters and “polar vortexes”, global
air transport continues to grow.8 Passenger air traffic has grown in 9 of the last 10 years and IATA expects
global traffic to reach 7.8 billion over the next 20 years (3.6% per annum).9 This is due to the importance
of air service for global trade and commerce along with the increasing demand for tourism worldwide. The
industry is expecting an overall profit of $31.4 billion in 2017 with an operating margin of 4.2%. 10
The worldwide airline industry is valued at $776 billion with global load factors at a record high of 80%.11
Global passenger traffic is expected to increase to 4.0 billion in 2017. As a result, assuming industry
conditions remain consistent, the expectation is for an overall increase in industry profits for 2018. 12
The financial performance of airlines varies considerably by region, country and individual air carrier. The
key success factor in the North American aviation market is controlled and sustainable growth. With a 7.2%
expected profit margin in 2017, North America has been outperforming all other regions, accounting for
almost half of the global profit at $15.4 billion, as airlines focus on profitability through capacity
rationalization, consolidation of mature markets and the development of ancillary services. Together with
lower fuel costs, breakeven margins now average 56.5% in 2017. 13 This trend is expected to continue into
2018 as the US carriers continue to benefit from post-merger synergies. Air Canada profitability gains have
continued through the growth of its lower cost carrier Rouge, significant international route expansion, and
fleet modernization. WestJet has followed suit with the successful introduction of Encore across Canada
and expansion of international routes. While profitability has been strong, North American passenger traffic
growth lags behind the rest of the world with a projected expansion of 4.0% in 2017.14
7
  APEC, Atlantic Canada Economic Outlook 2018 – Fall 2017
8
  InterVistas Consulting Inc. – State of the Airline Industry, September 2014
9
  IATA, Press Release No. 55, 24 October 2017
10
   IATA, Press Release No. 30, 5 June 2017
11
   IATA, Economic Performance of the Airline Industry, June 2017
12
   International Air Transport Association (IATA)
13
   IATA, Economic Performance of the Airline Industry, June 2017
14
   IATA, Press Release No. 30, 5 June 2017
                                                                     7
Halifax International Airport Authority                                   2018 Business Plan (Prepared in December 2017)
A key trend that has emerged over the past several decades is the growth of international air traffic relative
to domestic air traffic. This trend is driven by globalization and the increasing accessibility of international
travel as a result of economic growth in emerging markets and the introduction of new aircraft technology.
Demand for international air travel is expected to continue to outpace domestic travel growth, impacting
market opportunities and air service routes. HIAA’s strategy is focused on international passenger and
cargo air traffic growth to Europe, the United States, and Asia as well as continued domestic growth with
additional hub activity.
Fuel continues to be a significant cost for the airlines and despite recent decreases, is projected to account
for approximately 25% to 30% of total airline operating costs.15 As market prices fluctuate along with other
economic drivers, airlines may adjust deployed seat capacity, which in turn impacts the airport business.
The recent decline in jet fuel prices has had an immediate and positive impact on the financial performance
of airlines, and is expected to continue as prices remain low. 16 An increase in air services and seat capacity
supports the financial health of airports by generating additional revenue opportunities (e.g. landing fees)
while a decline in seat capacity has the opposite effect. In 2017, passenger volumes and seat capacity
continued to grow during the year, with this growth expected to continue into 2018, albeit at a more
moderate rate.
The aviation industry is also focused on the deployment of new aircraft and the related market opportunities
they present. The new aircraft can offer lower costs, smaller capacities and longer ranges that could be
beneficial to smaller markets with the potential to create more non-stop routes. However, the shift from
smaller, less efficient turboprops and regional jets (less than 50 seats) to larger regional aircraft will result
in a fundamental change over the next 5 to 10 years for regional airports, including Halifax Stanfield, as
airlines consolidate routes and take on more point-to-point flying in order to optimize the use and cost profile
of the larger aircraft.
The Canadian market saw the entrance of an Ultra Low-Cost Carrier (ULCC) in 2016 with New Leaf (now
Flair), and it is expected that more ULCCs will consider entering the market moving forward. If successful,
the potential expansion of ULCCs in the Canadian market would have the effect of lowering average fares
and stimulating demand for air travel.
Overall, continued strength and improvement in the financial performance of the global aviation industry
will facilitate increased air service development, but regional consideration and specific air carrier
circumstances must be taken into account when assessing potential opportunities.
Halifax Stanfield International Airport
Passengers
Halifax Stanfield is served by 15 scheduled and charter passenger air carriers that provide direct service to
a network of 43 destinations, including 19 in Canada, 7 in the United States and 17 in international markets,
including Europe and the Caribbean. This network enables passengers within Atlantic Canada to access
over 500 one-stop destinations around the world.
In 2016, air passenger traffic at Halifax Stanfield reached a record setting 3.9 million enplaned/deplaned
(E/D) passengers and it is anticipated that HIAA will exceed the 4 million passenger milestone in 2017.
Passenger traffic growth throughout 2017 has been driven by seat capacity gains, and higher load factors,
particularly in the domestic sector. Passenger traffic is forecast to grow by 3.5% over the previous year and
a further 1.8% growth in 2018. Approximately 85% of passenger traffic is domestic, followed by 7%
transborder (US) and 8% international in 2017. With the highest air passenger per capita ranking in the
country, Halifax Stanfield punches well above its weight in air service availability; however, a finite
catchment area with limited population growth prospects presents longer term challenges for air travel
15
InterVistas, Halifax Stanfield Air Traffic Forecasts 2015-2035, May 2016
16
InterVistas, Halifax Stanfield Air Traffic Forecasts 2014-2034, July 2015
8
Halifax International Airport Authority 2018 Business Plan (Prepared in December 2017)expansion. To meet this challenge, the opportunity to strengthen and build upon its position as a hub airport
for Canada and a gateway to Europe is an important part of HIAA’s long-term strategy. Part of this
opportunity is the introduction of next generation narrow body aircraft, such as the Boeing 737 MAX, Airbus
A320neo, and Bombardier C-Series, on trans-Atlantic flights. Due to a prime geographic location, these
smaller jet aircraft, which have a suitable capacity for the Halifax market, have the range capabilities to
reach mainland Europe, the United Kingdom and Iceland.
Figures 2-2 and 2-3 show passenger traffic (actual and forecast) from 2012 to 2018 at Halifax Stanfield.
Year Domestic % Change Transborder % Change International % Change Total % Change
2012 2,882,198 0.9% 386,385 -5.7% 337,118 2.8% 3,605,701 0.3%
2013 2,872,553 -0.3% 383,986 -0.6% 329,325 -2.3% 3,585,864 -0.6%
2014 2,963,513 3.2% 376,449 -2.0% 323,077 -1.9% 3,663,039 2.2%
2015 3,042,188 2.7% 333,033 -11.5% 327,484 1.4% 3,702,705 1.1%
2016 3,268,485 7.4% 326,602 -1.9% 313,712 -4.2% 3,908,799 5.6%
2017F 3,445,498 5.4% 289,176 -11.5% 309,667 -1.3% 4,044,341 3.5%
2018F 3,491,228 1.3% 313,036 8.3% 314,075 1.4% 4,118,339 1.8%
Figure 2-2 Passenger Traffic by Sector (“F” denotes forecast passenger traffic as of October, 2017)
4,500,000
4,000,000
3,500,000
3,000,000
2,500,000
2,000,000
1,500,000
1,000,000
500,000
0
2012 2013 2014 2015 2016 2017F 2018F
Domestic Transborder International
Figure 2-3 - Overview Halifax Stanfield Passenger Traffic (“F” denotes forecast passenger traffic as of October, 2017)
Economic Development Potential
Halifax Stanfield’s dominant position in the regional airport market makes it a key catalyst for achievement
of some of the specific goals of the One Nova Scotia Report. The report established goals for increasing
the value of exports from $14 billion to $20 billion, doubling gross annual tourism revenues from $2 billion
to $4 billion and increasing annual immigration to 7,000 new residents, all by 2024. Maximizing the
connectivity, scale, efficiency and flexibility of operations at Halifax Stanfield will be required if these goals
are to be realized.
9
Halifax International Airport Authority 2018 Business Plan (Prepared in December 2017)HIAA’s airport operations are a critical infrastructure element and economic driver that can be leveraged to
help meet these goals. The annual economic impact for Halifax Stanfield was measured at $2.8 billion for
2016, a 4.4% increase over 2015.
Cargo
Air Cargo service out of Halifax Stanfield is shipped through two main modes, directly by designated air
cargo providers through the use of designated freighter aircraft, and secondly via the “belly” capacity in the
cargo/luggage holds of passenger aircraft.
Figure 2-4 – Air Cargo Traffic at Halifax Stanfield as of October, 2017
2016 was a record year with over 33,000 metric tonnes of goods moved through Halifax Stanfield. This
resulted in exports alone valued at more than $404 million for 2016. Seafood is a high value export for
Halifax Stanfield; seafood exports valued at $176 million were the largest single category of exports, with
$153 million of that volume being live lobster. The demand for seafood from Atlantic Canada continues to
be strong, especially in Asia and Europe. CETA will expand these export growth opportunities throughout
all of Europe. The rapidly growing Asian economy has helped create strong demand for Canadian seafood
and Halifax Stanfield’s cargo partners have successfully established the market and efficient air connectivity
into Asia. HIAA is working to diversify product exports, and has already seen strong exports in aerospace
parts and services of more than $74 million in 2016, and specialty related technology products in excess of
$42 million during the same year. The potential for new products and markets continues to be a focus for
HIAA.
Export values are showing increases of 6.75% as of the end of September 2017. Additional seasonal flights
in December will drive both categories (volume and export value) and will allow operators and freight
forwarders to test the various markets they serve and build potential business for year round service.
10
Halifax International Airport Authority 2018 Business Plan (Prepared in December 2017)2018 OBJECTIVES AND GOALS
The four strategic priorities for HIAA’s strategic plan are illustrated in the diagram below.
These strategic priorities along with long-term targets will be used to guide and measure performance in
2018. The goals and objectives established in this business plan ultimately support the execution of the
key business strategies and the achievement of the targeted financial results for 2018.
11
Halifax International Airport Authority 2018 Business Plan (Prepared in December 2017)HIAA has four foundation elements that are critical to undertaking the mission of HIAA and achieving its
vision. These are necessary to achieving the strategic priorities.
These elements are the core of our corporate culture and excelling at them is a critical part of fulfilling our
brand promise as Atlantic Canada’s gateway.
12
Halifax International Airport Authority 2018 Business Plan (Prepared in December 2017)FINANCIAL PLAN
The following section provides supporting data for the 2018 Business Plan’s operating and capital budget.
It reflects the financial impact of HIAA’s plans to achieve its strategic priorities through its goals, objectives
and initiatives.
The financial plan for HIAA is summarized as follows:
Revenue
The revenue forecast for 2017 is slightly higher than budget driven by higher passenger and landed seat
capacity levels. Aeronautical revenue growth was driven by increased service in the domestic sector which
was partially offset by continued reductions in transborder traffic and international traffic related to slight
reductions in international markets with later starts to summer seasonal services. Seat capacity levels are
expected to continue to grow in 2018 with increases related to the domestic market, anticipated growth in
the European market and increased transborder service. These increases are anticipated to be partially
offset by reductions in sun flight capacity with international markets.
Considering the forecast for 2017 and the implementation of initiatives included in the annual plan, the 2018
budget projects total revenue of $105.5 million. This result is comprised of operating revenue at $64.7
million, an increase of 2.9% over the 2017 forecast and the Airport Improvement Fee (AIF) revenue budget
of $40.9 million. The projected AIF growth is mainly driven by rate changes, effective January 1, 2018,
increasing the departing enplaned passenger fee from $25.00 to $28.00 and is partially offset by the
introduction of an intra-provincial AIF of $15.00 per departing enplaned passenger.
2018 Total Revenues = $105.5M
AIF Aeronautical
38.6% 29.1%
$40.9M $30.7M
Non
Aeronautical
32.3%
$34.0M
Parking
Other 14.1%
5.4% Concessions $14.9M
$5.6M 12.8%
$13.5M
Utilizing published airline schedules, InterVISTAS aviation forecasts, and other related information available
as of November 2017, total Halifax Stanfield passenger traffic for 2018 is budgeted to increase from the
2017 forecast levels by 1.8%, driven by increased load factors and expansion of domestic and international
hub activity. Non-aeronautical revenue is budgeted to increase by 4.0% in 2018 over the 2017 forecast
driven in part by increased passengers and increased service offerings in the ATB.
13
Halifax International Airport Authority 2018 Business Plan (Prepared in December 2017)Expenses 2018 Total Expenses = $100.6M
Total expenses for 2018, excluding
defined benefit pension plan losses, are
Interest
budgeted to be $100.6 million. The 15.1%
$15.2M
operating expenses for 2017 are Depr/Amort
estimated at $59.2 million representing an 26.0% Operating
$26.2M Expenses
increase of 4.2% or $2.4M over 2017 58.9%
$59.2M
forecasted results. The largest category
for expense increases over 2017 is
amortization which is driven by the capital
investment to maintain and improve the
airport facilities.
Total interest to be paid in 2018 on HIAA’s Series A and Series C bonds at annual fixed rates of 5.503%
and 4.888% respectively is $14.9 million.
Capital Program
Estimated capital investment program expenditures for 2018 total $53.0 million and include a terminal
expansion initiative which will create a larger Pre-Board Screening area capable of accommodating new
equipment and improving the efficiency of passenger processing. The Passenger Experience
Improvements project will continue with upgrades to washrooms and with architectural improvements
throughout the terminal. On the airfield, the second year of the multi-year restoration program will continue
with work planned on Taxiway and deicing pad areas. The first year of a two-year program to implement
Runway End Safety Areas (RESA) will be begin. Capital projects within the ATB include the replacement
of the central chiller plant.
Technology infrastructure improvements include continued upgrades to corporate Information Technology
systems, Common Use Terminal Equipment systems, and Parking Applications and Software. An increased
focus will be placed on developing strategies to leverage airport data and analytics to improve operational
efficiency enhancing the network security program.
The ground floor Pre-Board Screening (PBS) is being expanded to provide space for additional passenger
processing capacity. This expanded ground floor footprint will provide new space for passenger processing,
additional second floor holdroom space, and provide additional concession space for both groundside and
the domestic holdroom areas. Construction will continue throughout 2018.
The Passenger Experience Improvement (PEI) program will continue with upgrades to washrooms in the
airside and groundside areas of the terminal. New architectural finishes will be completed in the Domestic
Arrivals area and in the Food Court area of the Centre Core. A number of improvements to lighting and
furnishings will be made throughout the ATB.
The central chiller plant is nearing the end of its serviceable life and is expensive to operate. It will be
replaced with a new, energy efficient plant that is designed to accommodate additional cooling loads related
to foreseeable ATB expansions in the areas of the terminal served by the existing system.
14
Halifax International Airport Authority 2018 Business Plan (Prepared in December 2017)Capital Projects Airside focus on the runway restoration program among other projects. HIAA has
developed an Airfield Pavement Management System which assesses the condition of airfield surfaces and
identifies measures necessary to ensure the continued integrity of the airfield infrastructure. Pavement on
sections of Taxiway Alpha and the area surrounding the deicing pads will be restored in 2018.
Information technology will also be a focus for the 2018 capital plan. Improvements to the IT systems will
be completed with four main areas of focus categorized by: Business Continuity and Disaster Recovery;
Physical and Data Security Systems; Airline Common Use & Passenger Processing; and Transformative
Technologies. Within these key areas there is an emphasis of continuing to grow and expand self-service
technologies and adopting IT best practices for risk management, network security, and infrastructure
design.
The IT program will also include a refresh of the parking system. The software system along with the
associated physical hardware for the paid parking lots is being replaced and upgraded with a new system
that provides significantly enhanced capabilities in a number of areas.
The balance of the capital funding requirements for 2018 consists of minor capital projects categorized as
new initiatives, minor works, capital acquisitions and mobile equipment.
15
Halifax International Airport Authority 2018 Business Plan (Prepared in December 2017)FINANCIAL SCHEDULES
PROFORMA BALANCE SHEET
(in thousand of dollars)
Year Ended December 31
2018 Budget 2017 Forecast
$ $
ASSETS
Current
Cash and cash equivalents 1,077 5,267
Accounts receivable 5,550 5,430
Other 2,012 1,973
Total current assets 8,639 12,670
Capital assets, net 7,427 7,427
Debt Service Reserve Fund 425,177 398,410
Accrued benefit asset 8,769 9,223
450,012 427,730
LIABILITIES AND EQUITY
Current
Accounts payable and accrued liabilities 24,797 23,014
Current portion of long-term debt 17,000 -
Deferred revenue 845 815
Total Current Liabilities 42,642 23,829
Long-term debt 283,476 283,448
Security deposits 1,760 1,560
Total Liabilities 327,878 308,837
Equity in capital assets 122,134 118,893
450,012 427,730
16
Halifax International Airport Authority 2018 Business Plan (Prepared in December 2017)PROFORMA STATEMENT OF OPERATIONS
AND CHANGES IN EQUITY
(in thousand of dollars)
Year Ended December 31
2018 Budget 2017 Forecast
$ $
REVENUE
Terminal and passenger security fees 20,650 20,096
Parking 14,866 14,177
Concessions 13,519 13,051
Landing fees 10,059 10,118
Rental 4,552 4,368
Other 1,033 1,054
64,679 62,864
Airport improvement fee 40,858 36,204
105,537 99,068
EXPENSES
Salaries, wages and benefits 23,282 22,245
Amortization 26,233 24,098
Materials, services and supplies 21,288 20,220
Interest on long-term debt, net 15,212 14,770
Ground lease rent 7,361 6,733
General and administrative 5,585 6,026
Property taxes 1,593 1,551
100,554 95,643
Excess of revenue over expenses before pension plan (loss) gain 4,983 3,425
Defined benefit pension plan (loss) gain (1,822) 1,700
Excess of revenue over expenses for the year 3,161 5,125
Equity In capital assets, beginning of year 118,893 113,688
Equity in capital assets 122,054 118,813
Amortization of deferred financing costs 80 80
Equity in capital assets, end of year 122,134 118,893
17
Halifax International Airport Authority 2018 Business Plan (Prepared in December 2017)PROFORMA STATEMENT OF CASH FLOWS
AND CHANGES IN EQUITY
(in thousand of dollars)
Year Ended December 31
2018 Budget 2017 Forecast
$ $
OPERATING ACTIVITIES
Excess of revenue over expenses for the year 3,161 5,125
Add (deduct) items not affecting cash
Amortization 26,233 24,098
Accrued benefit asset 454 (3,442)
Net change in non-cash working capital balances
Related to operations 1,962 (550)
Cash provided by operating activities 31,810 25,231
INVESTING ACTIVITIES
Expenditures on capital assets (53,000) (40,000)
Cash used in investing activities (53,000) (40,000)
FINANCING ACTIVITIES
Proceeds from term credit facility 17,000 -
Cash used in financing activities 17,000 -
Net decrease in cash during the year (4,190) (14,769)
Cash and cash equivalents, beginning of year 5,267 20,036
Cash and cash equivalents, end of year 1,077 5,267
18
Halifax International Airport Authority 2018 Business Plan (Prepared in December 2017)You can also read