RPC GROUP PLC 2018 / 19 INTERIM RESULTS - 28 November 2018
←
→
Page content transcription
If your browser does not render page correctly, please read the page content below
RPC – THE ESSENTIAL INGREDIENT

                          RPC GROUP PLC
                          2018 / 19 INTERIM RESULTS
                          28 November 2018

1
                                                © 2018 RPC Group Plc. All Rights Reserved.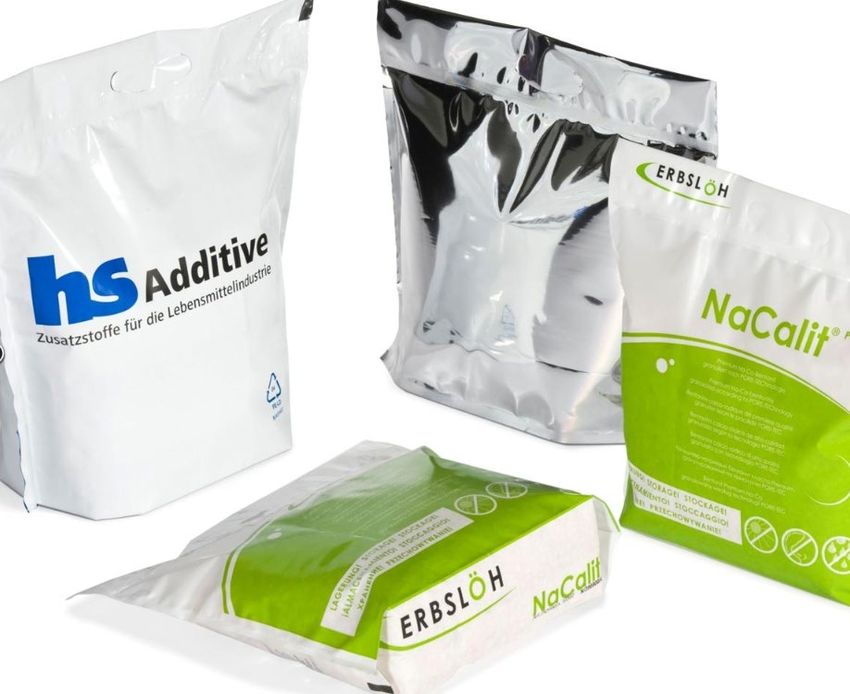
First half year highlights 2018 / 19

       Adjusted operating profit and statutory            Healthy innovation pipeline with
       profit (after tax) ahead of last year with         sustainability and e-commerce trends
       good organic profit growth                         providing opportunities

                                                          Bolt-on acquisitions of PLASgran and
       Robust cash flow performance with
                                                          Nordfolien completed; Letica
       significant investment in growth projects
                                                          Foodservice (paper) sold

       Continued underlying organic growth at             Returned £99m to shareholders through
       3.2% with significant growth again in              share buyback and dividend (26th
       China                                              consecutive year of growth)

2
                        Good overall progress made on Vision 2020 strategy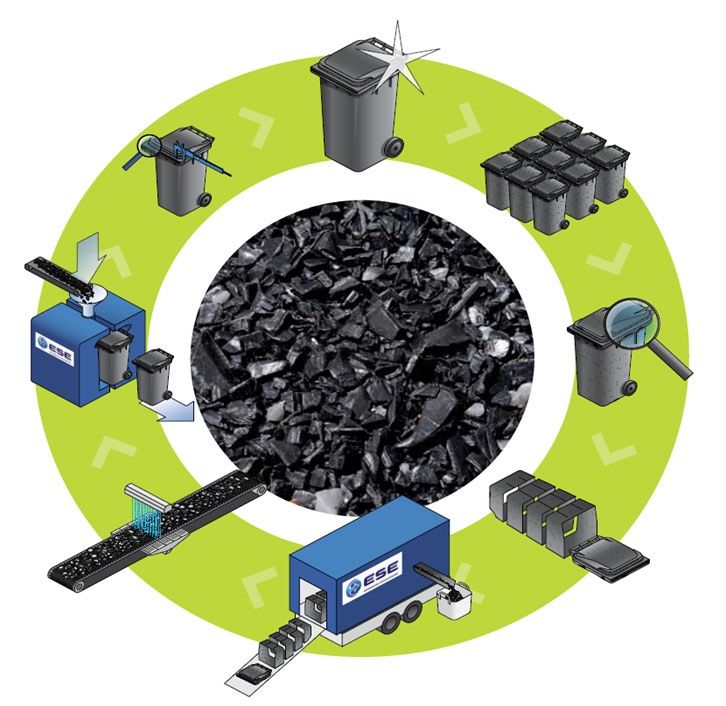
AGENDA

    1. Business overview
       Organic growth
       Sustainability
       Product development
       M&A

    2. Financial Review
    3. Summary and Outlook

3
Business overview: Organic growth

4

Organic growth
    In the first six months of 2018 / 19

        Overall organic growth of 3.2% reflecting improved activity levels in both the packaging
        and non-packaging markets

        Significant growth in China and US with more moderate growth in Europe

        Ongoing investment in innovation capabilities and manufacturing footprint driving a
        healthy pipeline going forward

5
                               Continuing to deliver GDP+ growth
Organic growth
Segmental development
Food Non-food Technical Components
£553m H1 18 / 19 £501m H1 18 / 19 £315m H1 18 / 19
+1.9% Organic growth +2.8% Organic growth +7.3% Organic growth
Key developments Key developments Key developments
RPC: good overall growth moderated RPC: strong growth in tobacco sector RPC: strong tool sales accompanied
by the hot summer impacting partially offset by weaker agrochemical by growth in roto moulded products,
agricultural film sales sales waste management and specialist
automotive products (China)
Market: important growth drivers are Market: growth driven by innovation in
minimising food waste with sustainable product design in the various market Market: good growth markets for
designs gaining importance segments specialist automotive components and
waste management systems
Outlook: ongoing growth with Outlook: continued growth in
sustainability trends creating higher innovative product areas whilst Outlook: good growth in the various
added value opportunities focusing on margin enhancement in higher added value platforms,
more mature market segments particularly with the focus on new
waste management systems in Europe
6
Organic growth
Segmental development (continued)
Personal Care Beverage Healthcare
£246m H1 18 / 19 £191m H1 18 / 19 £86m H1 18 / 19
+4.2% Organic growth (0.3)% Organic growth +4.3% Organic growth
Key developments Key developments Key developments
RPC: increased activity levels in both RPC: coffee capsules back to growth RPC: increased growth as new
US and China driving good growth tempered by weaker vending sales and products sales start to accelerate
customer delays in the roll-out of the
Market: key to growth are excellence sport caps and CSD lite closures Market: dry powder inhalant devices
in design & engineering and set for longer term growth particularly
globalisation Market: growing demand for higher in Western markets
added value closures and single serve
Outlook: well positioned for further beverage capsules Outlook: good growth prospects due
growth through the leveraging of to the enhanced healthcare platform
RPC’s global platform and innovative Outlook: good growth in single serve following the Plastiape acquisition
product portfolio beverage systems, Wave Grip and
higher added value closures
7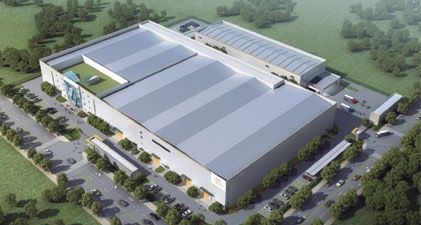
Business Overview: Sustainability

8

Sustainability
        Regulatory update

    •   October 2018 UK Government announced a
        consultation to introduce a tax on any plastic packaging    RPC works proactively with the relevant
        with less than 30% recycled content                         policy makers, authorities and industry
                                                                    bodies. Through the British Plastics
    •   October 2018 EU Parliament approves a directive on          Federation, RPC is involved with the
        single use plastics. Targets a reduction in marine litter
        through better control of and charges on single use         UK Plastics Pact which has set
        plastics                                                    ambitious targets for increased
                                                                    recycling
    •   August 2018 UK Treasury publishes responses to its
        call for evidence; use tax to increase demand of
        recycled plastics, encourage design led sustainability,
        consult on the banning of plastic-stemmed cotton buds,
        plastic coffee stirrers and plastic straws
                                                                     Although we await the final directive
    •   April 2018 UK Government announced a consultation
        on the ban of plastic straws and cotton buds in the UK      RPC does not manufacture any of the
                                                                    items that are expected to be banned
    •   March 2018, UK Government announced a
        consultation on a deposit return scheme for England

9
                                     Sustainability focus is an opportunity for RPC
Sustainability
         An opportunity for RPC

       Innovative design solutions            On-site recycling facilities              Recycled and sustainable
     • Recycled content, recyclability,                                                     input polymers
                                          •   Acquired PLASgran, a best-in-
       reuse are fast becoming a pre-         class UK based plastic waste            • Making products incorporating
       requisite as the legislative           recycler, in August 2018                  recycled materials and products
       landscape moves towards these
       things being a legal requirement   •   RPC bpi is a leading recycler of          made from biopolymers
     • RPC uniquely placed to help            flexible plastics closing the end of    • Working with major material
       customers given its design and         life loop in agricultural, commercial     suppliers to incorporate more
       engineering capabilities               and industrial solutions                  recycled content in our products
     • Anticipate more sustainable        •   ESE growing through the need to         • Continuing to develop ideas such
       designs but not a move back to         enhance waste management to               as coffee capsules made from
10     other materials given plastics         increase recycling as well as avoid       compostable polymer
       unique advantages                      litter and plastic leakage into the
                                              environment
Business overview: Product development 11
Product development: investment in innovation
     A suite of new sustainable products

12
             Commercialising new products with high sustainability profiles
Selected product development
Nano fibers CSD Lite
Development of next Patented development of
generation plastics with a ultra-light CSD caps. 20%
wide range of benefits lighter without any reduction
suitable for many applications in performance
Award winning sports caps1 WaveGrip
Combines functionality and Multi-packing solution for the
reusability with product safety. global beverage market.
180 degree hinge that is easy Available for both aluminium
to open with integrated cans and PET bottles with
tamper evidence which also advanced, state of the art
reduces plastic waste automation solutions
13
1 Sustainable Plastic Packaging Awards November 2018: PackTheFutureSelected product development (continued)
Roll-on ball PET Conversion
Development of best- Disruptive technology
in-class component enabling conversion to
supported by in-house plastic for niche
technology innovation applications across
consumer and industrial
markets
Booster S Vessel
Next generation trigger Potential disruptive
spray with patented innovation for active
pump system, ingredients that
applicable for foams preserves active
and fluids. Compatible ingredients until the
with many existing moment of
14 ranges consumptionProduct development
Circular economy trends in Europe driving opportunities for ESE
• ESE has more than 25 years experience in the use of
recycled materials
• ESE has targeted products manufactured with 100%
recycled material
• Markets growth driven by the need to enhance waste
management to avoid litter and plastic leakage into the
environment
• Enhanced product range through having roto moulding
capabilities within the Group
15
Growth of recycled contentProduct development
Capital expenditure supporting future growth
Examples of capital expenditure in period
Greenfield extension of China manufacturing footprint currently at
near full capacity
Global project supporting products for Johnson & Johnson’s baby
brand
Launch of patented innovative trigger spray: Booster S
Expansion of high added value film capacity in Western Europe
Expansion of capacity in North America for personal care products
Continued global roll-out of sports cap closures and CSD Lite
16
Growing our customer proposition and increasing manufacturing capacityM&A: A disciplined approach 17
M&A: A disciplined approach
             PLASgran acquisition: sustainability focused

     •       Fast growing and leading UK plastic waste recycler, specialising in
             compounding of rigid plastics

     •       Focused on added value solutions – enabling lower grade feedstock to be
             compounded and upcycled to displace virgin quality materials

     •       Enables RPC to offer customers the option to incorporate recycled materials
             into products

     •       Synergies available through capturing and processing RPC’s own rigid scrap
             volumes

     •       Closing the recycling loop at an attractive price

18                                        RPC is a leading recycler in Europe with sales of > £100m*

     * Includes existing sales of recycled plastic films
M&A: A disciplined approach
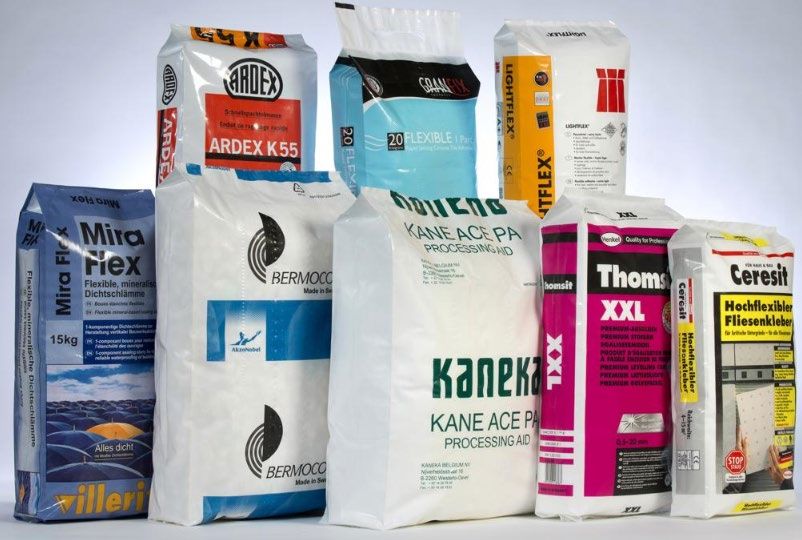
Nordfolien acquisition: geographic expansion for flexibles
• Specialist in flexible industrial packaging serving
the construction, chemicals, horticultural and
industrial food sectors
• Two well invested manufacturing locations, in
Germany and Poland
• Strategic extension of bpi indupac SBU into both
Western and Eastern Europe
19 Consolidating an added value films segment in EuropeM&A: A disciplined approach
Non core business update
Businesses for sale Key rationale for sale Status
• Letica Foodservice (US) • Primarily paper based business • Sold for $95m
• Spirits closures • Primarily metal based business • Process advanced
• European IM# automotive business • Sub scale market share • Process started
Packaging* Non-packaging*
Existing Non-core Existing
Non-core
business businesses business
businesses
£3,019.0m £139.6m £519.4m
£69.7m
20
# injection moulding
*In FY 2017 / 18Financial Overview 21
Income statement – continuing operations

                                                  H1 2018 / 19          H1 2017 / 18                FY 2017 / 18
                                                        £m         %       £m        %       Δ          £m       %

     Revenue                                        1,892.0             1,770.0            6.9%     3,538.4

     Adjusted operating profit                        214.3      11.3    208.7     11.8    2.7%      414.3     11.7

     Adjusted interest charge                         (25.8)              (15.7)          (64.3)%     (35.9)

     Adjusted profit before tax                       188.9      10.0    193.5     10.9    (2.4)%    379.1     10.7

     Adjusting items                                   (4.5)               (6.4)          29.7%       (15.1)

     Amortisation of acquired intangible assets       (25.5)              (24.8)           (2.8)%     (49.6)

     Adjusting net financing costs                     (4.5)               (0.6)          (650)%       (3.5)

     Taxation                                         (35.3)              (44.1)          20.0%       (63.7)

     Profit after tax                                 119.1              117.6             1.3%      247.2

     Adjusted basic earnings per share                 35.4p              35.0p            1.1%       69.7p

     Statutory earnings per share                      28.9p              28.4p            1.8%       60.0p

     Return on capital employed %                     14.7%               15.3%           (60)bps     14.9%
22
Continuing operations revenue bridge (£m)
3.2%
59
12 60
(9)
Impact FX translation Polymer price Net acquisitions Organic growth
(prior year revenue)*
1,770 1,773 1,892
Revenue Underlying Revenue
H1 2017 / 18 revenue H1 2018 / 19
H1 2017 / 18
23
Organic growth
* Includes FX translation loss of £(1)mContinuing operations adjusted operating profit bridge (£m)
£12m profit
improvement
32 (20)
(1) 2
(8)
209 214
200
Adjusted FX Polymer Underlying Net Business Cost inflation Adjusted
operating translation pass through operating acquisitions improvement operating
profit variance profit (prior year profit
H1 2017 / 18 H1 2017 / 18 profit) H1 2018 / 19
24Polymer price changes passed through to the customer base
Adverse £10m polymer passthrough time lag in H1
€ PER TONNE: average of Platts / ICIS indices £ PER TONNE: average of Platts / ICIS indices
1,750 Mainland Europe 1,400
UK
1,650 1,300 impacted by weakened sterling
1,550
1,200
1,450
1,100
1,350
1,000
1,250
900
1,150
1,050 800
Mar 14 Sep 14 Mar 15 Sep 15 Mar 16 Sep 16 Mar 17 Sep 17 Mar 18 Sep 18 Mar 14 Sep 14 Mar 15 Sep 15 Mar 16 Sep 16 Mar 17 Sep 17 Mar 18 Sep 18
PP HOMO HDPE BM
$ PER TONNE: per IHS
• Polymer pass-through mechanisms in place (based on c. 65
2,400 US
indices) albeit with a time lag
2,200
• Proactive raw material stock and purchase contract
2,000 management mitigating the pass through time lag effect
1,800 • Flexibility in purchasing various polymer grades for similar
1,600 applications
1,400
• Purchase more than 1,000 different grades of polymer resin
1,200
Pass through time lag impact
Mar 14 Sep 14 Mar 15 Sep 15 Mar 16 Sep 16 Mar 17 Sep 17 Mar 18 Sep 18
£ million FY14/15 FY 15/16 FY 16/17 FY 17/18 HY 18/19
25
P&L impact 9 11 (3) (9) (10)Underlying cash generation - continuing businesses
Interims Finals
£ million 2018 / 19 2017 / 18 2017 / 18
• Ongoing investment in growth; total capex
Adjusted EBITDA 299 287 574
to sales of 5.7% (Capex / depreciation of
Working capital (7) 24 (26) 1.3x)
Net capex (100) (103) (233) • Working capital investment in period
Other* (2) (1) (1) supporting added value growth
Operating cash flow 190 207 314 • Seasonal reduction in agricultural stock
Net interest & tax (47) (40) (96)
• Working capital is at 6.5% of sales, in line
with the 2017/18 year-end
Free cash flow 143 167 218
• Cash flow conversion and working capital
Adj. conversion** 89% 99% 76% efficiencies remain strong
Statutory conversion# 90% 99% 69%
26
* Share based payments, disposal of fixed assets and pension deficit payments
**Ratio of operating cash flow shown above to adjusted operating profit
# see Appendix page 46Net debt bridge
Free cash flow £143m
(1,139) Returned £99m to (1,181)
shareholders
(7)
299 (100)
(47) (2) 71
(91) (17)
(82) (7) (45) (14)
Net Debt Adjusted Working Investing Interest Other free Acquisitions Disposals Share Dividends Adjusting FX Other* Net Debt
Mar 2018 EBITDA Capital Activities & Tax cashflow (inc. debt) buyback items movement Sep 2018
items#
27
# Share based payments, disposal of fixed assets and pension deficit payments
* Includes non-underlying cash provision movements: £5m, movement in provisions and financial instruments: £(1)m, cashflow from discontinued items £3m, payment to Nordfolien ex-shareholders £6mFinancial position
KPIs Sep 2018 Renewal date main facilities
£m
1,500
Net debt (£m) 1,181
1,250
Headroom (£m) 827 1,000
RCF
*
750
TERM
USPP RCF
Net debt to EBITDA ratio (pro forma)** 2.0x
500
USPP
250
Net debt to EBITDA covenant 3.5x
0
2018 2019 2020 2021 2022
Calendar year
28
*The 18 month term facility is extendable up to 2020 if required
**Adjusted to include acquisitions on a pro forma basisCapital allocation priorities
Capital priorities and structure
Profitable organic Acquisitions that Progressive Non-core Leverage to remain
growth meet strict dividend policy with businesses at a suitable and
investment criteria dividend cover at identified responsible level
2.5x through the
cycle
Investing in organic 23 acquisitions since H1 18/19 DPS of Letica Foodservice H1 18/19 net debt to
growth and returns launch of Vision 8.1p, up 4% and disposed in period EBITDA ratio remains
ahead of WACC 2020; demonstrating representing the 26th and processes for the at target levels of 2.0x
Targeting through the excellent returns well consecutive year of other businesses (pro forma)
cycle organic growth above WACC growth underway Covenant 3.5x
ahead of GDP EBITDA
29Summary and Outlook 30
Summary and Outlook

     A good trading        A robust cash flow     Remain excited by      The Group is well       We continue to
     performance over      performance whilst     the many               placed to benefit       target through the
     the last six months   investing for future   opportunities to       from the                cycle profitable
     leading to good       higher value growth    further develop both   development             underlying organic
     profitable organic                           organically and        opportunities driven    growth ahead of
     growth                                       through acquisitions   by globalisation and    GDP
                                                                         recent sustainability
                                                                         and e-commerce
                                                                         trends

31
Supplementary Material 32
Appendices         Polymer passthrough mechanism
                   Polymer capacity expected to increase
                                        Benefits of plastic
                                     Circular grading tool
                                      Technical guidance
                  Continuing operations – restated results
                    Segmental and geographical analysis
                              Consolidated balance sheet
                                          Adjusting items
                                       Employee benefits
                                      Statutory cash flow
                           Adjusted earning reconciliation
                       Alternative performance measures
33
                                               Definitions
Polymer pass-through mechanism
Illustrative example
• Contracts with a ‘pass-through’ clause provide
Polymer headwind Polymer tailwind for the regular re-set of sales prices according
to movements in polymer prices
• Good track record of pass-through to
customers
• Sales prices will ‘catch up’ with polymer price
movements, but with a time lag
• In times of rising prices, there will be a profit
headwind due to the purchase price being
current but revenue being based on prices from
previous periods
• In times of falling prices, there will be a profit
tailwind
• Contractual pass-through clauses in place with
Time
re-set taking place typically every 3-4 months
Purchase price Sales price
34Polymer capacity expected to increase
Global capacity utilisation polymer industry
TONNES (M) PP and PE OPERATING RATE %
255 100%
• Capacity continues to grow and outpace
240 demand
95%
225
• Ability to source from outside Europe will
210 90% become a key competitive advantage
195 • RPC’s scale, extensive network and flexibility
85%
180 provide a leading position from which to access
global markets
165 80%
• Key capacity additions are North America and
150
75% Middle East, both targeting exports as markets
135 globalise. China will look to become self-
120 70% sufficient in PP, freeing capacity for other
2013 2014 2015 2016 2017 2018 2019 2020 2021 geographies
Operating rate Actual demand Free capacity Forecast demand
Source: IHS Markit
35
RPC’s European operations are well placed to take advantage of global marketsSustainability
Continued benefits of plastic vs. other packaging materials
The attractions of rigid and flexible plastic packaging versus alternative
Substitution examples
packaging materials continue to include:
● Light weight: Reducing transport costs of packaged goods Special T:
Replacement of aluminium to
● Strength and durability: Ideal for effective product protection extend the retail platform
● Versatility: Can be moulded or formed into just about any shape –
NordiVent:
enhanced marketing opportunities and transport efficiency
Paper replacement; superior
● Low carbon: Less energy used and less carbon emitted during the solution for packaging powders
production process
Overmoulded components:
● Recyclability: Over 90% of plastic based products currently on the UK
Integrating plastics with electronics
market are recyclable – those that are not are where plastics are combined through a single process, reducing
with other materials e.g. foil laminates metal components
Empress jar:
● Sustainability: Ability to reduce food waste through extending the shelf-life
of both fresh and processed food Glass replacement; premium design
and decoration, lightweight and
shatterproof
● Speed-to-market: Rapid prototyping; standard moulds and premium
decoration
LongLife™:
36 ● Convenience: Easy to handle, safe handling, portion control, re-closable, Customised packaging solutions
microwavable with oxygen barrierSustainability Trends
The RPC Circular grading tool
The feather symbol shows that the The arrow symbol shows the pack The circle symbol shows that the
pack is light-weighted and has contains a % of recycled plastic pack has an obvious reuse
been designed to incorporate the
minimum amount of material
A The blue indicator shows the rating that
B B the concept has achieved as measured
against the RecyClass definitions
Rating system based on the
C
D
“RecyClass” categories. A is the
highest rating which indicates
perfect for recycling and F means
no part of the pack can be
recycled.
E
F
37
The tool is applied to new designs and is used to rate and improve existing productsSustainability
Circular Grading Tool in Action: Redesign of Westland lawn spreader
Before After
Number of parts: 9 Number of parts: 3
● Redesigned by RPC
● 40% lighter pack Oct 17
● Easier to recycle
– Increase in RecyClass grading from D to C
Product launched ready for the
● No change in functionality spring season in 2018
38 ● Easier to manufacture
● Cross-divisional collaboration (Promens and M&H)Technical guidance FY 2018 / 19
Profit & loss charge Cash charge
Tangible fixed assets Depreciation: c. £175m Capex: c. £250m
Underlying items IFRS 16 In the process of a formal impact assessment of IFRS 16 which we expect will be material
Net contract provision utilisation c. £10m N/a
Underlying tax rate c. 23% Below P&L charge
Net finance costs c. £52m c. £52m
• €1c move changes EBIT by c. £2.0m
FX sensitivity:
• $1c move changes EBIT by c. £0.5m
Progressive dividend policy with cover
Dividends N/a
targeted to be 2.5x across the cycle
Adjusting items
Acquisition related expenditure External cost on acquisition activity
Net integration and adjusting items Not material Not material
Amortisation – acquired intangibles c. £50m N/a
Other adjusting items Not material Not material
Adjusting net finance costs Pension scheme interest c. £4m N/a
39Continuing operations – restated results
£ million 2017 / 18 2016 / 17 2015 / 16 2014 /15
Revenue 3,538 2,648 1,586 1,216
Finals EBITDA 574.0 426.7 244.7 187.4
Finals
EBIT 414.3 297.1 168.9 131.4
Free cash flow 218.0 234.6 117.3 50.6
Adjusted operating cash conversion 75.8% 97.4% 86.7% 60.4%
2017 / 18 2016 / 17 2015 / 16 2014 /15
Revenue 1,770 1,178 776 589
EBITDA 287.3 190.9 117.0 86.9
Interims
Interims
EBIT 208.7 130.5 80.2 60.9
Free cash flow 166.8 115.2 53.4 20.2
40
Adjusted operating cash conversion 99.0% 109.3% 80.7% 52.5%Segmental and geographical analysis
Interims % Finals
At constant
£ million 2018 / 19 2017 / 18 Variance exchange 2017 / 18
Revenue
Packaging 1,620 1,518 6.7 7.2 3,019
Non-packaging 272 252 7.9 8.9 519
Total 1,892 1,770 6.9 7.5 3,538
Operating profit
Packaging 175.6 171.3 2.5 2.4 338.1
Non-packaging 38.7 37.4 3.5 4.5 76.2
Total 214.3 208.7 2.7 2.8 414.3
Return on sales
Packaging 10.8% 11.3% (50)bps (50)bps 11.2%
Non-packaging 14.2% 14.8% (60)bps (50)bps 14.7%
Total 11.3% 11.8% (50)bps (50)bps 11.7%
41
• Both packaging and non-packaging continue to grow with sales mix and polymer price passthrough lag affecting
return on salesSegmental and geographical analysis (continued)
Interims % Finals
At constant
£ million 2018 / 19 2017 / 18 Variance exchange 2017 / 18
Revenue
Europe 1,471 1,402 4.9 4.8 2,802
Rest of the world 421 368 14.3 17.6 736
Total 1,892 1,770 6.9 7.5 3,835
Operating profit
Europe 158.3 158.4 (0.1) (0.1) 320.3
Rest of the world 56.0 50.3 11.4 14.5 94.0
Total 214.3 208.7 2.7 3.4 414.3
Return on sales
Europe 10.8% 11.3% (50)bps (50)bps 11.4%
Rest of the world 13.3% 13.7% (40)bps (40)bps 12.8%
Total 11.3% 11.8% (50)bps (40)bps 11.7%
42
• Strong revenue growth by regionConsolidated balance sheet
£ million SEP 2018 SEP 2017 MAR 2018
Property, plant and equipment 1,382.4 1,327.2 1,357.1
Goodwill 1,618.9 1,602.5 1,575.7
Other non-current assets 445.3 492.9 444.7
Working capital 248.7 200.2 239.7
Employee benefit liabilities (LT) (166.6) (240.7) (196.9)
Provisions, including deferred consideration (78.7) (131.0) (90.6)
Other assets & liabilities (312.3) (315.7) (276.7)
Assets held for sale 27.0 - 6.3
Net debt (1,180.6) (1,070.4) (1,139.2)
Total equity 1,984.1 1,865.0 1,920.1
43Adjusting items (see Appendix page 49 for definitions)
Interims Finals
£ million 2018 / 19 2017 / 18 2017 / 18 2016 / 17
Acquisition related expenditure 0.9 2.1 3.9 18.9
Deferred consideration on earn-outs 0.1 1.1 (11.5) (11.2)
Promens / GCS / BPI integration costs - 10.2 20.6 62.4
Other integration and adjusting items 3.1 (7.6) 0.9 9.7
Acquisition and restructuring items 4.1 5.8 13.9 79.8
Amortisation – acquired intangible assets 25.5 24.8 49.6 30.0
Other adjusting items 0.4 0.6 1.2 1.0
Total adjusting operating items 30.0 31.2 64.7 110.8
Adjusting finance costs 4.5 0.6 3.5 15.2
Total adjusting items before tax 34.5 31.8 68.2 126.0
44Employee benefits
£ million SEP 2018 SEP 2017 MAR 2018
Retirement benefit liability UK DBs 64.9 141.1 95.8
Other retirement benefit obligations 98.0 95.3 97.1
Termination benefits 0.6 0.7 0.7
Other employee benefit liabilities 3.1 3.6 3.3
Total employee benefit liability 166.6 240.7 196.9
• Improving discount rates plus deficit reduction payments have reduced the
pension liability since the year end
H1 H1 FY
• Key assumptions:
2018/19 2017/18 2017/18
Discount rate 2.9% 2.7% 2.6%
Inflation rate 2.1% 2.1% 2.0%
45Statutory cash flow
Interims Finals
£ million 2018 / 19 2017 / 18 2017 / 18
Adjusted EBITDA 299 287 574
Movement in working capital (7) 24 (22)
Payment in respect of non-underlying items (13) (9) (36)
Movement in provisions and financial liabilities (13) (23) (43)
Cash generated by operations 266 279 473
Net capex (100) (103) (233)
Cash flow 166 176 240
Statutory operating profit 184 178 349
Statutory conversion* 90% 99% 69%
Reconciliation
Cash generated by operations – continuing operations 266 279 473
Cash generated by operations – discontinued operations (3) 7 11
46 Cash generated by operations – total group 263 286 484
* Ratio of cash flow to statutory operating profitAdjusted earnings reconciliation – continuing business
Earnings
(£m)
Adjusted earnings attributable to equity shareholders & EPS 145.3 35.4p
Acquisition and integration costs (0.9) (0.2)p
Deferred consideration on earn-outs (0.1) (0.1)p
Amortisation – acquired intangibles (25.5) (6.2)p
Other adjusting items (8.0) (2.0)p
Total adjusting taxation 8.1 2.0p
Total adjusting items (26.4) (6.5)p
Basic earnings attributable to equity shareholders & EPS 118.9 28.9p
47Alternative performance measures
In the reporting of financial information, the directors have adopted various Alternative Performance Measures (APMs), previously termed Non-GAAP measures as those not
defined or specified under International Financial Reporting Standards (IFRS).
These measures are not defined by IFRS and therefore may not be directly comparable with other companies’ APMs, including those in the Group’s industry.
The principal alternative performance measures used in this presentation are:
• adjusted operating profit;
• adjusted earnings before interest, tax, depreciation and amortisation (‘EBITDA’);
• return on sales;
• adjusted profit before tax;
• adjusted basic earnings per share;
• organic sales growth;
• free cash flow;
• adjusted operating cash conversion;
• return on net operating assets;
• return on capital employed;
• working capital as a % of sales;
• net debt; and
• net debt to EBITDA.
These measures exclude the charge for customer relationships amortisation, acquisition related items and any associated tax, where relevant. Acquisition related items
comprise deferred consideration payments relating to the retention of former owners of businesses acquired, transaction costs and expenses and adjustments to previously
estimated earn outs. Customer relationships amortisation, acquisition related items and any associated tax are items which are not taken into account by management when
assessing the results of the business as they are considered by management to form part of the total spend on acquisitions or are non-cash items resulting from acquisitions
and therefore do not relate to the underlying operating performance and distort comparability between businesses and reporting periods. Accordingly, these items are
removed in calculating the profitability measures by which management assess the performance of the Group. Many of the measures include proforma adjustments for both
acquisitions and disposals to allow comparability between accounting periods.
Other non-GAAP measures are based on or derived from the non-GAAP measures noted above. All alternative performance measures in this presentation have been
48 calculated consistently with the methods applied and disclosed in the 2017/18 Annual Report.Definitions
Expense Description
Acquisition related expenditure The advisors fees and other expenses directly relating to the Group’s completed acquisitions.
Contingent consideration on The remuneration earned by the shareholders of Ace, Letica and other acquisitions who must
earn-outs remain as employees of the Group for the duration of the earn-out period to qualify for the
remuneration. It also includes adjustments related to the current expectation of the final payment.
Integration costs Costs relate to the integration of the Promens, GCS and BPI businesses into the RPC organisation,
including related restructuring, redundancy, closure costs and impairment charges. The scheme
was largely completed by the end of the 2017 / 18 financial year.
Other integration and adjusting Includes other items such as start up costs. It also includes restructuring, redundancy and closure
items costs of other business optimisation programmes not directly affected by the Promens, GCS and
BPI integration and advisors fees directly relating to the Group’s aborted acquisition processes.
Amortisation – acquired Relates to amortisation of intangible assets such as brands and customer relationships related to
intangible assets acquired business (amortised to the income statement on a straight-line basis over their estimated
useful life).
Other adjusting items Other immaterial non underlying costs including the pension admin costs on closed DB schemes.
Adjusting finance costs Includes finance charges related to the defined benefit pension schemes and the Ace contingent
consideration finance cost and the associated foreign exchange impact on the US dollar liability.
49Definitions (continued)
Category Description
Organic growth Period-on-period revenue change for continuing operations adjusted for constant exchange rates
and polymer prices, pro forma for acquisitions completed in the both periods (with the equivalent
periods in both years under comparison) and adjusted for disposals.
ROCE ROCE is measured over the relevant period (annualised for half year results) and normalised for
the effect of acquisitions, is adjusted operating profit for continuing operations, divided by the
average of opening and closing shareholders equity, after adjusting for net retirement benefit
obligations, assets held for sale, acquisition intangibles and net borrowings for the year concerned.
RONOA RONOA is measured over the relevant period (annualised for half year results) and normalised for
the effect of acquisitions, is adjusted operating profit for continuing operations divided by the
average of opening and closing property plant and equipment and working capital for the year
concerned. Comparatives are restated to include acquisitions on a pro forma basis.
50Forward looking statements
This presentation contains forward-looking statements, which:
have been made by the directors in good faith based on the information available to them up to
the time of the approval of this presentation and such information should be treated with
caution due to the inherent uncertainties, including both economic and business risk factors,
underlying such forward-looking information. The Group undertakes no obligation to update
these forward-looking statements and nothing in this presentation should be construed as a
profit forecast. Past performance is no guide to future performance and persons needing
advice should consult an independent financial advisor.
Nothing in this presentation shall constitute, in any jurisdiction, an offer or solicitation to sell or
purchase any securities or other financial instruments, nor shall it constitute a
recommendation or advice in respect of any securities or other financial instruments or any
other matter.
51You can also read