FULL-YEAR 2019 RESULTS - Valora
←
→
Page content transcription
If your browser does not render page correctly, please read the page content below
FULL-YEAR 2019 RESULTS
February 19, 2020

Michael Mueller, CEO, CFO a.i.

AGENDA

Content                                                  Page

Full-Year 2019 Results                                     6

Strategic Roadmap                                         23

Next Events                                               39

Appendix                                                  42

Full-Year 2019 Results Presentation, February 19, 2020          Page 2
SUCCESSFUL 2019
EBIT of 91.5 mCHF, above guidance expectations
Strong free cash flow generation with 76 mCHF (+55%)
Successful win of SBB tender with 262 (incl. 31 new) locations
B2B
- Strong top-line growth and operational performance
- Production expansion successfully completed, with full capacity as of
Q2 2020
Retail
- Retail CH with successful progress on food and concept development
- Retail DE benefitting from cost efficiencies and temporarily lower press
market decline
Food Service
- Integration of Ditsch B2C and BackWerk under one Food Service DE
umbrella successfully completed, first synergy effects from combined entity
- Strong same-store growth in all business units
Launch of the first cashier-free store (avec box) in Switzerland
Full-Year 2019 Results Presentation, February 19, 2020 Page 3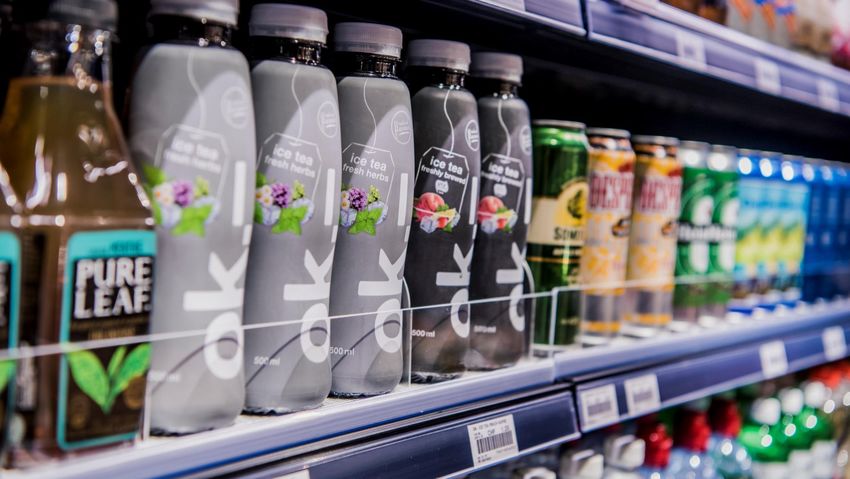
KEY FIGURES 2019

                                                                                              EBIT                       EBIT Margin
                                                                                                          91.5 mCHF                       4.5%
                                                                                                                -5.0%*                     -0.2%pt*

                                                                                              GP Margin                  ROCE
                                                                                                           45.2%                          8.4%
                                                                                                              +1.0%pt*                     -0.5%pt*

                                                                                              EBITDA                     Free
                                                                                                     157.4 mCHF          Cash
                                                                                                                         Flow
                                                                                                                                   76.0 mCHF
                                                                                                                -2.3%*                      +55.1%

                                                                                              External                   Leverage Ratio
                                                                                              Sales      2,681mCHF                        2.0x
                                                                                                                -0.0%*                       -0.1x*

  * For reasons of comparability, FY 2018 figures are pro-forma adjusted for IFRS 16 impact
    and at constant FX. ROCE and Leverage Ratio adjusted for IFRS 16 impact only.

Full-Year 2019 Results Presentation, February 19, 2020                                                                                                Page 4
KEY FINANCIALS 2019

                                                         Figures in mCHF

                                                                                                                       FOOD
                                                               RETAIL                              GROUP*
                                                                                                                      SERVICE

                                                                  2,111                     External Sales: 2,681         562

                                                                  1,669                     Net Revenues: 2,030           353

                                                                   632                      Gross Profit     917          278
                                                                  37.8%                     GP Margin** 45.2%            78.7%
                                                                    54                      EBIT               91          43
                                                                  3.2%                      EBIT Margin** 4.5%           12.2%

                                                                    35                      Capex              95          56

                                                                  15.4%                     ROCE            8.4%          6.5%
                                                           25.9% w/o Goodwill                 16.5% w/o Goodwill    16.3% w/o Goodwill

                                                         ** Including other for Corporate
                                                         ** Margins in % of net revenues

Full-Year 2019 Results Presentation, February 19, 2020                                                                                   Page 5
FINANCIAL
FULL-YEARYEAR
          2019
2018
RESULTS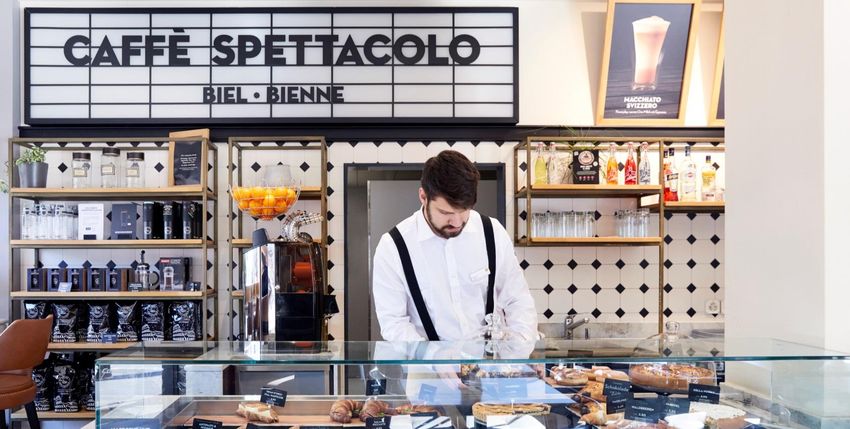
ROCE
ROCE AT 9.2% EXCLUDING SPECIAL COSTS RELATED TO SBB PROJECT
Valora Group Valora Group
-0.5%pt ROCE at 8.4% (-0.5%pt vs. 2018) as a result of the EBIT development
8.9% 8.4% ROCE adjusted for special costs related to SBB project at 9.2%
ROCE without goodwill at 16.5% (-1.4%pt vs. 2018)
2018* 2019 Capital employed stable at 1,094 mCHF (-0.4%)
Retail Retail
Retail CH: ROCE at 19.3% (-11.2%pt) due to lower EBIT as a result of special
-4.2%pt costs related to SBB project; adjusted for these costs, ROCE would be 24.2%;
19.6% ROCE without goodwill at 27.3% (-15.9%pt vs. 2018)
15.4%
Retail DE/LU/AT: ROCE at 11.0% (+2.7%pt) as a result of higher EBIT and
lower capital employed; ROCE without goodwill at 23.7% (+6.1%pt vs. 2018)
2018* 2019
Food Service
Food Service
+0.8%pt
ROCE at 6.5% (+0.8%pt) despite investments in capacity expansion
(higher capital employed) but thanks to strong EBIT performance
5.7% 6.5%
ROCE without goodwill at 16.3%
Over the coming years, ROCE will be further increased after having put the
2018* 2019
expanded production capacities into operation
* 2018 pro-forma adjusted according to IFRS 16
ROCE calculation basis: EBIT for the last 12 months / average capital employed over the last 13 months; operational cash allocated to Group only (not divisions)
Full-Year 2019 Results Presentation, February 19, 2020 Page 7
EXTERNAL SALES / NET REVENUES
FOODVENIENCE CATEGORIES GREW BY +2.2% / +2.9%
External Sales
Net Revenues
External sales stable with Food Service compensating
Net revenues stable (-0.8%), while foodvenience categories**
negative sales effect of Retail CH
grew by +2.9%
In mCHF In mCHF
-0.0%
-0.8%
2,681.8 2,680.6
-1.2 2,046.8 2,029.7
-17.2
43% 44%
+2.2% 41% 43%
+2.9%
57% Foodvenience categories** 56% 59% 57%
Foodvenience categories**
Press, Book, Tobacco Press, Book, Tobacco
2018* 2019 2018* 2019
* 2018 pro-forma adjusted according to IFRS 16 and at constant FX rates ** Foodvenience categories include Food, Services, Non-Food
and exclude Press, Books and Tobacco
Full-Year 2019 Results Presentation, February 19, 2020 Page 8
NET REVENUES
STRONG INCREASE IN FOOD SERVICE
Division | Country Same-store index (B2C)*** ∆
FY 2018* FY 2019 ∆ in % FY 2019
in mCHF in % Same-store
Retail 1,712.5 1,669.1 -2.5% Retail 99.8 -0.2%
CH 1,187.1 1,160.9 -2.2% CH 98.2 -1.8%
DE/LU/AT 525.3 508.2 -3.3% DE/LU/AT 102.0 +2.0%
Food Service 328.3 353.2 +7.6% Food Service 101.9 +1.9%
CH 101.2 108.8 +7.6% CH 103.0 +3.0%
DE** 227.1 244.4 +7.6% DE (Germany, Netherland, Austria) 101.6 +1.6%
Other 6.0 7.4 +21.9% Other n/a n/a
Valora Group 2,046.8 2,029.7 -0.8% Valora Group 100.2 +0.2%
* 2018 pro-forma adjusted according to IFRS 16 and at constant FX rates *** Based on external sales
** Food Service DE: Including B2C (in Germany, Netherland, Austria) and B2B
Retail CH Food Service
Same-store index below last year’s level (index: 98.2) caused by: Strong same-store sales in all B2C Food Service formats,
Negative tobacco and press development driven by high-traffic locations
Lower non-food due to Panini sales in 2018 Strong growth of Ditsch B2B (+15.5%), driven by higher
capacity, strong market momentum and customer gains
Net revenues decline (-2.2%) also effected by roll-out of SBB
locations (closure, ramp-up)
Other
Retail DE/LU/AT
Positive net revenue development thanks to bob Finance
Strong same-store growth (index: 102.0) driven by all categories
apart from press (however lower decline than in previous years)
Net revenue decline as result of shift from own to franchise stores
Full-Year 2019 Results Presentation, February 19, 2020 Page 9
GROSS PROFIT
GROSS PROFIT INCREASE DRIVEN BY STRONG FOOD SERVICE DEVELOPMENT
Gross Profit Split – Valora Group Gross Profit – Valora Group
Strong increase of gross profit margin (+1.0%pt) as a result of
higher share of food sales
Press / Book
10% In mCHF; Gross Profit margin in %
+1.3%
Tobacco
22% 917.2
2019
Gross Profit: +12.0
917.2 mCHF
53% Food 905.2
5%
Non-Food
11%
Services
2018* 2019
44.2%* +1.0%pt 45.2%
Foodvenience categories (Food, Services, Non-Food)
Tobacco, Press, Books
* 2018 pro-forma adjusted according to IFRS 16 and at constant FX rates
Full-Year 2019 Results Presentation, February 19, 2020 Page 10GROSS PROFIT
ATTRACTIVE FOOD MARGIN DRIVES GROUP GROSS PROFIT MARGIN
Division | Country ∆ Gross Profit ∆ GP
FY 2018* FY 2019
in mCHF in % Margin Margin
Retail 638.9 631.7 -1.1% 37.8% +0.5%pt
CH 465.6 460.7 -1.0% 39.7% +0.5%pt
DE/LU/AT 173.3 171.0 -1.3% 33.7% +0.7%pt
Food Service 260.3 278.1 +6.8% 78.7% -0.5%pt
Other 6.0 7.4 +22.3% 100.0% n.a.
Valora Group 905.2 917.2 +1.3% 45.2% +1.0%pt
* 2018 pro-forma adjusted according to IFRS 16 and at constant FX rates
Retail CH Food Service
GP slightly below last year (-1.0%) due to lower sales but partly GP increase of +6.8% mainly driven by B2B business and
compensated by positive increase of GP margin (+0.5%pt) as Food Service CH
result of favourable product mix effects from higher food share GP margin at 78.7% slightly below last year (-0.5%pt) due to
and higher promotional income higher share of B2B sales
Retail DE/LU/AT Other
GP decrease (-1.3%) as effect of lower sales (conversion of own Positive GP development thanks to bob Finance
stores into franchise)
GP margin increase (+0.7%pt) driven by higher share of
franchise fees, favourable product mix and higher promotions
Full-Year 2019 Results Presentation, February 19, 2020 Page 11OPERATING COSTS
HIGHER COSTS RELATED TO HIGHER PRODUCTION VOLUMES AND SBB ROLLOUT AT RETAIL CH
Operating Costs Operating Costs – Valora Group
in mCHF
+2.1% Cost increase of +2.1% driven by higher pretzel production
+1.0% volumes and SBB related costs
825.7
+9.0 Adjusted for special costs related to the SBB project, the cost
808.9 +7.8 increase would be +1.0% and thus proportionally lower than
the Group’s growth in gross profit (+1.3%)
816.7
Adjusted for SBB project costs, gross profit in % of operating
costs would improve by +0.4%pt
2018* 2019 Special costs 2019
(w/o special (SBB related)**
SBB costs)
Gross Profit / Operating Costs
Index in %
111.9% +0.4%pt 112.3%
2018* 2019
(w/o special
SBB costs)
* 2018 pro-forma adjusted according to IFRS 16 and at constant FX rates
** Special costs incl. IFRS 16 effects and other costs related to SBB project
Full-Year 2019 Results Presentation, February 19, 2020 Page 12OPERATING COSTS
COST SAVINGS IN RETAIL DE/LU/AT AND IN CORPORATE
Division | Country ∆ Cost ∆
FY 2018* FY 2019
in mCHF in % Ratio Cost Ratio
Retail -569.2 -577.6 +1.5% -34.6% -1.4%pt
CH -409.7 -425.0 +3.7% -36.6% -2.1%pt
DE/LU/AT -159.5 -152.6 -4.3% -30.0% +0.3%pt
Food Service -223.8 -235.0 +5.0% -66.5% +1.6%pt
Corporate / Other -16.0 -13.1 -18.3% n.a. n.a.
Valora Group -808.9 -825.7 +2.1% -40.7% -1.2%pt
* 2018 pro-forma adjusted according to IFRS 16 and at constant FX rates
Retail CH Food Service
Increased cost level related in particular to IFRS 16 effect (non- Higher costs of +5.0% driven by higher volumes at B2B /
cash) and other costs related to SBB project (-9 mCHF in total) production and partly compensated by lower costs at Food
as well as higher concept development costs Service DE as a result of synergy realisation (new organisation)
Improved cost ratio of +1.6%pt thanks to efficiency
Retail DE/LU/AT
Decrease of cost base by -4.3% as a result of initiated cost Corporate / Other
measures and conversion from own into franchise stores Other operating costs lower by +2.9 mCHF driven by special
corporate costs in 2018
Full-Year 2019 Results Presentation, February 19, 2020 Page 13EBIT
POSITIVE OPERATING PERFORMANCE IN ALL UNITS BUT CHALLENGING YEAR AT RETAIL CH
EBIT – Valora Group
EBIT reaches 91.5 mCHF, above guidance of ~90 mCHF
Adjusted for special costs related to the SBB project, EBIT growth would be
+4.2 mCHF or +4.4% driven by positive development of Food Service and
Retail DE/LU/AT
In mCHF; EBIT margin in %
96.3 +4.2
-9.0 91.5
+4.4%
2018* EBIT performance Special costs 2019
w/o special SBB costs (SBB related)**
4.7%* 4.5%
* 2018 pro-forma adjusted according to IFRS 16 and at constant FX rates
** Special costs incl. IFRS 16 effects and other costs related to SBB project
Full-Year 2019 Results Presentation, February 19, 2020 Page 14EBIT
EBIT MARGIN INCREASE IN RETAIL DE AND FOOD SERVICE AS A RESULT OF GOOD PERFORMANCE
Division | Country ∆ EBIT ∆ EBIT
FY 2018* FY 2019
in mCHF in % Margin Margin
Retail 69.7 54.1 -22.4% 3.2% -0.8%pt
CH 55.9 35.7 -36.1% 3.1% -1.6%pt
DE/LU/AT 13.9 18.4 +32.5% 3.6% +1.0%pt
Food Service 36.5 43.1 +18.0% 12.2% +1.1%pt
Corporate / Other -10.0 -5.7 n.a. n.a. n.a.
Valora Group 96.3 91.5 -5.0% 4.5% -0.2%pt
* 2018 pro-forma adjusted according to IFRS 16 and at constant FX rates
Retail CH Retail DE/LU/AT
Comparatively very good FY 2018 at Retail CH with extraordinary EBIT increases by +32.5% to 18.4 mCHF as a result of positive
good weather conditions same-store sales, higher gross profit margin and initiated cost
measures paying off
SBB related effects account for -9 mCHF EBIT decline in 2019
- Non-cash related effects (-7 mCHF) include initial Food Service
depreciation from IFRS 16 accounting (-6 mCHF) and EBIT increase of +18.0% or +6.6 mCHF driven by strong
impairment from accelerated depreciation (-1 mCHF) operating performance of B2C and B2B
- Cash related effects (-2 mCHF) include operational impact Strong EBIT margin at 12.2% (+1.1%pt) driven by efficiency
from SBB roll-out and SBB related concept development gains and synergies at Food Service DE
costs Corporate / Other
Base business impacted mostly by negative development of Positive development of other business by +4.3 mCHF, driven by
same-store sales and also by reduced contribution from Zurich bob Finance
airport locations and expenses related to new concepts
Full-Year 2019 Results Presentation, February 19, 2020 Page 15NET PROFIT / EARNINGS PER SHARE
INCREASE OF NET PROFIT DRIVEN BY EXTRAORDINARY TAX EFFECTS
Net Profit (from continuing operations) in mCHF
Net Profit / EPS ∆
EPS (from continuing operations) in CHF FY 2018* FY 2019
in mCHF in %
EBIT @ constant FX rates 96.3 91.5 -5.0%
+23.2%
FX 1.6 0.0 n/a
EBIT 97.8 91.5 -6.5%
73.6
Financing activities, net -22.2 -21.3 -4.1%
59.7 +13.9 Earnings before taxes 75.6 70.2 -7.2%
Income taxes -15.9 3.4 n/a
Net profit from continuing operations 59.7 73.6 +23.2%
Net result from discontinued operations -5.1 0.1 n/a
Group net profit 54.6 73.7 +35.0%
2018* 2019
EPS (from continuing operations) in CHF 14.17 18.68 +31.8%
14.17 18.68 EPS Group in CHF 12.87 18.70 +45.3%
Average number of outstanding shares in # (thousand) 3,933 3,940 +0.2%
* 2018 pro-forma adjusted according to IFRS 16 * 2018 pro-forma adjusted according to IFRS 16
Net Profit EPS
Extraordinary tax effects in 2019 leads to an increase of +23.2% in EPS (from continuing operations) increases to
net profit form continuing operations to 73.6 mCHF CHF 18.68 (+31.8%), benefitting from higher net profit and hybrid
Growth in Group net profit even came in at a higher rate of +35.0%, bond replacement in 2018
as a result of the positive tax impact and a value adjustment for EPS Group fully covering proposed dividend of CHF 12.50 gross
discontinued operations in the previous year (corresponding to 67% dividend distribution)
Future tax rate at ~20%, depending on profit mix of the countries
Full-Year 2019 Results Presentation, February 19, 2020 Page 16CAPEX
INVESTMENTS IN FUTURE GROWTH
Capex Valora Group
in mCHF
95 Capex of 95 mCHF higher than in previous year (70.8 mCHF) due to
investments in B2B production (Ditsch DE and US)
Corporate 4% 7 Maintenance Capex in 2020F expected to be around ~110 mCHF as a result of the
SBB roll-out and the finalisation of the production expansion
1.9 Base capex of around 50-70 mCHF per annum, thereof 10-20 mCHF
Expansion B2C maintenance and 40-60 mCHF expansion, full refurbishment &
35 innovation
& full refurbishment
Food Service 59%
Maintenance
Ongoing maintenance (incl. production) and partial refurbishments
Expansion
B2C
42 Expansion B2B - Greenfields & full refurbishments in B2C network: 30 mCHF
- First investments in SBB roll-out: 5 mCHF
Retail 37% - Capex for SBB roll-out in 2020F & 2021F: ~30 mCHF p.a.
B2B
Digital & IT
10 - Production expansion at Ditsch DE & US: 42 mCHF
innovation
2019 - Finalisation of production expansion in 2020F: ~10-15 mCHF
Full-Year 2019 Results Presentation, February 19, 2020 Page 17FREE CASH FLOW
FREE CASH FLOW INCREASES BY 55% DESPITE HIGHER CAPEX
Free Cash Flow
Free Cash Flow ∆
In mCHF FY 2018* FY 2019
in mCHF in %
+55.1%
EBIT 97.8 91.5 -6.5%
76.0 D&A (excluding depreciation of right-of-use asset) 66.2 66.0 -0.4%
Depreciation of RoU - IFRS 16 effect 139.1 141.2 +1.5%
Payments rents / leasing (net) - IFRS 16 effect -134.7 -128.2 -4.9%
+27.0
49.0 Interest - IFRS 16 effect -12.3 -13.4 +8.8%
Elimination of other non-cash items 4.4 1.7 -60.8%
NWC and current assets & liabilities -29.5 12.7 n/a
Interest, tax expense (net) -15.0 -9.4 -37.4%
CF from operating activities 116.0 162.1 +39.7%
CF from investing activities (net) -67.0 -86.1 +28.5%
Free Cash Flow (before M&A) 49.0 76.0 +55.1%
2018 2019 * 2018 pro-forma adjusted according to IFRS 16 Please refer to appendix for more details on new KPI definitions.
Free Cash Flow
Free Cash Flow increases (+55.1%) to 76.0 mCHF, despite higher capex, mainly supported by reduced net working capital (NWC) in
2019 compared to NWC outflows in 2018
Capex increase driven by investments in expansion of pretzel production capacity and first SBB refurbishments
NWC improvement as a result of continuous process improvements and normal business fluctuations
IFRS 16 effects neutral on free cash flow level
Full-Year 2019 Results Presentation, February 19, 2020 Page 18BALANCE SHEET
Net Debt in mCHF Balance Sheet ∆
FY 2018* FY 2019
Leverage Ratio in x in mCHF in %
Total assets 1,921.5 2,392.8 +24.5%
thereof right-of-use asset & sublease net investment 595.3 1,031.5 +73.3%
-10.5% Cash, cash equivalents 104.8 122.7 +17.1%
358.6 Goodwill and intangible assets 681.5 657.2 -3.6%
-37.7 320.9 Net debt 358.6 320.9 -10.5%
Net debt incl. lease liability 960.0 1,369.1 +42.6%
Leverage ratio 2.2x 2.0x -0.1x
Leverage ratio incl. lease liability 3.2x 4.6x +1.4x
Shareholders' equity 607.7 626.1 +3.0%
Equity ratio 45.8% 46.0% +0.2%pt
2018* 2019 Equity ratio incl. lease liability 31.6% 26.2% -5.5%pt
Capital employed (average) 1,098.8 1,094.0 -0.4%
2.2x -0.1x 2.0x ROCE 8.9% 8.4% -0.5%pt
* 2018 pro-forma adjusted according to IFRS 16 Please refer to appendix for more details on new KPI definitions.
Balance Sheet
Stable capital structure with interest bearing debt of 444 mCHF (-4.3%)
Net debt decreases by -37.7 mCHF, impacted by lower financial liabilities (-19.8 mCHF) and higher cash (-17.9 mCHF)
Net debt including lease liabilities amounted to CHF 1,369 mCHF compared to 960 mCHF at year-end 2018; the increase is due in particular
to the renewal of the SBB lease agreement, related to the SBB tender project in 2019
Shareholder’s equity stable at 626.1 mCHF (+3.0%)
Strong equity ratio at 46.0% (+0.2%pt)
As a result of lower net debt, leverage ratio (net debt / EBITDA) improves to 2.0x (-0.1x); leverage ratio target at 2.0x - 2.5x EBITDA
Full-Year 2019 Results Presentation, February 19, 2020 Page 19GUIDANCE
2020 EBIT GUIDANCE OF CHF 85-91 MILLION
EBIT
in mCHF
~-20 ~+15-20
91.5 85-91
2019 SBB impact Operational 2020F
improvement
Expected SBB impact
Includes higher rent and higher incremental D&A from capex and special project costs – depending on timing of roll-out
Operational improvement expected in all units
Retail CH with a major contribution, same-store growth and food expansion across all formats, promotions and operational efficiency
Retail DE expansion of food offerings, promotional activities / platforms and full-year effect of operational improvements
Food Service B2C with further same-store growth (high attractivity of concepts) and full-year effect of cost improvements
B2B growth supported by new line capacities in Oranienbaum / DE and Cincinnati / US
Full-Year 2019 Results Presentation, February 19, 2020 Page 21CONFIRMATION OF LONG- AND MID-TERM GUIDANCE
~5%
Operational targets until 2025 EBIT margin
From Investors’ Day presentation, June 2019 in % of net revenues
External sales
+2-3% p.a.
growth
+0.5%pt p.a. 4.5%
GP margin
(on average)
+0.2%pt p.a.
EBIT margin
(on average)
+ 7%p.a. 2019 Same-store Network expansion B2B business 2022F
EPS* growth & margin (incl. SBB)
(on average)
Long-term operational targets confirmed Operational targets apply also for mid-term
* Without extraordinary effects
Mainly food growth and efficiency to compensate increased SBB rent
Network expansion with focus on sound profitability
B2B sales growth thanks to capacity expansion & positive portfolio mix effects
Full-Year 2019 Results Presentation, February 19, 2020 Page 22STRATEGIC ROADMAP
OUR VISION: BEST FOOD & CONVENIENCE CONCEPTS

                                                     Andres Bild

                                                                   We offer the best food and convenience concepts based
                                                                   on: an in-depth understanding of customers and
                                                                   formats, operational excellence, ongoing innovation and
                                                                   agility and optimal value creation.

Full-Year 2019 Results Presentation, February 19, 2020                                                                   Page 24
KEY INVESTMENT HIGHLIGHTS
FOODVENIENCE FOCUS
Focus on food and like-for-like growth
CONSISTENT & ATTRACTIVE BOX ECONOMICS
Investments with attractive return & payback
STRONG CASH CONVERSION
High cash flow generation & payout ratio
Attractive dividend ensured through resilience, reliability, steady growth and sound balance sheet
Full-Year 2019 Results Presentation, February 19, 2020 Page 25POSITIVE MACRO-TRENDS DRIVE FOODVENIENCE
Rising demand for FOODVENIENCE Increasing FREQUENCY at public transportation hubs
Convenience Out-of-Home Outlook Passenger numbers Outlook
CAGR 2013-2018 CAGR 2015-2019 Compounded annual growth rate (CAGR) 2014-2018
Air traffic Train
+3.7% +5.0% +1.5%
CAGR CAGR CAGR
+1.6% +3.3% +4.5% +3.5%
CAGR CAGR CAGR CAGR
Source: AlixPartners 2019, npdgroup Germany 2019 Source: SBB, BFS/BAZL/BAFU, Deutsche Bahn, Statista
Full-Year 2019 Results Presentation, February 19, 2020 Page 26FOODVENIENCE AT TRANSPORTATION HUBS
IS OUR CORE BUSINESS
High exposure to foodvenience High exposure to high-frequency transportation hubs
Gross Profit Split External Sales Split
Valora Group Press / Book Valora Group (B2C)
10%
~0.1 m
customers
pre day
(7%)
Tobacco 50% 52%
22%
2019
Gross Profit: Transportation hubs
917.2 mCHF 53% Food Shopping malls
~0.3 m City centres
customers
5% pre day 30% 25% Other
(25%)
Non-Food
~0.2 m
11% customers
10%
pre day (16%) 16%
Services
10% 7%
Foodvenience categories (Food, Services, Non-Food)
Tobacco, Press/Book External Sales # Customers / Day
53% of gross profit is generated by food and
50% of sales are generated at transportation hubs
69% by foodvenience categories
Full-Year 2019 Results Presentation, February 19, 2020 Page 27FOOD AS KEY DRIVER FOR GROWTH
Mid-term view Growth drivers included in mid-term guidance
(SBB refurbishment expected to be completed by 2022)
1 SBB roll-out: Foodvenience focus & operational excellence
2 B2B / Production: Capacity expansion
EBIT EBIT
on average:
margin margin
+0.2%pt p.a.
4.5% ~5%
3 B2C Food Service platform: Growth and efficiency gains
4 Stable profit contribution from tobacco
2019 2022F
Additional growth drivers
+ Digital innovations to improve core business
+ Add-on acquisitions in core business
Full-Year 2019 Results Presentation, February 19, 2020 Page 281 SBB Roll-out B2B B2C FS Tobacco
FOOD EXPANSION WITH SBB ROLL-OUT
BECOMING THE FOODVENIENCE DESTINATION WITH STRONG BRAND / POSITIONING
Expansion of convenience network
Conversion of ~90 k kiosk into avec
31 new locations at SBB locations to be mainly rolled out as avec
Relaunch of avec and increased «foodprint»
Increasing frequency
Increasing number of SBB customers
Upswing of locations: Higher capture rate on weekends and evenings
More food offering with higher ticket size / margins
Higher ticket size and margins driven by more food offering
Enlarged assortment with higher quality & bundling of food
products (cross-selling & up-selling)
Food with strong profit contribution at all SBB tender locations: +10%pt* increase in GP food share expected
* Expected until 2022
Full-Year 2019 Results Presentation, February 19, 2020 Page 291 SBB Roll-out B2B B2C FS Tobacco
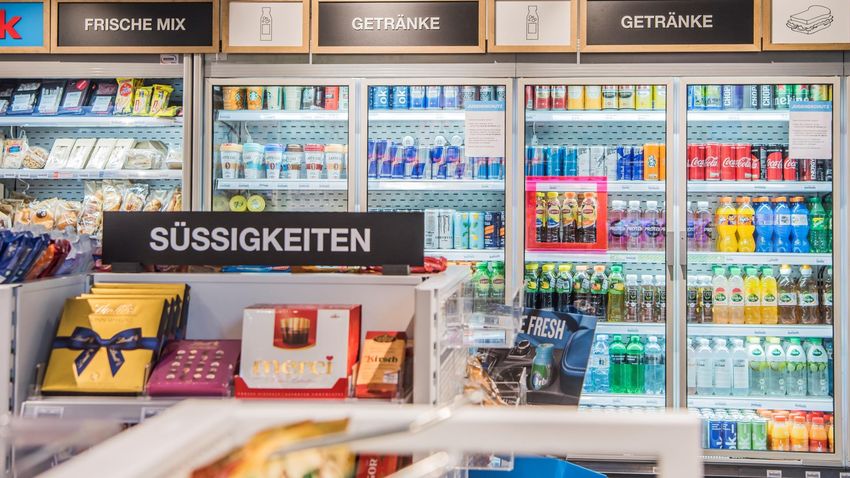
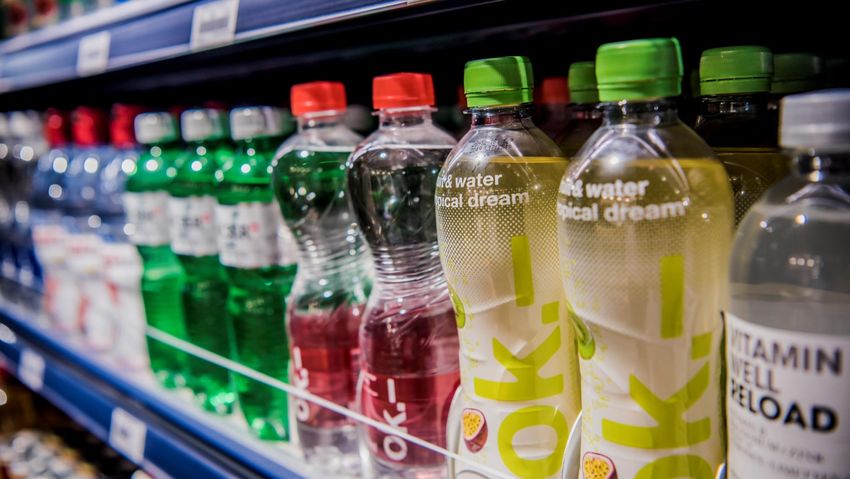
NEW LOOK FOR K KIOSK: MORE FRESHNESS & FOOD
OUR SHOPPING PROMISE: QUICK, CONVENIENT AND RELAXED
Surface
> 80 different types of flavoured
More cooling surfaces up to
waters, energy drinks,
for cold beverages 20-30%
smoothies and fruit juices
More convenience New healthy snacking and a
up to 20%
food & snacking fresh mix modules
Emphasis on baked goods and
More bakery products warm snacks in highly- up to 10%
frequented areas
Strengthening of own Caffè
new
Coffee / hot beverages Spettacolo and Starbucks coffee
locations
modules in new locations
For more information visit our Valora stories: https://stories.valora.com/en/2019/10/a-new-look-for-k-kiosk/
Full-Year 2019 Results Presentation, February 19, 2020 Page 30SBB Roll-out 2 B2B B2C FS Tobacco
ATTRACTIVE GROWTH POTENTIAL FOR DITSCH IN
THE 2 BIGGEST PRETZEL MARKETS
Growing pretzel market Ditsch outperforms market
Pretzel market data Outlook Ditsch output
(Volume) (Volume) 10%
3% CAGR
CAGR
2012 2018 2012 2019
3%
CAGR
65%
CAGR*
2012 2018
2017 2019
Source: GFK, NPD, company data * Note: Ditsch USA (Pretzel Baron) was acquired in January 2017 and
generated revenues in that year in the mid-single digit million range
Full-Year 2019 Results Presentation, February 19, 2020 Page 31SBB Roll-out 2 B2B B2C FS Tobacco
WORLD-LEADING PRETZEL MANUFACTURER
CONTINUES ITS NICHE GROWTH
Successful vertical integration strategy with Valora own formats
Organic growth continues in line with strategy (> 10% volume)
Resilient and well-balanced customer portfolio
Business continues to grow attractively due to quality, innovation &
market demand
Remaining capacity varies across different product types following 2019
investments
Three world-class bakeries with over 800 employees
Germany / Oranienbaum & Mainz (13 production lines)
US / Cincinnati (2 production lines)
Capacity enlargement Projects on time
Projects on budget
+20% Ramp up of new lines ahead of expectations (efficiency & quality & utilisation)
~50 mEUR investments between 2018-2020
+100% 2 production lines (+20% overall capacity increase) in Germany
Doubling capacity in US from 1 to 2 production lines
Full-Year 2019 Results Presentation, February 19, 2020 Page 32SBB Roll-out B2B 3 B2C FS Tobacco
B2C FOOD SERVICE PLATFORM TO LEVERAGE
COMBINED GROWTH & EFFICIENCY TARGETS
Same-store growth
Positive same-store growth in all Food Service formats Same-store growth
2019 vs. 2018 for +1.9%
Growth initiatives to drive sales: pricing, product groups, Food Service B2C
assortment mix, innovations, store layout, product (CH & DE)
placement and location focus
Network growth *
Focusing on sustainable store portfolio (network New openings Food Service (B2C)
robustness) at Ditsch & BackWerk 2019 vs. 2018
Hier entsteht ein König (gross openings in #)
Airside ZH Strengthening BackWerk concept for further roll-out
+44
Workplace* Growth through franchise outside Switzerland with
Brezelkönig
Food Service
Efficiency gains Integration of Ditsch B2C and BackWerk under Valora EBIT-Margin
Food Service DE umbrella successfully completed; first 2019: Increase since 2017:
synergy effects from combined entity, more to come
Food Service CH platform with progress, logistic of
Caffè Spettacolo and Brezelkönig successfully 12.2% +3%pt
integrated
*Brezelkönig airside, Zurich Airport, opening expected in April 2020
Full-Year 2019 Results Presentation, February 19, 2020 Page 33SBB Roll-out B2B B2C FS 4 Tobacco
TOBACCO STILL STRONG PROFIT CONTRIBUTOR
Tobacco – External Sales Outlook Key advantages of Valora’s large network for tobacco industry
-1.3% Increasing valuable customer contactINNOVATION: NEW OFFERINGS FOCUSED ON
CONVENIENCE AND NEW TECHNOLOGIES
Develop new solutions for customers, operations and organisation
Gain experience with avec box for further roll-out
Promote loyalty app (k kiosk app allows integration of further formats)
Benefit from process improvements: Retail analytics, automatic order proposal
Digital opportunities to further expand technological expertise
Strengthen internal competence for digital product development
Planned investments and operating expenses in digital development
of 20-25 mCHF in the next 3 years (included in financial outlook)
bob Finance
Increasing cash flow through growing credit portfolio (loan portfolio: > 200 mCHF)
Growth through new B2B partnerships in e-commerce: e.g. Apple / zer000.ch
Strengthen internal development skills and introduce new core banking platform
Develop new business opportunities, expand and diversify partner network
Full-Year 2019 Results Presentation, February 19, 2020 Page 35KEY OPERATIONS & DEVELOPMENT INITIATIVES 2020
Initiatives
Incremental growth drivers
Digital innovations
SBB roll-out B2B new capacity ramp-up
(Auto. check-out stores, loyalty programs)
Test expansion in new clusters Process optimisations of support
(clip-ins / gas stations with new formats) Add-on acquisitions
platform
Full-Year 2019 Results Presentation, February 19, 2020 Page 36FOODVENIENCE AS KEY GROWTH DRIVER
Summary
Full-Year 2019 Results Presentation, February 19, 2020 Page 37OUR BELIEF IN FOODVENIENCE AND WHY WE ARE
BEST POSITIONED IN THIS MARKET
Leading foodvenience player in an attractive and growing market
Supporting macro trends: Growing on-the-go demand and increasing
mobility / commuting
Leading convenience provider in Switzerland at high-traffic locations
No. 7* gastronomy provider in Germany with Valora Food Service DE
High investments in food expansion
Expansion of convenience network in Switzerland (SBB roll-out)
Capacity enlargement with B2B pretzel production
Strong market presence with dense network at > 2,700
attractive locations
Direct consumer contact with >1 million customer contacts per day
Strong partner for branded products, landlords & agents / franchisees
* Source: foodservice, as per 2018
Full-Year 2019 Results Presentation, February 19, 2020 Page 38NEXT EVENTS
NEXT EVENTS
Annual General Meeting 2020
Date Tuesday, March 24, 2020, Basel Congress Center
12.50 CHF per share gross
Dividend - 50% from retained earnings
- 50% from the reserve from capital contributions
New board members: S. Thoma, K. Schwab, M. Bernhard
Board Board members P. Ditsch, M. Fiechter, C. Ritz Bossicard not
standing for re-election
All other Board members standing for re-election
Renewal of authorised capital
- 400,000 shares à nom. CHF 1.00 until March 24, 2022
Capital
Conditional capital
- Increase up to 484,000 shares à nom. CHF 1.00
Half-Year Results 2020
Date Wednesday, July 22, 2020
Full-Year 2019 Results Presentation, February 19, 2020 Page 40NEW BOARD MEMBERS
Dr Suzanne Thoma (57)
CEO of the BKW AG since 2013, prior (2010-2013) Head of the Power Grid business
Master in Chemical Engineering at area and member of Executive Committee
the Swiss Federal Institute of
2002-2008: Management positions with WICOR Group, CEO of Rolic Technologies
Technology Zurich and Ph.D. in
Engineering 1990-2002: Management positions within and outside Switzerland at Ciba Speciality
Chemicals Inc (now BASF AG)
Bachelors in Business Member of the Board of Directors of OC Oerlikon, Vice-Chair of the foundation Avenir
Administration Suisse and member of the Economiesuisse Board
Dr Karin Schwab (47)
Vice President and Deputy General Counsel North and Latin America at eBay Inc.
Masters in Laws from the University (San Jose, USA) since 2013
of Fribourg and London Prior positions with eBay 2005-2013: Associate General Counsel Europe of eBay
Ph.D. from the University of Zurich International AG, Legal Counsel for Austria, Switzerland, Poland and Sweden
Associate with the Zurich law firm Homburger
License to practise in Switzerland
and California, US Member of the International Advisory Board of the ZHAW School of Management and
Law, Zurich
Markus Bernhard (55)
CEO of mobilezone Group since 2014, prior CFO (2007-2014)
Master of Business 1997-2007: CFO Novavisions AG (now Bloxolid AG; previously Mount10 Holding AG,
Administration from the Cope Inc. and Cope Holding AG)
University of St. Gallen
1991-1997: Auditor at PricewaterhouseCoopers
Qualified auditor at Treuhand- Member of the Board of Directors of NovaStor Software Group, Bloxolid AG and
Kammer Zurich Wickart AG
Full-Year 2019 Results Presentation, February 19, 2020 Page 41APPENDIX - Details Divisions
OUR BUSINESS: FOODVENIENCE

                                                                       Dense network in German-speaking Europe

                                                                       > 2,700 outlets at high-frequency sites

                                                                       Leading kiosk and convenience player

                                                                       Leading snack-food provider in Germany

                                                                       More than 10 brands and own label products

                                                                       Vertically integrated pretzel manufacturer
  Focused convenience and food service specialist with > 2,700
  outlets in German-speaking Europe and with a vertically integrated
                                                                       Strong financial and return profile
  pretzel production.

Our brands:                                                            Sales split:      50%         44% Other: 6%

Full-Year 2019 Results Presentation, February 19, 2020                                                               Page 43
STRONG FORMATS AND DISTINCT PRESENCE
IN GERMAN-SPEAKING EUROPE
External sales split
Change vs. 2019 by country
Format and number of stores Dec. 2019
Dec. 2018
k kiosk 1,193 -10
Press & Books 200 -4
RETAIL
cigo & subformats 411 -10
Switzerland 50%
avec 152 +6
ServiceStore DB 102 - 31
U-Store 24 -2
1,406
72
Ditsch 200 -10
FOOD SERVICE
Brezelkönig CH 60 -
Germany
44%
Brezelkönig Internat. 4 -
38
Caffè Spettacolo 32 -
1,186
BackWerk* 355 +2
Other 6%
Total 2,733 -28 Number of stores as per Dec. 2019
* Including 3 SuperGuud locations in Switzerland 2019
Full-Year 2019 Results Presentation, February 19, 2020 Page 44OUR MAIN RETAIL & CONVENIENCE FORMATS
Market leader in the kiosk Tobacco retailer also offering
business, mainly supplying press products and a range
tobacco, press and lottery of services for people on the
products. A growing share of move.
food as well as fresh products
and expanding digital services
offering.
Stores: 1,193 Stores: 411
Specialist in delivering a wealth Modern convenience format
of reading material. Extensive at highly frequented
press offering complemented locations, for example train
by selected book titles and a stations or service stations,
range of services for people on with an extensive offering of
the move. fresh food, other comestibles
and regional products.
Stores: 200 Stores: 152
Number of stores as per Dec. 2019
Full-Year 2019 Results Presentation, February 19, 2020 Page 45OUR MAIN FOOD SERVICE FORMATS
Germany’s largest self-service Sale of high-end pretzel
bakery with a broad and dough products, such as
flexible range of snacks and pretzels, baguettes,
feel-good food. croissants, hot dogs or
selected sandwich snacks
when on the move. Internat.
franchise system.
Stores: 352 Stores: 64
Leading producer and provider Italian-themed coffee bar
of pretzels and products for concept with its own
immediate consumption for the locations and an integrated
retail and wholesale market coffee module concept for
with its own branch network. other Valora formats.
Stores: 200 Stores: 32
Number of stores as per June 2019
Full-Year 2019 Results Presentation, February 19, 2020 Page 46RETAIL SWITZERLAND
Key Financials Gross Profit Split 2019 Press / Book
Retail CH 7%
FY 2018* FY 2019 ∆ in %
in mCHF
External sales 1,261.8 1,229.5 -2.6%
Food
Net revenues 1,187.1 1,160.9 -2.2% 39%
Tobacco 31% 2019
Gross profit 465.6 460.7 -1.0%
Gross Profit:
Gross profit margin (in %) 39.2% 39.7% +0.5%pt 460.7 mCHF
EBIT 55.9 35.7 -36.1%
EBIT margin (in %) 4.7% 3.1% -1.6%pt
ROCE (in %) 30.5% 19.3% -11.2%pt 7%
* 2018 pro-forma adjusted according to IFRS 16 and at constant FX rates 16%
Non-Food
Services
Network (as per Dec. 2019)
Foodvenience categories (Food, Services, Non-Food)
Format Own Agency Franchise Total Tobacco, Press/Book
140 771 - 911
Foodvenience categories already account for 62% of total gross
3 28 - 31 profit (GP)
Positive increase in new categories and GP margin expected,
81 8 59 148 as food on-the-go is an increasing trend
Total (vs. 2018) 224 (-21) 807 (+42) 59 (-13) 1,090 (+8)
Full-Year 2019 Results Presentation, February 19, 2020 Page 47RETAIL GERMANY (INCLUDING LUXEMBOURG AND AUSTRIA)
Key Financials Gross Profit Split 2019
Retail DE/LU/AT DE = Germany Food
LU = Luxembourg FY 2018* FY 2019 ∆ in %
in mCHF AT = Austria 17%
External sales 880.5 881.3 +0.1% Press / Book
34%
Net revenues 525.3 508.2 -3.3%
Gross profit 173.3 171.0 -1.3% 2019 10% Services
Gross Profit:
Gross profit margin (in %) 33.0% 33.7% +0.7%pt
171.0 mCHF
EBIT 13.9 18.4 +32.5% 8%
Non-Food
EBIT margin (in %) 2.6% 3.6% +1.0%pt
ROCE (in %) 8.3% 11.0% +2.7%pt
* 2018 pro-forma adjusted according to IFRS 16 and at constant FX rates
32%
Network (as per Dec. 2019) Tobacco
Format Own Agency Franchise Partner** Total Foodvenience categories (Food, Services, Non-Food)
Tobacco, Press/Book
72 66 (LU) 144 - 282
+ sub formats 120 - 283 8 411 Foodvenience core categories account for ~1/3 of gross profit with
37 - 93 - 130
increasing contribution
Tobacco, Press and Book account for ~2/3 of gross profit as a
154 6 (LU) result of strong competence in this categories:
incl. 1 Caffè - - 170
10 (AT) Spettacolo
- Tobacco with strong momentum especially increasing e-smoke
Total (vs. 2018) 393 (-83) 72 (-2) 520 (+60) 8 (-4) 993 (-29) competence (professionalisation and share gains)
** Partner: Business model without Valora branding and 100% purchase obligations; orders on one’s own account
- Press / Books with high contribution from own stores
Full-Year 2019 Results Presentation, February 19, 2020 Page 48FOOD SERVICE
Key Financials
Food Service
FY 2018* FY 2019 ∆ in %
in mCHF
External sales 533.5 562.4 +5.4%
Net revenues 328.3 353.2 +7.6%
Gross profit 260.3 278.1 +6.8%
Gross profit margin (in %) 79.3% 78.7% -0.5%pt
EBIT 36.5 43.1 +18.0%
EBIT margin (in %) 11.1% 12.2% +1.1%pt
ROCE (in %) 5.7% 6.5% +0.8%pt
* 2018 pro-forma adjusted according to IFRS 16 and at constant FX rates
Network (as per Dec. 2019)
Format Own Agency Franchise Total
- 197 3 200
3 57 4 International 64
31 - - 31
9 - 343 352
-
3 - 3
Total (vs. 2018) 46 (+6) 254 (-12) 350 (-1) 650 (-7)
Full-Year 2019 Results Presentation, February 19, 2020 Page 49GROUP
Key Financials Gross Profit Split 2019
Press / Book
Group
FY 2018* FY 2019 ∆ in % 10%
in mCHF
External sales 2,681.8 2,680.6 -0.0%
Net revenues 2,046.8 2,029.7 -0.8% Tobacco
22%
Gross Profit 905.2 917.2 +1.3% 2019
Gross Profit: 53% Food
Gross Profit margin (in %) 44.2% 45.2% +1.0%pt
917.2 mCHF
EBIT 96.3 91.5 -5.0%
EBIT margin (in %) 4.7% 4.5% -0.2%pt 5%
ROCE (in %) 8.9% 8.4% -0.5%pt Non-Food
11%
* 2018 pro-forma adjusted according to IFRS 16 and at constant FX rates
Services
Network (as per Dec. 2019) Foodvenience categories (Food, Services, Non-Food)
Tobacco, Press, Book
Country Own Agency Franchise Total
Foodvenience categories account for > 2/3 of Group gross profit:
Retail CH 21% 74% 5% 1,090 - Food & Beverages account for more than half of gross profit
contribution
Retail DE/LU/AT 40% 7% 53% 993* - Games of Luck (e.g. lottery) as important service offering
Food Service 7% 39% 54% 650 - New services (e.g. pick-up/drop-off) with evolving importance
Classical categories account for < 1/3:
Total (in %) 663 (24%) 1,133 (42%) 929 (34%) 2,733* Strong competence in tobacco driving footfall and profit-contribution;
new alternative tobacco & e-smoke products with increasing demand
* Including 8 Partner business model
- Press / Books still important category but with declining contribution
Full-Year 2019 Results Presentation, February 19, 2020 Page 50OVERVIEW OF BUSINESS MODELS
TRANSFORMATION FROM AN OWN SALES NETWORK TO AN AGENCY / FRANCHISE MODEL
Own stores Agency Franchise
24%
Operations Valora Agent Franchisee
Inventory Valora Valora Franchisee
Own 89%
Lease agreement Valora Valora Valora
Franchisee (BW) 76%
Store investment Valora Valora
Valora (R DE)
Valora pays Valora receives
Fee None
commission to agent franchise fee
# number of stores Agencies
Dec. 2019*
663; 24% 1,133; 42% 929; 34% &Franchise 11%
*Without partner (#8) R = Retail; DE = Germany; BW = BackWerk
2011 2019
Full-Year 2019 Results Presentation, February 19, 2020 Page 51CURRENT FINANCING STRUCTURE
Well-balanced debt maturity profile
In mCHF
EUR Maturity
250
SSD II: 72 29-04-2021
200
SSD III: 170 11-01-2023
SSD III
150 SSD IV SSD IV: 100 11-01-2024
100 CHF Maturity
CFA 100 mEUR
(unused) SSD II
50 CFA: 50 (unused) 29-06-2020
50 mCHF 72 mEUR 170 mEUR 63 mCHF SSD IV: 63 11-01-2024
0
2020 2021 2022 2023 2024 SSD = Schuldscheindarlehen (Bonded Loan)
CFA = Credit Facility Agreement
Note: FX rate for chart (31/12/2019): 1 EUR = 1.086 CHF
Financing strategy
Optimisation long term financing structure Ensuring small- and midsize acquisitions with cash, CFA and
capital authorisations
Improvement of financing terms and reduction of financing costs
Leverage ratio target at 2.0x - 2.5x EBITDA
Higher relative attractiveness of bonded loan market (EUR and CHF)
Headroom for strategic flexibility
Refinancing of 50 mCHF CFA (voluntary notional cancellations)
Account for seasonality and NWC fluctuations
Full-Year 2019 Results Presentation, February 19, 2020 Page 52THE 5 PILLARS OF VALORA’S STRATEGY
PERFORMANCE
GROWTH EFFICIENCY INNOVATION SUSTAINABILITY
CULTURE
Drive
Create new offerings
Improve entrepreneurship,
Expand network focused on fresh Care for people
profitability & customer focus &
and grow in food food & and new & the planet
processes employer
technologies
attractiveness
Full-Year 2019 Results Presentation, February 19, 2020 Page 53WE BRIGHTEN UP OUR CUSTOMER’S DAY. WHEREVER
PEOPLE ARE ON THE MOVE
Nearby
Best locations, where people are on the go
Quick
Attractive in-store experience and ease of transaction (fast check-out)
Convenient
Long opening hours, fair prices
Fresh
Fresh (food) assortment
Full-Year 2019 Results Presentation, February 19, 2020 Page 54APPENDIX - Impact of IFRS 16 on Financial Results
IFRS 16: NEW ACCOUNTING STANDARD ON LEASES
IFRS 16 BECAME EFFECTIVE AS OF 1 JANUARY 2019
IFRS 16 to change the accounting…
Minimum or fixed lease payments need to be recognised on the balance sheet
- Valora holds more than 2,800 lease contracts, mainly for sales outlets
Companies appear to be more asset-rich but also more heavily indebted
- By recognising the value of the leased assets, the balance sheet will inflate and be more volatile
Change in presentation
- Valora subleases c. 1/3 of its POS related lease contracts to its franchisees and recognised the
sublease rental income as revenue
- Since 1 January 2019, Valora presents rental income from franchisees within other income
IFRS 16 became effective as of 1 January 2019; prior year figures not restated
- For reasons of comparability, 2018 figures are pro-forma adjusted in this presentation at
constant currency and for the IFRS 16 effect as well as for corresponding reclassification of
sublease rental income induced by IFRS 16
Key figures and performance indicators face major changes
- Valora redefined key KPIs to reverse the IFRS 16 effect
…. but business remains the same
Capitalisation of leases does not say anything about the quality or profitability of the lease
contract
Neither the operating business nor the profitability and net cash flow will change
Full-Year 2019 Results Presentation, February 19, 2020 Page 56FY 2018: P&L TRANSITION (1/2)
FY 2018 REPORTED FIGURES PRO-FORMA ADJUSTED FOR IFRS 16 EFFECT AND FX
Reclassi- Headlease Sublease 2018 pro- 2018 pro-
2018 reported 2018 revised IFRS 16 effect
in mCHF fication (financial lease) (financial lease) forma adj. FX forma adj. at
(1) (1+2) (3+4)
(2) (3) (4) (1+2+3+4) const. FX
External sales 2,731 2,731 2,731 -49 2,682
Net revenues 2,122 -47 2,075 2,075 -28 2,047
Gross profit 965 -47 918 918 -13 905
Net operating costs -876 47 -828 8 10 -2 -820 11 -809
thereof affected by IFRS 16:
Rental expense -232 -232 170 1 195 -25 -62 1 -61
Other revenue/ income 5 47 52 -23 -23 28 -1 27
Depreciation & Amortisation -66 -66 -139 1a -162 2a 23 -205 3 -202
Operating profit (EBIT) 90 2 0 90 8 1b 10 2b -2 98 -2 96
1) Reported in Valora Full-Year Financial Statements 2018; 2) Reclassification of sublease income induced by IFRS 16
1.1 Fixed (or minimum) lease payments are required to be recognised on the balance sheet at present value in the form of a right-of-use asset
(RoU) and a corresponding lease liability; the fixed (or minimum) lease payments will be replaced by:
1a
- Depreciation of the right-of-use asset
-
1b Interest expense relating to the lease liability: recognised in the financial result and thus increasing EBIT
2
2. Valora subleases part of its leases to its franchisees (c. 1/3 of its lease contracts) and used to recognise sublease income from franchisees as
revenues; as induced by IFRS 16, income from subleases have been reclassified from net revenues to other income with no effect on EBIT
Sublease, which qualifies as finance lease:
2a Reduces the depreciation portion of the RoU from the headlease, as the corresponding portion of the sublease receivable is
derecognised from the right-use asset on the balance sheet and instead capitalised as net investment
2b Reduces the EBIT as the interest income relating to the capitalised net investment is recognised in the financial result
Full-Year 2019 Results Presentation, February 19, 2020 Page 57FY 2018: P&L TRANSITION (2/2)
FY 2018 REPORTED FIGURES PRO-FORMA ADJUSTED FOR IFRS 16 EFFECT
2018
2018 pro-
in mCHF reported IFRS 16 effect
forma adj.
(1)
Operating profit (EBIT) 90 8 98
Financial expenses -11 3a -14 -25
Financial income 1 3b 2 3
Tax expenses -16 0 -16
Profit from continuing operations 64 4 -4 60
Result from discontinued operations -5 0 -5
Profit for the period 59 -4 55
1) Reported in Valora Full-Year Financial Statements 2018
3a Interest expense relating to the lease liability of the headlease: recognised as financial expense
Interest income relating to the sublease net investment: recognised as financial income
3b
4 Since the depreciation of the right-of-use asset is constant over the term, but the interest expense decreases due to the decreasing lease
liability, the total expense is brought forward and thus the net result is lower at the beginning (front-loading effect)
Full-Year 2019 Results Presentation, February 19, 2020 Page 58FY 2018: BALANCE SHEET TRANSITION
FY 2018 REPORTED FIGURES PRO-FORMA ADJUSTED FOR IFRS 16 EFFECT
2018
2018 pro-
in mCHF reported IFRS 16 effect
forma adj.
(1)
Assets 1,326 595 1,922
thereof right-of-use asset 1 518 518
thereof sublease net investment 78 78
2
Liabilities 712 601 1,314
thereof lease liability 601 601
Equity 614 3 * -6 608
Liabilities and Equity 1,326 595 1,922
* Including -2 mCHF cumulative effect of the initial application of IFRS 16 from the initial recognition of sublease arrangements.
1 Right-of-use (RoU) asset: Fixed (or minimum) lease payments are required to be recognised on the balance sheet at present value in the
form of a right-of-use asset and a corresponding lease liability; significant increase in RoU asset and lease liability expected in H2 2019 from
renewed SBB rental agreements
2 Sublease net investment: Sublease receivables are derecognised from the right-use-use asset on the balance sheet and will instead be
capitalised as net investment
3 Equity: The IFRS 16 related P&L impact on profit as well as the cumulative effect of the initial application of IFRS from the initial recognition of
sublease arrangements is recognised in equity
Full-Year 2019 Results Presentation, February 19, 2020 Page 59NEW KPI DEFINITION
Net debt: Interest bearing debt (excluding lease liability) minus cash
& cash equivalents
Balance sheet
ROCE: EBIT / Capital employed
Capital employed: Capital employed excl. right-of-use asset &
sublease net investment
New KPIs / Ratios
Assets: Assets excl. right-of-use asset and sublease net investment
Equity: Excluding IFRS 16 effect Leverage Ratio: Net debt / EBITDA
EBITDA:
+ EBIT (according to new IFRS 16 standard)
P&L
+ Depreciation (excluding depreciation of right-of-use asset)
Equity Ratio: Equity / Assets
+ Amortisation
New Free Cash Flow same as previous Free Cash Flow:
Cash Flow
Free Cash Flow:
+ EBITDA Eliminating IFRS 16 effect in cash flow:
+ Non-cash items + Depreciation of right-of-use asset
+/- Net working capital - Payments rent / leasing (net)
- Interest and taxes - Interest expenses
Full-Year 2019 Results Presentation, February 19, 2020 Page 60CONTACTS & CALENDAR
CONTACTS
Christina Wahlstrand Phone: +41 61 467 20 65
Head of Corporate Communications & Branding E-mail: christina.wahlstrand@valora.com
Annette Martin Phone: +41 61 467 21 23
Head of Corporate Investor Relations E-mail: annette.martin@valora.com
EVENT CALENDAR
Annual General Meeting March 24, 2020
Half-Year Results 2020 July 22, 2020
Please visit our website for more information regarding Valora
www.valora.com
Full-Year 2019 Results Presentation, February 19, 2020 Page 61Brightens up your journey.
DISCLAIMER
NOT FOR RELEASE, PUBLICATION OR DISTRIBUTION IN OR INTO THE UNITED STATES

THIS DOCUMENT IS NOT BEING ISSUED IN THE UNITED STATES OF AMERICA AND SHOULD NOT BE DISTRIBUTED
TO U.S. PERSONS OR PUBLICATIONS WITH A GENERAL CIRCULATION IN THE UNITED STATES. THIS DOCUMENT
DOES NOT CONSTITUTE AN OFFER OR INVITATION TO SUBSCRIBE FOR OR PURCHASE ANY SECURITIES. IN
ADDITION, THE SECURITIES OF VALORA HOLDING AG HAVE NOT BEEN REGISTERED UNDER THE UNITED STATES
SECURITIES LAWS AND MAY NOT BE OFFERED, SOLD OR DELIVERED WITHIN THE UNITED STATES OR TO U.S.
PERSONS ABSENT REGISTRATION UNDER OR AN APPLICABLE EXEMPTION FROM THE REGISTRATION
REQUIREMENTS OF THE UNITED STATES SECURITIES LAWS

THIS DOCUMENT CONTAINS SPECIFIC FORWARD-LOOKING STATEMENTS, E.G. STATEMENTS INCLUDING TERMS
LIKE “BELIEVE”, “EXPECT” OR SIMILAR EXPRESSIONS. SUCH FORWARD-LOOKING STATEMENTS ARE SUBJECT TO
KNOWN AND UNKNOWN RISKS, UNCERTAINTIES AND OTHER FACTORS WHICH MAY RESULT IN A SUBSTANTIAL
DIVERGENCE BETWEEN THE ACTUAL RESULTS, FINANCIAL SITUATION, DEVELOPMENT OR PERFORMANCE OF
VALORA AND THOSE EXPLICITLY PRESUMED IN THESE STATEMENTS. AGAINST THE BACKGROUND OF THESE
UNCERTAINTIES READERS SHOULD NOT RELY ON FORWARD-LOOKING STATEMENTS. VALORA ASSUMES NO
RESPONSIBILITY TO UPDATE FORWARD-LOOKING STATEMENTS OR ADAPT THEM TO FUTURE EVENTS OR
DEVELOPMENTS.

Full-Year 2019 Results Presentation, February 19, 2020                                       Page 63
You can also read