Impact of COVID-19 in the Middle East, North Africa, Central Asia, and Eastern Europe - Update #4 - WFP
←
→
Page content transcription
If your browser does not render page correctly, please read the page content below
Impact of COVID-19 in the Middle
East, North Africa, Central Asia, and
Eastern Europe
Update #4

                               July 2020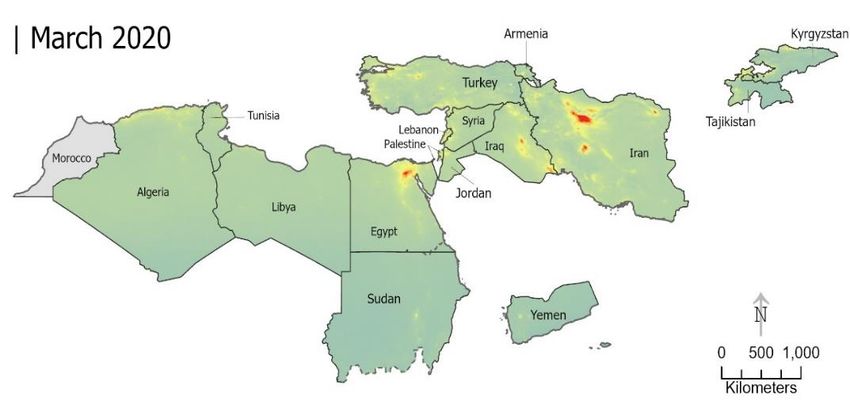
Table of Contents

Key Messages                                                                                           2
Section 1: Global and regional status of COVID-19                                                      3
Section 2: Food prices, affordability, and accessibility                                               4
Section 3: Healthy diets affordability and accessibility (an age specific lens)                        7
Section 4: Impact of COVID-19 on human activity                                                       10
Section 5: Impact of COVID-19 on food security and livelihood                                         12
Section 6: Impact of COVID-19 on access to nutritious food for women                                  20
Section 7: Food Security and Migration/Mobility                                                       21
Recommendations                                                                                       22

List of Figures

Figure 1: Minimum, maximum and national average cost of wheat flour (USD), June 2020                    6
Figure 2: Daily per capita cost of three types of diet in 12 countries in 2017                          7
Figure 3: Proportion unable to afford each of the three types of diets in 2017                          8
Figure 4: Percentage of Children (6-23 months) who had a Minimum Acceptable Diet                        8
Figure 5: Daily consumption of fruits and vegetables by adolescents (aged 12-17 years)                 9
Figure 6: Inadequate food consumption among surveyed households on national level/IDP level (Syria Jan
2019-June 2020)                                                                                        13
Figure 7: COVID-19 Impact on households’ income on national level and among displaced households (Syria
April-June 2020)                                                                                       14
Figure 8: Household’s access to markets, medical care, and assistance on national level (Syria April-June
2020)                                                                                                  15
Figure 9: Household’s access to markets, medical care, and assistance on governorate level (Syria April-
June 2020 aggregated)                                                                                  15
Figure 10: Inadequate food consumption among surveyed households on national level/IDP level (Yemen
Jan-June 2020)                                                                                         16
Figure 11: COVID-19 impact on households’ income on national level and among displaced households
(Yemen April-June 2020)                                                                                17
Figure 12: COVID-19 impact on households’ reaching jobs on national level and among displaced
households (Yemen April-June 2020)                                                                     18
Figure 13: Household’s access to markets, medical care, and assistance (Yemen April-June 2020)         19
Figure 14: Women’s access to nutritious food in Diyala, Iraq                                           20

List of Tables

Table 1: COVID-19 regional update as of July 18th, 2020                                                3
Table 2: Annual headline and food inflation rates, June 2020                                           4
Table 3: Food Basket Cost dynamics, June 2020                                                          5

List of Maps

Map 1: Concentration of Nitrogen Dioxide (NO2) over time in the region                                10

                                                                                                       1
Key Messages

   •   Pressure on prices is still high in countries of the region that have been facing economic crises even
       before COVID-19 outbreak, such as Sudan and Lebanon. In June, annual headline inflation in Sudan
       was as high as 136 percent (up 19 percent compared to May 2020)
   •   In terms of the cost of food basket, Syria, Lebanon and Sudan reported the highest monthly
       increase; Syria (48 percent), followed by Lebanon (34 percent) and Sudan (26.9 percent). The
       increase is even more pronounced on a longer time frame (3m) at 65, 58 and 31 respectively.
   •   In June 2020, wheat flour prices varied across the region with the most expensive price seen in
       Jordan at USD 0.8/Kg. Iraq is the country with the widest gap between the minimum and maximum
       wheat flour prices (USD 0.56 per Kg).
   •   Food systems transformation is needed to address the problem of millions of people not being able
       to afford healthy diets because of high food price and income constraints.
   •   Limitation of movements and reduced industrial activities may be among the leading reasons
       behind lower environmental pollution.
   •   The effects of the pandemic on affected communities’ food security are compounded by pre-
       existing drivers of humanitarian and development needs such as conflict, poverty, displacement,
       discrimination and inequality. Refugees, IDPs and migrants find themselves at the intersection of
       many of the health, socio-economic and protection problems caused by the pandemic and are at
       heightened risk of poverty, hunger and marginalization.
   •   The COVID-19 crisis unfolds at a time when the number of food-insecure people in Yemen and Syria
       has already risen after years of conflict and economic downturn. Starting from April 2020,
       households’ inadequate food consumption increased reaching in June 34 percent in Syria and 36
       percent in Yemen.
   •   Levels of poor and borderline food consumption significantly increased among displaced
       households: in June around 40 percent of the IDPs in Syria and Yemen are consuming an
       inadequate diet, the highest percentage recorded in 2020.
   •   Ongoing conflict and displacement, significant price increases, and precautionary measures to
       prevent the spread of COVID-19, are reducing households purchasing power and their ability to
       maintain their livelihood. In Syria 64 percent reported having lost part or their total income and in
       Yemen around 60 percent of the households reported not having a single working member in their
       households.
   •   Access to markets and grocery shops, the main source of food for households, has also been
       negatively impacted and around a third of the surveyed respondents in Syria and Yemen reported
       being unable to reach the market to purchase food.
   •   The healthcare system in both countries (Syria and Yemen) have been already affected by years of
       conflict and they are struggling to contain the emergency and to provide the necessary treatment.
       In Syria around 14 percent of the households reported facing challenges accessing hospitals and
       clinics and this percentage goes as high as 45 percent in Yemen, where only 51% of health centers
       are fully functional with limited medicine and equipment available.
   •   With movement restrictions and decreased funding, around 10 percent in Syria and 30 percent in
       Yemen are reporting facing more challenges to access humanitarian assistance.
   •   In Iraq, 3 out of 5 women access to food decreased, making them more prone to food insecurity.

                                                                                                           2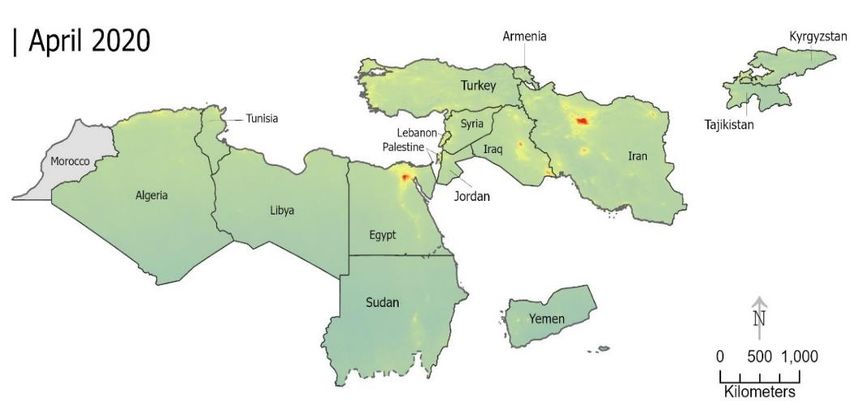
Section 1: Global and regional status of COVID-19

The COVID-19 outbreak continues to exacerbate globally. As of July 18th, 2020, there have been 13,876,441
cumulative confirmed cases of COVID-19, including 593,087 deaths, and 259,848 new cases reported to
WHO. Even though the pandemic started to contract in number of new cases confirmed globally, it is still
widely spread in the United States, with 3,544,143 confirmed cases, followed by Brazil (2,012,151), India
(1,038,716), and Russian Federation (765,437).1

Zooming in to the region, as of July 18th, 2020, the total number of confirmed cases in RBC countries
reached 795,397 confirmed cases. Countries with the highest number of cases and deaths are Iran (269,440
cases and 13,791 deaths), Turkey (217,799 cases and 5,458 deaths), Iraq (88,171 cases and 3,616 deaths)
and Egypt (86,474 cases and 4,188 deaths).2

Table 1: COVID-19 regional update as of July 18th, 20203

    Country                           Total Confirmed Total Confirmed Total deaths            Total new
                                      Cases           New Cases on                            deaths on
                                                      July 18th, 2020                         July 18th,
                                                                                              2020
    Algeria                           21,948               593                 1,057          5
    Armenia                           34,462               461                 631            11
    Egypt                             86,474               703                 4,188          68
    Jordan                            1,209                3                   10             0
    Iran                              269,440              2,379               13,791         183
    Iraq                              88,171               2,023               3,616          94
    Kyrgyz                            24,984               11,883              923            751
    Lebanon                           2,700                101                 40             0
    Libya                             1,704                52                  47             1
    Occupied Palestinian Territory    9,055                439                 57             5
    Sudan                             10,527               0                   668            0
    Syria                             496                  19                  25             3
    Tajikistan                        6,786                45                  56             0
    Tunisia                           1,336                9                   50             0
    Turkey                            217,799              926                 5,458          18
    Yemen                             1,580                24                  441            2

It is also important to understand how well countries are containing the spread of the virus, and at which
stage the pandemic is in different countries. As indicated in Table 1, the number of new cases is highest in
Kyrgyzstan, with 11,883 new cases and 751 new deaths, followed by Iran (2,379 new cases and 183 new
deaths) and Iraq (2,023 new cases and 94 new deaths).

1
  Source: WHO https://covid19.who.int/
2
  Source: World Health Organization (WHO) - Daily update
3
  Source: WHO COVID-19 Situation Report – 180 https://www.who.int/docs/default-
source/coronaviruse/situation-reports/20200718-covid-19-sitrep-180.pdf?sfvrsn=39b31718_2

                                                                                                          3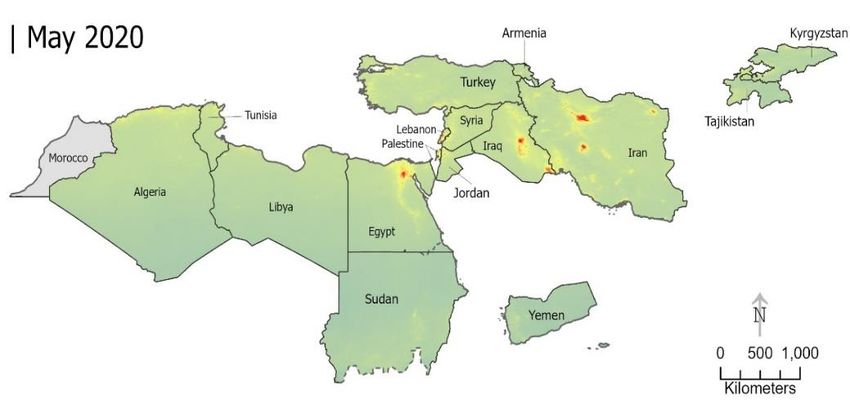
Section 2: Food prices, affordability, and accessibility

During H1 2020, the COVID-19 pandemic caused massive economic turmoil in the region through
simultaneous shocks, including a drop in domestic and external demand, a decline in oil prices, a reduction
in trade, disruption of production, a fall in consumer and investor confidence, and tightening of financial
conditions. Considering the strong containment measures implemented by MENA economies, together
with the disruption in global supply chains and the structural characteristics of individual economies,
growth has been estimated to be severely affected in the region for the year 2020 as well as public debt
and accounts4. Driven by economic concerns and flattening of the contagion curves, countries in the region
began lifting many of the restrictions put in place to curb the spread of COVID-19 after they had been
imposed for more than three months. The impact of the COVID-19 crisis on economies is still evident as
demonstrated by increase in the cost of living experienced across most countries of the region.
Nevertheless, the situation is expected to improve during the second half of the year, with forecasts
suggesting a rebound of economies for the year 2021.

Annual headline and food inflation
Table 2: Annual headline and food inflation rates, June 20205

       Country       Annual inflation       Food inflation      Pressure on prices is still high in countries of the
Algeria                            2.4%                   1%    region that have been facing economic crises
Armenia                            1.7%                   2%    even before COVID-19 outbreak, such as Sudan
Egypt                              5.6%                 0.1%    and Lebanon. In June, annual headline inflation in
Iran                              22.5%                14.9%    Sudan was as high as 136 percent (up 19 percent
                                                                compared to May 2020).
Jordan                            -0.6%                 2.0%
Kyrgyz Republic                    5.8%                10.7%
                                                             Due to the ongoing sharp depreciation in the
Lebanon                           89.7%               246.6%
                                                             Lebanese pound amid economic crisis, headline
Palestine                           -2%                -3.6%
                                                             inflation in Lebanon reached 89.7 percent in June
Sudan                              136%
                                                             2020, mainly driven by price spikes in food and
Tajikistan                          10%                 0.2% non-alcoholic beverages (246.6 percent).
Tunisia                            5.8%                 4.3%
Turkey                            12.6%                12.9% Annual inflation in Iran – the country with the
highest number of COVID-19 reported cases and death tolls in the region – rose to 22.5 percent, that is the
highest rate recorded since the beginning of the pandemic in February. Food inflation also increased to
almost 15 percent compared to June 2019.

4
 IMF World Economic Outlook, April 2020
5
 Source: National Institutes of statistics/central banks. Inflation rates for Algeria refers to May 2020-latest
available

                                                                                                                  4
As the economy re-opened from the coronavirus-induced restriction measures, Turkey's inflation rate rose
to 12.62 percent y-o-y, the highest rate recorded since August 2019; cost rose at a faster pace for food and
non-alcoholic beverages, reaching 12.93 percent vs 12.87 percent in June 2019).

In Kyrgyz Republic, the annual inflation rate fell to 5.8 percent (the lowest rate since February) from 7.2
percent in the previous month. The slowdown in inflation was driven by a decline in transport costs and
food and non-alcoholic beverages (10.7 percent vs 13.3 percent in May 2020).

Cost of the food basket6
Table 3: Food Basket Cost dynamics, June 20207

                                             In June 2020, the cost of food basket was stable across different
                                             countries, except for Syria which witnessed the highest monthly
                                             increase (48 percent), followed by Lebanon (34 percent) and
                                             Sudan (26.9 percent). The developments are even more
                                             pronounced on the longer time frame (3 months). The Syrian
                                             crisis is highly linked to the Lebanese financial and economic
                                             crisis- even prior to the COVID- that led to significant shortage in
                                             the foreign currency and currency depreciation for both the
                                             Lebanese Lira and Syrian pound. Throughout H1 2020, the
                                             informal exchange depreciated from SYP 1,028/USD in January to
                                             SYP 2,504.8/USD in June, and from LBP 2,229/USD in January to
                                             LBP 5,371/USD in June. Such depreciation affected greatly food
                                             prices, especially the imported ones.

As for Sudan, the crisis was persistent 2 years before the novel outbreak timely with the removal of subsides
and currency depreciation in January 2018. The pandemic pressured prices even further, as the food basket
cost increased by 118 percent from January 2020 to June 2020.
Price of wheat flour

In June 2020, wheat flour prices varied across the region with the most expensive price seen in Jordan at
USD 0.8/Kg. Iraq is the country with the widest gap between the minimum and maximum wheat flour prices
(USD 0.56 difference per Kg). On the contrary, state of Palestine and Kyrgyzstan reported a minor price
difference of USD 0.05 and USD 0.06 respectively.

6
    Source: WFP Field Monitoring.
7
    Red arrow is for more than 5 percent increase in 1m change and more than 15 percent increase for 3m change

                                                                                                                 5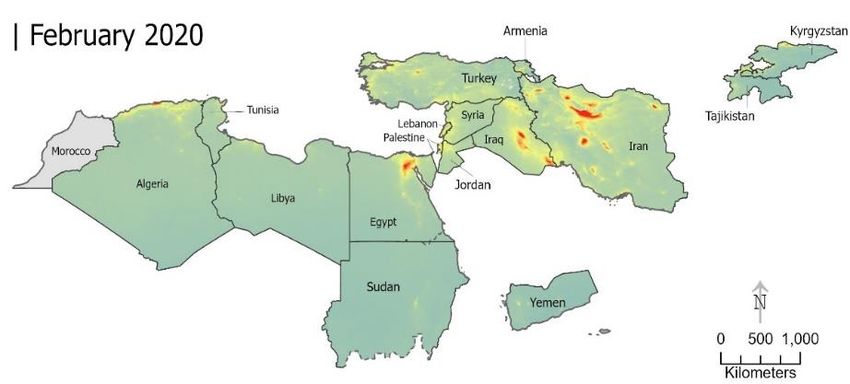
Figure 1: Minimum, maximum and national average cost of wheat flour (USD), June 20208
               1.6

               1.4

               1.2

                1                           Tafiela
                     Yerevan
      USD/KG

                                   Kirkuk
               0.8                                                       Benghazi
                                            Zarqa                                     Bethlehem                   Izmir
                     Kotayk                                     Beirut
               0.6                                                                    Hebron
                                                        Chuy                                           GBAO               Al Jawf
                                                        Talas                     Al-Hasakeh                  Gaziantep
               0.4                                                                                                        Hajjah
                                   Basrah                       Bekaa      Sirt                        Khatlon
                                                                                               Idleb
               0.2

                0

                                   Minimum            National average            Maximum

8
    Source: WFP Price Monitoring

                                                                                                                                6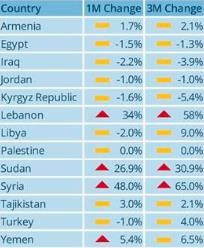
Section 3: Healthy diets affordability and accessibility (an age specific lens)

COVID-19 has aggravated the difficulties many vulnerable families already face in terms of the availability,
access and affordability of better varieties of safe and nutritious foods in the MENA and CIS regions. Millions
of vulnerable families are eating too little of what they need, and millions are eating too much of what they
don’t need: poor diets are now a main risk factor for the global burden of disease. The recent State of Food
Security and Nutrition in the World Report 2020 states that healthy diets are further out of reach for more
than 3 billion people. The COVID-19 pandemic will cause healthy diets to become even more unaffordable
for the more than 3 billion people estimated in this report. Access and availability to nutritious foods that
make up healthy diets must be a key component to achieve the 2030 targets in RBC countries.

The cost and affordability of healthy diets in countries under RBC oversight

Analyses conducted for few countries under RBC oversight show that healthy diets cost more than diets
that only meet the requirements for essential nutrients and diets that meet only the dietary energy needs.
The high cost and unaffordability of healthy diets is associated with increasing food insecurity and all forms
of malnutrition. The cost of a healthy diet is much higher than the international poverty line, established at
USD 1.90 purchasing power parity (PPP) per day in countries under RBC oversight. This puts healthy diets
beyond the reach of those living in poverty or just above the poverty line, highest being in Egypt and Sudan
with daily cost reaching up to $5 (Figure 2).

Figure 2: Daily per capita cost of three types of diet in 12 countries in 20179

                        7
                        6
    Daily cost in USD

                        5
                        4
                        3
                        2
                        1
                        0

                            Energy sufficient diet      Nutrient adequate diet       Healthy diet

Food supply disruptions and the lack of income due to the loss of livelihoods and remittances as a result of
COVID-19 means that households across the globe are facing increased difficulties to access nutritious
foods and are only making it even more difficult for the poorer and vulnerable populations to have access
to healthy diets.

Figure 3 shows the average percentage of population in each country who cannot afford the three
reference diets (energy sufficient diet, nutrient adequate diet and the healthy diet) in the year 2017. In
Sudan and Egypt more than 84% of the population cannot afford healthy diets, followed by Kyrgyzstan, Iraq
and Armenia with more than 50% of the population not being able to afford healthy diets.

9
    Source: State of Food Security and Nutrition in the World 2020

                                                                                                             7
Figure 3: Proportion unable to afford each of the three types of diets in 201710
100
Percentage of population
80
60
40
20
0
Energy sufficient diet Nutrient adequate diet Healthy diet
Proportion of children 6–23 months of age who receive a minimum acceptable diet11
In countries under RBC, most recent data available shows that less than 55% of children receive minimum
acceptable diet, Tunisia being the highest and Tajikistan being the lowest (figure 4). This indicates that
nutrition education and counseling related to infant and young child feeding practice is not addressed for
all mothers and caregivers in the countries. Early childhood nutrition, health, and economics programming
is crucial in RBC countries, particularly the first 1,000 days.
Figure 4: Percentage of Children (6-23 months) who had a Minimum Acceptable Diet12
60
50
40
30
20
10
0
10
Source: State of Food Security and Nutrition in the World 2020
11
One of WFP’s corporate indicators, the Minimum Acceptable Diet indicator measures both the minimum meal
frequency and the minimum dietary diversity, as appropriate for various age groups. If a child meets the minimum
meal frequency and minimum dietary diversity for his or her age group and breastfeeding status, then the child is
considered to be receiving a minimum acceptable diet
12
Source: UNICEF Global Databases 2019
8Consumption of fruits and vegetables by adolescents (12-17 years)13
Improving adolescents’ diets remains crucial globally. In many parts of the world, adolescents do not
receive the diets they need – in quantity, frequency, and quality. According to the World Health
Organization (WHO), a healthy diet for adolescents includes fruits and vegetables (at least 5 portions per
day).
Figure 5 shows, that adolescent countries under RBC oversight consume less than 3 servings of fruits and
vegetables daily. Adolescent nutrition profiles are deteriorating, and it includes high risks for
undernutrition, overweight and obesity, and micronutrient deficiencies.
Figure 5: Daily consumption of fruits and vegetables by adolescents (aged 12-17 years)14
3
Number of daily servings
2
consumed
1
0
Yemen Syria Sudan Palestine Egypt Iraq (2012) Lebanon Tunisia Algeria Morocco
(2008) (2010) (2012) (2010) (2011) (2011) (2008) (2011) (2010)
Vegetable Fruit
13
Adolescence is a formative time period of increasing independence where personal dietary habits and
preferences are formed that may persist into adulthood. The WHO recommends daily consumption of fruits and
vegetables (400 grams)” https://www.who.int/news-room/fact-sheets/detail/healthy-diet
14
Source: WHO Global School-based Student Health Surveys
9Section 4: Impact of COVID-19 on human activity
In response to the epidemiological risk connected to the spread of COVID-19 virus, many countries have
adopted drastic response measures such as limitation of opening hours for non-essential commercial
activities, curfews and in some cases lockdown. Such measures had a strong impact on population whose
freedom of movement has been limited and even stronger impact on economics, with major impact on
small business activities. On the other hand, limitation of circulation of vehicles and reduction of industrial
activities had a positive impact on the environment. It is possible to gauge the environmental impact by
comparing the presence of polluting gases in the air.
For this analysis, the concertation in the air of Nitrogen Dioxide (NO2) has been used. NO2 is the strongest
and heaviest gas in the NOx family and it is presence in the air is the result of combustions of fuels and its
concentration is higher where a higher concentration of vehicles or industries is found.
Using remote sensing tools and satellite imagery it is possible to compare monthly average level of NO2 in
the period from January to June, which allows to observe the gradual decrease of pollution in the air for
the largest number of countries in the RBC region and during the limitation of movements and industrial
production.
Notably, large urban areas in countries that have been highly affected (Iran, Turkey) show an impressive
decrease of NO2 concentration during the lockdown. The sequence also shows how countries with low
number of cases (Kyrgyz Republic, Tajikistan, Lebanon) have also implemented preemptive measures in
order to prevent the spread of disease in densely populated areas. In the majority of large urban areas, the
minimum NO2 concentration is observed in the period between March and April, while during the months
of May and June a slight and gradual increase of NO2 concentration reveal a slow progress in human and
industrial related activities.
Map 1: Concentration of Nitrogen Dioxide (NO2) over time in the region15
15
Source: Sentinel SP5, analysis conducted by RBC VAM using Google Earth Engine (GEE)
1011
Section 5: Impact of COVID-19 on Food Security and Livelihood

At the onset of COVID-19, WFP RBC in coordination with Syria and Yemen COs, utilizing the already long-
standing continuous food security monitoring systems in place, were able to adapt existing surveys to
capture vital information relevant to understanding the impact of COVID-19, such as people’s access to
health services, markets and food.

Besides the newly collected information on the potential impact of COVID-19, having long-term, continuous
food security data already available in these countries meant that we were able to better capture how
COVID-19, as a shock, may be influencing the food security trends.

Syria

Syria has witnessed a deterioration in the prevalence of households consuming an inadequate diet starting
from the last quarter of 2019 in parallel with the depreciation of the Syrian pound that had an immediate
impact on the cost of food and fuel (the national average informal exchange rate was at SYP 636 per USD
in October, representing a year-on-year depreciation of 40 percent.). Moreover, the depletion of assets
and the long-term use of negative coping strategies are making it more difficult for Syrian households to
keep up with the rising prices and cover for their essential food needs.

Against this backdrop, households are facing challenges reaching markets and shops due to COVID-19
outbreak that started in Syria in March 2020, when the first confirmed cases were announced, and
authorities put in place curfew and restricted measures to prevent the spread of the disease. mVAM data
collected during this period shows that the prevalence of inadequate food consumption reached the peak
in March 2020, when overall 38 percent of the surveyed households reported poor or borderline food
consumption, the highest percentage in the first half of 2020.

In April 2020, although the overall share of households with inadequate food consumption decreased,
already vulnerable populations like displaced households continued reporting higher levels of inadequate
food consumption.

In line with the trend observed in previous years, food security indicators improved in Syria during Ramadan
(May 2020), however, in comparison with the same month last year (May 2019), the prevalence of
inadequate food consumption is much higher especially amongst displaced households. In June 2020, after
the phasing out of the Ramadan effect, levels of poor and borderline significantly increased reaching at
national level (34 percent) and for IDPs (40 Percent).

Ongoing conflict and displacement from Northwest Syria, significant price increases and reduced
purchasing power compounded with the lockdown and lack of access to markets after COVID-19 outbreak
are the main reasons for this deterioration.

                                                                                                         12
Figure 6: Inadequate food consumption among surveyed households on national level / IDP level (Syria
Jan2019-June2020)
As a result of the closure of many work activities, movement restrictions and reduced working hours, on
average 64 percent of the surveyed households reported that they lost part or their entire income after
COVID-19 crisis. This percentage was higher among displaced households with many IDPs employed in daily
labor or operating small businesses (68 Percent).
As prices increase and incomes reduce, households purchasing power is decreasing further affecting
expenditure decisions of households. The average price of the food basket in June 2020 was 48% higher
than in May, and 240% higher than the same time in 2019.
13Figure 7: COVID-19 Impact on Households’ Income on National level and Among Displaced Households
(Syria April–June 2020)
As a preventative measure against the spread of the virus, around 91 percent of households permanently
stayed home which makes them not able to access markets, health centers and humanitarian assistance
regularly.
Al-Hasakeh (41 percent) and Quneitra (37 percent) are on the top governorates where households were
not able to access markets since the beginning of the health crisis, which resulted in a huge challenge for
households who relied on markets as a main source.
Access to medical care services during the pandemic was a challenge for many households across Syria
since March 2020 especially in Al-Hasakeh (19 percent), As-Sweida (16 percent), Deir-ez-Zor (14 percent),
and Quneitra (14 percent) due to the movement restrictions and lack of financial resources.
Households that relied on assistance to cover their essential needs were facing challenges to get the
assistance during the pandemic after imposing the curfew and lockdown. Households reported that they
were struggling and unable to receive assistance especially in the Northwest of Syria (Al Hasakeh 15
percent) and (Deir-ez-Zor 15 percent).
14Figure 8: Households’ Access to Markets, Medical Care, and Assistance on national level (Syria April–June
2020)
Figure 9: Households’ Access to Markets, Medical Care, and Assistance on governorate level (Syria April–
June 2020 aggregated)
15Yemen
The cumulative impact of more than 5 years of conflict, economic decline and institutional collapse has left
24 million people – about 80 per cent of the population – in need of humanitarian aid and protection. The
coronavirus (COVID-19) is spreading rapidly and exacerbating the humanitarian situation. As of 30 June
2020, the authorities reported a total of 1,162 cases of COVID-19 across the country since the first case
was reported on 10 April, including 313 deaths. COVID-19 is contributing to an economic downturn in
Yemen, risking families' ability to meet their basic needs, and increasing humanitarian needs and
vulnerability to the virus. The fuel crisis that hit the country in the first half of 2020 is threatening access to
food, hospital operations, and water supplies which are crucial to preventing virus transmission to the
response. In the first six months of 2020, there has been a hike in the cost of the minimum food basket by
as much as 31 per cent in some areas (Lahj) in comparison with the same period in 2019, and the Yemeni
rial is depreciating. Availability of perishable food commodities such as fruits, vegetables and fresh milk
(critical to nutrition in a country experiencing desperately high levels of acute malnutrition) is also in short
supply in many markets. In addition, the country is dealing with the combined effects of conflict, climate-
related shocks and crop pests. Both the COVID-19 and broader humanitarian response remain hugely
underfunded, risking an increase in the spread of COVID-19 and jeopardizing the ability of humanitarian
partners to respond.
mVAM data shows that in March 2020, although the overall share of households with inadequate food
consumption remained stable, food consumption of displaced households increased from 31 percent in
February to 38 percent in March.
In line with the trend observed in previous years, overall food consumption indicators improved in Yemen
during Ramadan (May 2020), however, they sharply deteriorated in June when overall 36 percent of the
surveyed households and 39 percent of the displaced households reported poor or borderline levels of
food consumption, the highest percentage in the first half of 2020.
Figure 10: Inadequate food consumption among surveyed households on national level / IDP level (Yemen
Jan-June2020)
16Imposed COVID-19 curfews and reduced working hours are affecting households’ access to income. In the
midst of lockdowns, reaching the workplace is becoming increasingly challenging and starting from April
fewer and fewer households reported being able to reach their place of work. On the other side the share
of respondents with no working members in the household has significantly increased since the start of the
health crisis. In April, approximately 42 percent of respondents lived in a household with no working
members. In May and June, this increased to 53 and 56 percent of respondents reaching 62 percent among
displaced households. This means that households no longer pursue their livelihoods and consequently
access to food will also be impacted. mVAM data shows that even among those households that are able
to continue their work, only a small proportion is receiving the same amount of income while the
proportion of households reporting not being paid is increasing as showed in Figure 11.
Figure 11: COVID-19 Impact on Households’ Income on National level and Among Displaced Households
(Yemen April–June 2020)
17Figure 12: COVID-19 Impact on Households’ Reaching Jobs on National level and Among Displaced
Households (Yemen April–June 2020)
In April around a third of the surveyed households were not able to access medical care in the past 14 days
before the survey. However, the share further increased to 44 and 45 percent in May and June,
respectively. Importantly, the primary reason reported for lack of medical care is inadequate financial
resources. However, there has been an increase in the share of respondents who report not being able to
receive medical care due to health centers being overwhelmed. In May and April, only 1 and 2 percent of
respondents respectively, reported this difficulty. However, this increased to 8 percent of respondents in
June. Importantly, there are strong regional differences in this figure, with 18 percent in Aden, the second
governorate in Yemen with the highest number of confirmed cases.
Conflict and decreased mobility due to the health crisis are impacting access to markets, the main source
of food for the majority of the population in Yemen (54 percent). As Figure 13 shows, starting from April
households are increasingly reporting facing challenges accessing market and grocery shops with one out
of three households having difficulties being unable to buy food from markets. The main reasons reported
are indeed the movement restrictions in place and concerns about going out of the house due to disease
outbreak and lack of financial resources.
Since April 2020, accessing humanitarian assistance is becoming more challenging due to movement
restrictions both at national level and among displaced households. Given the critical role that
humanitarian assistance is having in Yemen, main source of food for 24 percent of the surveyed households,
the combination of movement restrictions, lack of funding and decreased assistance is putting the lives of
millions of people who depend on aid every month at risk.
18Figure 13: Households’ Access to Markets, Medical Care, and Assistance (Yemen April–June 2020)
19Section 6: Impact of COVID-19 on access to nutritious food for women
The pandemic limited the job opportunities for women and caused them to be subjected to higher risk of
unemployment, poverty, and violence in comparison to men, hence making families headed by women
more prone to food insecurity16. A study by Oxfam on gender analysis of the COVID-19 pandemic in Iraq
shows that in Diyala, 3 out of 5 women access to nutritious food had decreased since the spread of COVID-
19 in the country. The emergency measures set such as the curfews and lockdown prevent people from
working, reducing household income and as a result individual's ability to buy food17.
Figure 14: Women’s access to nutritious food in Diyala, Iraq
After the outbreak of COVID-19, there was an increase in domestic workload for women, such as care giving
and supporting the family. Lockdown and confinements have increased stress caused by loss of income,
increased unemployment, banking pressures, lack of productivity, and decline in supplies, which, in turn,
increased intra-household tensions, including the frequency of domestic violence against women. The
COVID-19 pandemic has also increased the percentage of food insecure and vulnerable individuals,
especially families headed by women. Additionally, access to nutritious food is challenging for women. This
highlights the importance of having regulations and procedures to protect individuals’ livelihoods, food
security, their rights to live freely from violence, and their medical care.
16
https://daraj.com/en/42550/
17
https://reliefweb.int/sites/reliefweb.int/files/resources/rr-gender-analysis-covid-19-iraq-220620-en.pdf
20Section 7: Food Security and Migration/Mobility
Job losses are particularly severe in the informal economy – upon which the vast majority of migrants,
IDPs and refugees rely as a result of structural lack of economic inclusion. As a result, COVID-19 will lead
to widespread loss of livelihoods and an increase in poverty and food insecurity among people on the
move. This increases the risk of negative coping strategies, including lower food consumption, selling off
assets, child labour, child marriage, recurrence to irregular and dangerous migration, including through
smuggling and trafficking networks. According to recent studies18, refugees are 60% more likely than host
populations to be working in highly impacted sectors, such as accommodation and food services,
manufacturing, and retail.
Remittances to the MENA region are projected to fall by about 20 percent (from $59 billion to $47 billion)
in 2020 compared to the previous year19, mostly because of the socio-economic impact of COVID-19 in
countries of destination (especially the GCC countries and EU countries). Countries that are particularly
reliant on remittances in the RBC region are the Kyrgyz Republic (33.6% of GDP), Tajikistan (31 % of GDP),
Lebanon (12.7% of GDP), Armenia (12 % of GDP), Yemen (11.7% of GDP) and Egypt (11.6% of GDP)20. All
major remittance-receiving countries in the MENA Region will likely see a collapse of remittances, which
will result in enhanced poverty and food insecurity for particularly vulnerable households.
While international borders between countries across the Region have been officially closed because of
COVID-related measures since March 2020, migrants have continued to take enormous risks to start or
continue their movements along migration routes, which resulted in hundreds of thousands of migrants
who found themselves stranded at border areas, confined in institutional facilities (e.g.
detention/reception/quarantine/isolation centres), abandoned in perilous situations by smugglers or law
enforcement authorities (e.g. West African migrants stranded in desert areas near the borders with
Algeria and Libya; extremely vulnerable migrants in detention centres in Libya; Horn of Africa migrants
stranded in Yemen close to the border with Saudi Arabia, etc.). Overall, COVID-19-related containment
measures have led to significantly higher numbers of severely food insecure stranded migrants across
the Region.
18
https://www.refugeesinternational.org/reports/2020/7/6/locked-down-and-left-behind-the-impact-of-covid-19-
on-refugees-economic-inclusion
19
World Bank, April 2020
20
UNDESA 2019
21Recommendations
• WFP along with other agencies urgently call upon21 governments, international development
partners, donors and all other stakeholders to tackle the issues relating to the availability, access
and affordability of safe and nutritious foods and to take immediate action to protect the
nutritional status of the most vulnerable families, especially pregnant, lactating women and young
children across the regions, while implementing appropriate infection prevention and control
measures.
• Continue the remote monitoring of food and non-food price items as well as the overall
functionality of markets in terms of availability of key food and non-food commodities, variety of
goods, responsiveness and vulnerability of supply chains.
• Engage in or continue the frequent monitoring of food and non-food prices, to promptly provide
fresh and up-to-date data, which is essential to ensure timely analyses to guide policies to contain
spikes and estimate the affordability of goods
• Continue the remote monitoring of households’ food security indicators, people’s access to health
services, markets, food and the use of coping strategies that households may have used to cope
with the lack of food or money,
• Gathering reliable information on what children, adolescents and women eat is critical for RBC
countries. Regular tracking of how much and how often foods of various kinds are consumed,
weighted by nutritional value have been found to be powerful predictors of economic status and
malnutrition (including stunting, wasting, overweight and obesity)
• Identifying incentives and disincentives that encourage actors across food supply chains and food
environments to protect, promote, and support healthy diets for children and adolescents is
crucial.
• Social behavior change and communication interventions are needed to assess what children and
adolescents eat, how they make their food decisions, and how to stimulate demand for healthy
foods among children and adolescents and their caregivers.
• Work closely with the RBC Protection/AAP Unit and external Migration-mandated actors to expand
the evidence-base on the link between Food Security and Migration in RBC Region through focused
data collection and analysis that can support strategic, programmatic and advocacy efforts at
organizational and inter-agency level
21
Inter-agency Joint statement was developed based on the current understanding of COVID-19 and
recommendations for physical distancing.
22Regional analysis by RBC VAM team To monitor COVID-19 outbreak in RBC and relevant indicators, please visit our RBC | COVID-19 Monitor Hub For further information contact: Siddharth Kirshnaswamy (siddharth.krishnaswamy@wfp.org) 23
You can also read