Health Insurance Coverage and Access to Care Among Latinos: Recent Trends and Key Challenges
←
→
Page content transcription
If your browser does not render page correctly, please read the page content below

h

                                                                                                       October 8, 2021

                                                                                                           HP-2021-22

         Health Insurance Coverage and Access to Care
        Among Latinos: Recent Trends and Key Challenges

    KEY POINTS
          •    Uninsured rates in the Latino* population have fallen since the passage of the Affordable Care Act
               (ACA), from 30 percent in 2013 to a low of 19 percent in 2017.
          •    However, the uninsured rate among Latinos is still more than double that among non-Latino
               Whites (20 vs. 8 percent in 2019). Even though Latinos are more likely to be in the workforce
               than non-Latinos, they are less likely to receive health insurance through their employment and
               more likely to enroll in Medicaid coverage.
          •    The uninsured rate among Latinos increased slightly between 2017 and 2020, which coincided
               with substantial reductions in funding for Marketplace outreach and enrollment assistance. Lack
               of awareness and understanding regarding eligibility for Medicaid and Marketplaces remains a
               barrier to obtaining health coverage.
          •    Access to care also improved for Latinos between 2013 and 2016 after passage of the Affordable
               Care Act.
          •    However, Latinos are less likely to have a usual source of care, are more likely to be concerned
               about medical bills, and are more likely to have delayed care in 2020 due to the COVID-19
               pandemic compared to non-Latinos.
          •    Language barriers contribute to disparities in access to care. Latinos who primarily speak Spanish
               are more likely to lack a usual source of care, have fewer outpatient visits, and receive fewer
               prescription medications than Latinos who are English proficient.
          •    The American Rescue Plan’s enhanced Marketplace subsidies, combined with increased spending
               on Navigators and enrollment outreach in 2021, will increase the range of affordable coverage
               options for Latinos and can help improve health equity in this population.

BACKGROUND
Latinos are the largest racial or ethnic minority group in the United States and are projected to grow to 25% of
the population by 2045. The U.S. Office of Management and Budget defines “Hispanic or Latino” as any person
of Cuban, Mexican, Puerto Rican, South or Central American, or other Spanish culture or origin, regardless of
race.1 According to data from the 2020 Decennial Census, there are more than 62 million Latinos living in the
U.S.2 In 2019, among Latino subgroups, Mexicans ranked as the largest at 61.4 percent, followed by Puerto
Ricans (9.6 percent), Central Americans (9.8 percent), South Americans (6.4 percent), and Cubans (3.9
percent). States with the largest Latino populations were California, Texas, Florida, New York, Arizona, Illinois,
New Jersey, Colorado, Georgia, and New Mexico, and in a growing number of U.S. cities, Latinos are now the

_______________________
*   This brief uses the term “Latino” to refer to all individuals of Hispanic and Latino origin.

    October 2021                                                                                   ISSUE BRIEF      1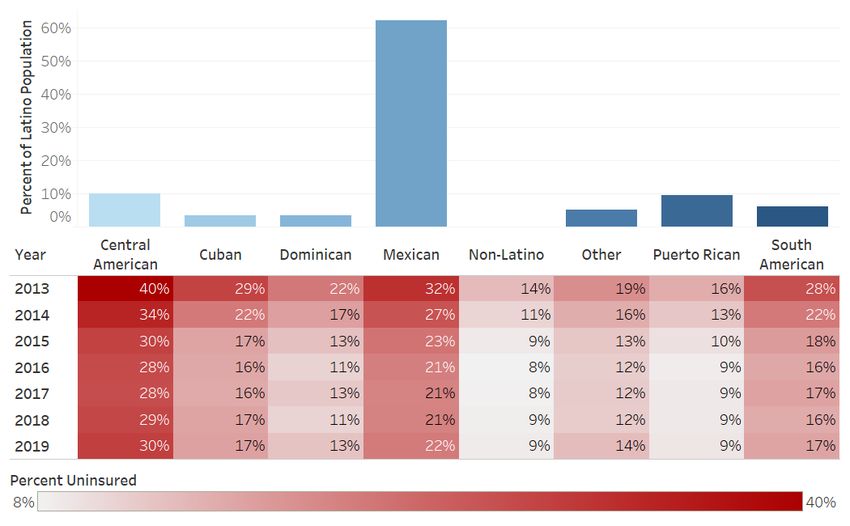
majority.3 Latinos are also the youngest demographic group in the U.S. In 2019 approximately 31 percent of
Latino Americans were under the age of 18 compared to 19 percent of non-Latino Whites.

Health outcomes among Latinos are affected by factors such as lack of health insurance, language and cultural
barriers, and lack of access to care. The Centers for Disease Control and Prevention (CDC) reports that the
leading causes of illness and death among Latinos include heart disease, cancer, unintentional injuries, stroke,
and diabetes. Some other health conditions and risk factors that significantly affect Latinos are asthma, chronic
obstructive pulmonary disease, HIV/AIDS, obesity, suicide, and liver disease.4

Latinos have consistently been overrepresented in the uninsured population. Prior to the implementation of
the Affordable Care Act (ACA), Latinos had the second highest nonelderly uninsurance rate among ethnic and
racial populations with more than 30 percent uninsured. As described in more detail below, the Latino
uninsured rate fell dramatically after the ACA, but as of 2019, Latinos were 20 percent of the total non-elderly
population but accounted for 37 percent of the nonelderly uninsured population. Studies show that people
without health insurance coverage are less likely to receive necessary preventive care and screening services,
have less access to care, and experience worse health outcomes than those with health insurance coverage.5,6,7
Latinos are more likely to delay care, less likely to have a usual source of care, and more likely to be concerned
about medical bills than their non-Latino counterparts. The cost of services is also a significant barrier to care
for many in the Latino community.

This issue brief analyzes changes in health insurance coverage and examines disparities in health status and
access to care between Latinos and non-Latino Whites using data from 2013-2020. This Issue Brief is part of a
series of ASPE Issue Briefs examining the change in coverage rates after implementation of the ACA among
select racial and ethnic populations.

DATA SOURCES AND METHODS
This issue brief presents data from several federal data sources. We present coverage estimates from the
American Community Survey (ACS), conducted by the Census Bureau. The ACS is the largest national survey of
households. The Census Bureau surveys almost 300,000 households each month for the ACS and collects
health insurance and demographic information, including race and ethnicity, along with other types of
information. This brief used ACS data from 2013 and 2019 for population, health insurance coverage and
demographic estimates. Individuals were defined as uninsured if they did not report having any private health
insurance, Medicare, Medicaid, CHIP, state-sponsored or other government-sponsored health plan, or military
plan at the time of interview; respondents were also defined as uninsured if they had only Indian Health
Service coverage.

We present results by Public Use Microdata Areas (PUMAs), the most granular level of geography available in
the ACS public use file. PUMAs are geographic areas within each state that contain no fewer than 100,000
people; they can consist of part of a single densely populated county or can combine parts or all of multiple
counties that are less densely populated.†

We also analyzed the National Health Interview Survey (NHIS) to assess differences in health care access for
Latinos and non-Latinos in the U.S. from 2013-2020. All analyses were weighted to reflect the
noninstitutionalized population and to adjust for complex survey design. The health care access measures
included not having a usual source of care, delaying medical care due to cost, worrying about medical bills,
delaying prescription refills to save money, problems paying medical bills, and inability to pay medical bills.
_______________________
†   Detailed maps of PUMAs for each state are available at: https://www.census.gov/geographies/reference-maps/2010/geo/2010-
    pumas.html.

    October 2021                                                                                          ISSUE BRIEF          2
In federal survey data, ethnicity (i.e., Hispanic or Latino origin) and race are two distinct categories. Origin is defined by the Census Bureau as ancestry, lineage, heritage, nationality group, or country of birth. Hispanic or Latino origin includes persons of Mexican, Puerto Rican, Cuban, Central American, South American, or Spanish origin. HEALTH COVERAGE The ACA expanded access to health coverage for millions of Americans through the Marketplace and Medicaid expansion to low-income adults. Compared to other ethnic and racial groups, Latinos experienced the largest percentage point decline in their uninsured rate in the ACS data. Figure 1 demonstrates the decline in the uninsured rate among Latinos compared to other groups in the period after implementation of the ACA’s coverage expansions, from 30 percent in 2013 to a low of 19 percent in 2017, before increasing slightly back to 20 percent in 2019. While progress has been made over the past decade, the Latino uninsured rate remained more than double the uninsured rate of non-Latino individuals in the most recent ACS data (20 percent v. 9 percent).8 The 2020 National Health Interview Survey (NHIS) found among nonelderly respondents, Latino adults (30 percent) were more likely than Black non-Latino (14 percent), White non-Latino (9 percent), and Asian non-Latino (9 percent) adults to be uninsured.9 Figure 1: Uninsured Rate for Nonelderly U.S. Population by Race and Ethnicity, 2010-2019 Source: Results are survey-weighted estimates using ACS Public Use Microdata Sample, 2010-2019. October 2021 ISSUE BRIEF 3
The largest single year increase in the Latino uninsured rate during the time period studied occurred from 2018
to 2019, when the rate increased from 19.2 percent to 20.2 percent. In comparison, the total U.S. uninsured
rate increased from 10.7 percent to 11.1 percent from 2018 to 2019. Thus, the pattern of increasing uninsured
rates among Latino individuals from 2018-2019 is similar to national trends for other groups, but somewhat
more pronounced.

Latino children were particularly affected by the recent coverage losses. While the overall uninsured rate
among all U.S. children started increasing between 2016 and 2019, the increase among Latino children was
twice as large as the increase among non-Latino children – a 1.6 percent-point increase compared to a 0.7
percent-point increase. This has reversed previous progress towards narrowing coverage disparities between
Latino children and their non-Latino peers.10 This increase in uninsured rates occurred during a period of
reduced funding for Marketplace outreach and enrollment assistance, and other changes including
immigration policies that may have reduced both Medicaid and ACA-related enrollment.11

Though the Latino uninsured rate has decreased substantially since the implementation of the ACA, high
uninsurance rates persist in particularly states including Texas, Georgia, and Florida, states that have not
adopted Medicaid expansion for adults.12 These non-expansion states with large Latino populations
disproportionately impact the uninsured rate. For Latinos, Medicaid serves an important role for health
coverage; while Latinos are more likely to participate in the workforce than non-Latinos,13 they are less likely
to have employer-sponsored insurance.14 According to a recent ASPE analysis, if the remaining non-expansion
states were to expand Medicaid eligibility for adults to 138% of the Federal Poverty Level (FPL), the number of
uninsured Latino adults (age 18-64) eligible for Medicaid would increase sixfold from 226,000 to 1,361,000.15

Coverage patterns for Latinos reflect more limited access to employer-sponsored coverage among Latino
adults, due to higher rates of employment in low-wage jobs that are less likely to offer health coverage, as well
as more limited access to and barriers to enrolling in public coverage options. According to recent survey data,
the share of Latino adults who report receiving employer-sponsored coverage is half that of non-Latino
Whites, 27 v. 53 percent.16 The ACA aimed to address these inequities and reduce the financial burden on
many households by providing free coverage through Medicaid expansion and significantly limiting costs for
low-income families through the Marketplace.

The American Rescue Plan (ARP) builds on the ACA by extending and enhancing Marketplace subsidies, which
enables many Americans to access more affordable coverage. 17 Individuals with family incomes above 400
percent of the FPL ($51,520 for a one-person household, $106,000 for a family of four in 2021) now qualify for
premium subsidies in 2021. Many others who already qualified for Premium Tax Credits are able to receive
larger subsidies. A recent ASPE analysis estimated that among uninsured Latino adults, approximately 69
percent now have access to a zero-premium plan on Healthcare.gov, and 80 percent can find a plan for $50
premiums or less per month due to the ARP subsidy provisions.18

Characteristics of Uninsured Latinos
As shown in Figure 2, the total number of uninsured persons in the US declined considerably after
implementation of the ACA, from 48 million in 2010 to just over 30 million in 2019. However, over this same
period of time, Latinos have represented a growing share of the uninsured population, accounting for 37
percent of the total uninsured in 2019.

 October 2021                                                                               ISSUE BRIEF      4
Figure 2: Latino and Non-Latino Populations Share of Total Uninsured Population, 2010-2019

Source: Results are survey-weighted estimates using ACS Public Use Microdata Sample, 2010-2019

The map in Figure 3 displays the nonelderly uninsured rate and percent of persons under the age of 65 who
identify as Latino in 2019, by PUMA (local areas defined on page 3 of this report). In the top 10 PUMAs ranked
in order of percent uninsured, Latino individuals are an average of 90 percent of the uninsured and 91 percent
of Marketplace subsidy-eligible uninsured.19 As shown in Figure 3, several states with large numbers of Latino
individuals have low uninsured rates – indicated in blue on the map – including California, Arizona, New
Mexico, and Washington, all states that have expanded Medicaid. States with large Latino populations and
high uninsured rates – indicated on the map in purple – include Florida and Texas, which have not expanded
Medicaid.

It is important to note that in all of the figures presented, PUMAs in densely populated urban areas do not
cover large enough geographic areas to show up clearly in national maps. For example, Figure 3 does not
indicate some of the small densely populated PUMAs with high shares of Latino individuals, including those in
Central Los Angeles County (where up to 99 percent of the uninsured population is Latino, depending on the
PUMA) and in Las Vegas (where up to 65 percent of uninsured are Latino). More granular data are available
from ASPE for these and other geographic areas.‡

_______________________
‡   State and Local Estimates of the Uninsured Population in the U.S. Using the Census Bureau’s 2019 American Community Survey
    available at https://aspe.hhs.gov/pdf-report/estimates-of-the-qhp-eligible-uninsured.

    October 2021                                                                                             ISSUE BRIEF         5
Figure 3: Uninsured Rate and Percent of Persons Who Identify as Latino in 2019, by PUMA
Source: Results are survey-weighted estimates using ACS Public Use Microdata Sample, 2019.
Note: % Latino: Very High (>75%), High (50-75%), Medium (25-50%), Low (0-25%). % Uninsured: Very High (>30%), High (20-30%),
Medium (10-20%), Low (0-10%).
Table 1 shows the change in uninsurance for Latinos from 2013 to 2019, by income. All income groups have
experienced a reduction in uninsurance since 2013, with the 100-200% FPL group experiencing the largest
reduction of 12 percentage points (38 percent vs. 26 percent) – largely due to the implementation of the ACA’s
Medicaid expansion and Marketplace subsidies in this income range.
Table 1: Estimates of Uninsured Latinos by Household Income, 2013-2019
Percent Uninsured
Percentage of Federal Poverty Level 2013 2014 2015 2016 2017 2018 2019
0-100 35% 31% 26% 25% 25% 24% 26%
101-200 38% 32% 26% 25% 24% 25% 26%
201-400 28% 22% 19% 18% 18% 19% 20%
400+ 13% 10% 9% 8% 9% 9% 10%
Souce: ASPE analysis of the ACS
Latino individuals for whom English is not their primary language are disproportionately uninsured. Our
analysis shows that among the total U.S. nonelderly uninsured population, approximately 4.7 percent do not
speak English, but among uninsured Latinos, the share of individuals who do not speak English is more than
twice as high at 11.5 percent. Table 2 shows the nonelderly uninsured rates for persons who self-reported not
speaking English at all, speaking English very well, or not speaking English well in the ACS. In 2019, the majority
of Latinos who do not speak English were uninsured. As Table 2 shows, the uninsured rate for non-Latino
individuals who do not speak English was significantly lower than that of their Latino counterparts (27 percent
v. 56 percent).
October 2021 ISSUE BRIEF 6Table 2: Estimates of Nonelderly Uninsured Rates by English Proficiency and Ethnicity, 2013-2019
Percent Uninsured
Ethnicity Speaks English 2013 2014 2015 2016 2017 2018 2019
Latino Does not speak English 68% 61% 55% 52% 53% 53% 56%
Yes, but not well 58% 51% 45% 43% 42% 42% 44%
Yes, speaks well 27% 21% 17% 16% 16% 16% 17%
Non-Latino Does not speak English 42% 34% 28% 24% 26% 25% 27%
Yes, but not well 32% 25% 20% 18% 18% 18% 18%
Yes, speaks well 14% 12% 9% 8% 9% 9% 9%
Source: ASPE analysis of ACS
Figure 4 presents uninsured rates for Latino subpopulations by origin, and also shows the share of the Latino
population in each subgroup. Latinos of Mexican descent represent by far the largest group, more than 60
percent of the Latino population. In terms of coverage, two results are striking: the uninsured rate fell from
2013 to 2019 for all Latino subgroups, and the underlying variation in uninsured rates across these groups is
extremely wide, with rates more than 3 times as high among Central Americans than Puerto Ricans in 2019 (30
percent vs. 9 percent).
Citizenship and immigration status play an important role in these differences across groups. Puerto Ricans
are U.S. citizens, meaning they are unencumbered by some of the coverage barriers that immigrants in other
Latino subgroups may face. Legal immigrants can purchase coverage through the ACA Marketplace and may
receive subsidies for this coverage, including those who are not eligible for Medicaid or CHIP because they
have not yet been permanent residents for 5 years, as required by law for Medicaid eligibility. Although they
are eligible for coverage, these immigrant groups may face a range of potential barriers to enrollment,
including confusion about eligibility policies, difficulty navigating the enrollment process, and language and
literacy challenges.
The decline in coverage among Latinos in 2018-2019 may, in part, reflect changes to policies affecting
immigrants under the Trump administration, which contributed to growing fears among immigrant families
(both Latino and non-Latino) about participating in public programs including health coverage.20 Research
shows immigration policies have had a chilling effect on enrollment for many families, beyond those directly
affected by the policies, and can further exacerbate disparities in insurance rates between Latinos and non-
Latinos.21
October 2021 ISSUE BRIEF 7Figure 4: Uninsured Rates Among Latino Subgroups, 2013-2019 Source: ASPE Analysis of ACS ACCESS TO CARE Access to affordable, high quality, and timely health care may prevent onset of disease and help patients to avoid experiencing health complications of chronic conditions.22 While health insurance coverage status is a critical facilitator of access to care, there are other important factors affecting health care access as well. For instance, having a usual source of care is associated with receipt of preventive health care and management of chronic diseases23 and has been well documented to prevent emergency department visits and reduce unmet health needs.24,25,26,27,28,29 Even among those with health insurance, cost barriers can lead to delays in health care access associated with poorer health status.30,31,32 This section explores differences in 2013-2020 trends in access to care between Latinos and non-Latinos. As shown in Table 4, access to care for Latinos improved considerably for most measures after the implementation of the ACA in 2013. From 2013 to 2019, the share of Latinos without a usual source of care or with delays filling prescriptions due to cost both fell by more than one-third, and the share worried about medical bills fell by one quarter. Notably, rates remained higher among Latinos than non-Latinos throughout the study period for lacking a usual source of care and worried about medical bills measures in Table 4. The last column in Table 4 corresponds to a survey item that was only asked of respondents who reported that they did experience problems paying or were unable to pay for medical bills. October 2021 ISSUE BRIEF 8
Table 4. Access to Care Trends for Nonelderly Latinos and non-Latinos, 2013-2019.
          No usual source      Delayed care due         Worried about         Delayed refilling      Problems paying         Unable to pay
              of care               to cost              medical bills          prescription         or unable to pay        medical bills†
                                                                               medications to          medical bills
                                                                                save money
Year      Latino     Non-      Latino       Non-       Latino       Non-      Latino     Non-        Latino       Non-      Latino           Non-
                    Latino                 Latino                  Latino               Latino                   Latino                     Latino
2013      21%**        12%        10%        10%        36%**        18%       15%**        12%       22%**        19%            56%         54%
2014      19%**        11%          8%       10%        32%**        16%         11%        11%       20%**        17%            54%         55%
2015      18%**        12%          8%         8%       30%**        14%         10%         9%       19%**        16%            55%         55%
2016      17%**        11%        7%*          8%       28%**        13%         10%         9%        17%*        15%            52%         53%
2017      18%**        11%          8%         9%       26%**        14%         10%        10%       17%**        15%            52%         53%
2018      18%**        12%       9%**        10%        28%**        14%           9%        9%         16%        15%            55%         53%
2019      13%**         9%      10%**          8%       27%**        13%           9%        8%         16%        15%            65%         62%
* p < 0.05 for Latino vs. non-Latino
** p < 0.01 for Latino vs. non-Latino
    Source: ASPE Analysis of NHIS
    † only available for respondents who indicated that they did experience problems paying or were unable to pay medical bills

    We also looked at access to care among Latinos by language—specifically, which language the NHIS interview
    was conducted. Information on the interview language was only available up until 2018, and thus we relied on
    pooled 2013-2018 NHIS data. Findings presented in Table 5 below show Latinos who were interviewed in
    Spanish or in a combination of English and Spanish were more likely to lack a usual source of care and worry
    about medical bills compared to Latinos who were interviewed in English only. This is consistent with a recent
    study which found health care spending among Latino adults with limited English proficiency was 35 percent
    lower than for similar Latino adults who were English proficient. Latino adults with limited English proficiency
    also made fewer outpatient and emergency department visits, had fewer inpatient days, and received fewer
    prescription medications than Latino adults who were English proficient.33

    Table 5. Access to care for Nonelderly (
Table 6. Access to Care During the COVID-19 Pandemic (2020) for Latinos and non-Latinos, By Age
Delayed care due to Did not get medical care Visits done virtually due to
COVID-19 due to COVID-19 COVID-19 (telemedicine)
Year & Latino Non-Latino Latino Non-Latino Latino Non-Latino
Age Group
2020: Adults (Ages 24%** 19% 15% 16% 82% 85%
18-64)
2020: Children 12% 14% 8% 8% 74% 83%
(Ages 0-17)
* p < 0.05 for Latino vs. non-Latino
** p < 0.01 for Latino vs. non-Latino
Source: ASPE Analysis of NHIS
COVID-19 PANDEMIC ECONOMIC AND HEALTH EFFECTS
The COVID-19 pandemic created unprecedented health and economic crises, with impacts disproportionately
affecting low-wage workers, people of color, and women. In many Latino communities, the COVID-19
pandemic exacerbated financial vulnerabilities and health challenges. Job losses during the pandemic left
many people without employer-sponsored health insurance (ESI). A recent analysis of Census Bureau data
indicated that of the 3.3 million non-elderly adults in the U.S. lost ESI during the summer of 2020, and nearly
half of them (1.6 million) were Latino adults.35 However, studies have shown that these ESI coverage losses
appear to have largely been offset by Medicaid and Marketplace enrollment increases.36
Latino communities suffered a disproportionately high number of deaths from COVID-19. In part, this may
reflect the larger share of Latinos who are essential workers, including food services, health care, and
construction. 37 Relative to past years, the number of deaths for Latinos increased 53.6 percent, the largest
percentage increase of all racial and ethnic groups.38 A recent ASPE analysis found that the provisional COVID-
19 age-adjusted death rate per 100,000 persons for Latinos was more than double the rate for non-Latino
Whites (288 v. 124).39 In addition, the vaccination rate for Latinos lagged behind that of non-Latino Whites
earlier in the vaccination effort; in May 2021, only 57 percent of Latino adults had received at least one vaccine
dose, compared to 65 percent of non-Latino Whites. More recently, however, vaccinations for Latinos have
surged and have eliminated this disparity. Between July and September, Latino adults experienced the largest
increase in vaccine uptake of all racial and ethnic groups, and a September 2021 report indicated that 73
percent of Latino adults report having received at least one dose, compared to 71 percent of non-Latino
Whites.40 Another ASPE report found that COVID-19 vaccination has played a key role in protecting Medicare
beneficiaries against hospitalization and deaths from COVID-19, including 5,000 fewer deaths among Latino
beneficiaries between January and May 2021.41
DISCUSSION
Under ACA coverage expansions, the uninsurance rate among Latinos declined substantially. Despite
considerable progress, Latino communities continue to face significant disparities in coverage compared to
non-Latinos. Funding for ACA Marketplace outreach and enrollment assistance was drastically reduced in
2017-2018, in addition to changes in policies affecting immigrants that may have dissuaded some from
enrolling in health insurance.42 Evidence suggests that outreach and enrollment assistance are particularly
important to Latino communities;43 out of the 11 million U.S. residents who are uninsured but likely qualify for
subsidies in the ACA Marketplace (based on pre-ARP standards), 30 percent are Latino and 9 percent reside in
homes where English is not the predominant language.44 Studies have shown that Marketplace enrollment
increases in association with greater levels of advertising.45,46 Further, studies have found that there are
differences in messaging between Spanish and English ads, with Spanish-language ads more likely to mention
October 2021 ISSUE BRIEF 10enrollment assistance compared to English-language ads.47 Culturally-tailored outreach and marketing for the
ACA Marketplaces are important in closing the gaps in coverage among Latinos, particularly among Latinos
who reside in predominantly Spanish-speaking households and who are eligible for subsidies. More personal
approaches to enrollment assistance are known to be beneficial in enrolling Latinos, particularly those who
predominantly speak Spanish, into coverage. Studies suggest that Latinos are more likely than other groups to
receive in-person enrollment assistance and that those who did were more likely to enroll in coverage.48
Spanish-speakers are also more likely than English-speakers to prefer and seek telephone or in-person
assistance (versus online assistance).49 Spanish-language ads for ACA Marketplace were significantly more
likely to be sponsored by state Marketplaces, suggesting a relative lack of federal Marketplace advertising in
recent years may have hindered enrollment among Spanish-speaking individuals.50
With respect to access to care, we find that Latinos experienced improvements after implementation of the
ACA, though they were consistently more likely to report access to care barriers compared to non-Latinos even
after the ACA. Latinos were also more negatively affected by the COVID-19 pandemic than non-Latinos,
including adverse effects on access to care and higher COVID-19 outcomes including infections and deaths.
Increased vaccination rates in recent months among Latinos are a promising change.
Implementation of the ARP offers opportunities to make insurance coverage and health care more affordable
for all enrollees, including Latinos. The ARP increased tax credits for millions of people in order to reduce
premiums and to provide access to affordable health coverage. Under the ARP, approximately 2.6 million
Latinos who are uninsured may be eligible for zero-dollar health care plans, and 3 million may be eligible for
plans that are less than $50 per month.51,52 Increased funding from the Centers for Medicare and Medicaid
Services – approximately $80 million total, up from the $10 million in annual funding from 2017 to 2019 – will
support navigators’ outreach and educational activities, including those with a focus on culturally-responsive
interventions.53 Already, enrollment among Latinos has been increasing: during the 2021 Special Enrollment
Period, the percentage of consumers who self-reported as Latino increased to 19 percent, up from 16 percent
in 2019-2020.§54
Importantly, Latinos are very diverse in their coverage rates, economic conditions, citizenship and immigration
status, family origin, and many other factors.55 Efforts to improve coverage and health equity among Latinos
must take these differences into account as they address the health and socioeconomic needs within this
population.
CONCLUSION
Though many Latinos have gained coverage under the ACA, there is a significant and persistent disparity in
uninsured rates between Latinos and non-Latinos. This disparity is particularly pronounced in states that have
not adopted the ACA Medicaid expansion to extend coverage to adults with incomes up to 138% FPL.
Implementation of the ARP builds on this progress and makes insurance coverage more affordable for all
enrollees, including Latinos. Increased funding for enrollment outreach, Navigator assistance, and education
about coverage options can further improve coverage and access to care among Latinos. In turn, coverage and
access to care can lead to better health for Latinos, a critical step in improving health equity in the US.
_______________________
§ Among those enrollees reporting any race/ethnicity.
October 2021 ISSUE BRIEF 11REFERENCES
1
Office of Minority Health, U.S. Department of Health and Human Services. Profile: Hispanic/Latino Americans. Available
from: https://minorityhealth.hhs.gov/omh/browse.aspx?lvl=3&lvlid=64
2
Census Bureau, U.S. Department of Commerce. 2020 Census Available from:
https://data.census.gov/cedsci/table?q=hispanic&g=0100000US&tid=DECENNIALPL2020.P2&hidePreview=true
3
Office of Minority Health, U.S. Department of Health and Human Services. Profile: Hispanic/Latino Americans. Available
from:https://minorityhealth.hhs.gov/omh/browse.aspx?lvl=3&lvlid=64
4
Centers for Disease Control, Hispanic Health, Vital Signs, 2015. Available from: https://www.cdc.gov/vitalsigns/hispanic-
health/index.html
5
Institute of Medicine (US) Committee on the Consequences of Uninsurance. Care Without Coverage: Too Little, Too Late.
Washington (DC): National Academies Press (US); 2002. 3, Effects of Health Insurance on Health. Available from:
https://www.ncbi.nlm.nih.gov/books/NBK220636/#.
6
Sommers BD, Gawande A, Baicker K. Health Insurance Coverage and Health — What the Recent Evidence Tells Us. N Engl J
Med 2017; 377:586-593.
7
Aparna Soni, Laura R. Wherry, and Kosali I. Simon, “How Have ACA Insurance Expansions Affected Health Outcomes?
Findings From The Literature,” Health Affairs 39, No. 3 (2020): 371–378. DOI: 10.1377/hlthaff.2019.01436.
8
ASPE Analysis of data from the American Community Survey (ACS), 2019.
9
National Center for Health Statistics. National Health Interview Survey, 2020. Sample Adult File.
https://www.cdc.gov/nchs/nhis/2020nhis.htm 2021.
10
Whitener K, Corcoran A. Getting Back on Track: A Detailed Look at Health Coverage Trends for Latino Children. Center
for Children and Families, Georgetown University Health Policy Institute. July 8, 2021.
https://ccf.georgetown.edu/2021/06/08/health-coverage-trends-for-latino-children/
11
Finegold K, Conmy A, Chu RC, Bosworth A, and Sommers, BD. Trends in the U.S. Uninsured Population, 2010-2020.
(Issue Brief No. HP-2021-02). Washington, DC: Office of the Assistant Secretary for Planning and Evaluation, U.S.
Department of Health and Human Services. February 11, 2021.
12
Finegold K, Conmy A, Chu RC, Bosworth A, and Sommers, BD. Trends in the U.S. Uninsured Population, 2010-2020.
(Issue Brief No. HP-2021-02). Washington, DC: Office of the Assistant Secretary for Planning and Evaluation, U.S.
Department of Health and Human Services. February 11, 2021. Available at:
https://aspe.hhs.gov/system/files/pdf/265041/trends-in-the-us-uninsured.pdf.
13
UnidosUS, “Latino Unemployment Rate At 7.3%,” (Washington DC: UnidosUS, June 2021), available at
https://www.unidosus.org/publications/2167-latinos-jobs-report-latino-unemployment-rate-at-7-
3/?sequence=1&isAllowed=y
14
Kaiser Family Foundation, “Employer-Sponsored Coverage Rates for the Nonelderly by Race/Ethnicity,” (Washington
DC: Kaiser Family Foundation, 2019), available at https://www.kff.org/other/state-indicator/nonelderly-employer-
coverage-rate-by-
raceethnicity/?currentTimeframe=0&sortModel=%7B%22colId%22:%22Location%22,%22sort%22:%22asc%22%7D
15
Branham DK, Peters C, and Sommers BD. Estimates of Uninsured Adults Newly Eligible for Medicaid If Remaining Non-
Expansion States Expand (Data Point No. HP-2021-12). Washington, DC: Office of the Assistant Secretary for Planning and
Evaluation, U.S. Department of Health and Human Services. May 28, 2021. https://www.aspe.hhs.gov/reports/estimates-
medicaid-eligibility-non-expansion-states
16
Katherine Keisler-Starkey and Lisa N. Bunch, Health Insurance Coverage in the United States: 2019 (U.S. Census Bureau,
Sept. 2020).
17
U.S. Department of Health and Human Services, Fact Sheet: The American Rescue Plan: Reduces Health Care Costs,
Expands Access to Insurance Coverage and Addresses Health Care Disparities, March 12, 2021. Accessed at:
https://www.hhs.gov/about/news/2021/03/12/fact-sheet-american-rescue-plan-reduces-health-care-costs-expands-
access-insurance-coverage.html.
18
Branham DK, Conmy AB, DeLeire T, Musen J, Xiao X, Chu RC, Peters C, and Sommers BD. Access to Marketplace Plans
with Low Premiums on the Federal Platform, Part II: Availability Among Uninsured Non-Elderly Adults Under the American
Rescue Plan (Issue Brief No. HP-2021-08). Washington, DC: Office of the Assistant Secretary for Planning and Evaluation,
October 2021 ISSUE BRIEF 12U.S. Department of Health and Human Services. April 1, 2021. https://www.aspe.hhs.gov/reports/access-marketplace- plans-low-premiums-uninsured-american-rescue-plan 19 Bosworth A, Finegold K, and Ruhter J. The Remaining Uninsured: Geographic and Demographic Variation (Issue Brief No. HP-2021-06). Washington, DC: Office of the Assistant Secretary for Planning and Evaluation, U.S. Department of Health and Human Services. March 23, 2021. 20 Artiga S, Hamel L, Kearney A, Stokes M, Safarpour A. Health and Health Care Experience Health and Health Care Experiences of Hispanic Adults. July 2021. Available from: https://www.kff.org/coronavirus-covid-19/poll-finding/health- and-health-care-experiences-of-hispanic-adults/ 21 Sommers BD, Allen H, Bhanja A, Blendon RJ, Orav EJ, Epstein AM. Assessment of Perceptions of the Public Charge Rule Among Low-Income Adults in Texas. JAMA Netw Open. 2020;3(7):e2010391. doi:10.1001/jamanetworkopen.2020.10391 22 Office of Disease Prevention Health Promotion, Centers for Disease Control and Prevention. Healthy People 2030. Available from https://health.gov/healthypeople/objectives-and-data/browse-objectives/preventive-care 23 Starfield B, Shi L, Macinko J. Contribution of primary care to health systems and health. Milbank Q. 2005;83(3):457-502. doi: 10.1111/j.1468-0009.2005.00409.x. PMID: 16202000; PMCID: PMC2690145. 24 DeVoe JE, Fryer GE, Phillips R, Green L. Receipt of preventive care among adults: insurance status and usual source of care. Am J Public Health. 2003;93(5):786-791. 25 Bindman AB, Grumbach K, Osmond D, Vranizan K, Stewart AL. Primary care and receipt of preventive services. J Gen Intern Med. 1996;11(5):269-276. 26 Blewett LA, Johnson PJ, Lee B, Scal PB. When a usual source of care and usual provider matter: adult prevention and screening services. J Gen Intern Med. 2008;23(9):1354-1360. 27 Doescher MP, Saver BG, Fiscella K, Franks P. Preventive care. J Gen Intern Med. 2004;19(6):632-637. 28 Petterson SM, Rabin D, Phillips RL Jr, Bazemore AW, Dodoo MS. Having a usual source of care reduces ED visits. Am Fam Physician. 2009;79(2):94-95. 29 DeVoe JE, Tillotson CJ, Lesko SE, Wallace LS, Angier H. The case for synergy between a usual source of care and health insurance coverage. J Gen Intern Med. 2011;26(9):1059-1066. 30 Chen, Jie, et al. “The Health Effects of Cost-Related Treatment Delays.” American Journal of Medical Quality, vol. 26, no. 4, July 2011, pp. 261–271, doi:10.1177/1062860610390352. 31 Kaul, S., Avila, J.C., Mehta, H.B., Rodriguez, A.M., Kuo, Y.-F. and Kirchhoff, A.C. (2017), Cost-related medication nonadherence among adolescent and young adult cancer survivors. Cancer, 123: 2726-2734. Available from https://doi.org/10.1002/cncr.30648 32 Khera, Rohan, et al. "Cost-related medication nonadherence in adults with atherosclerotic cardiovascular disease in the United States, 2013 to 2017." Circulation 140.25 (2019): 2067-2075. 33 Himmelstein J, Himmelstein D, Woolhandler S, Bor D, Gaffney A, Zallman L, Dickman S, McCormick D. Health Care Spending And Use Among Hispanic Adults With And Without Limited English Proficiency, 1999–2018 HEALTH AFFAIRS VOL. 40, NO. 7 : Available from https://www.healthaffairs.org/doi/full/10.1377/hlthaff.2020.02510 34 National Center for Health Statistics, Centers for Disease Control and Prevention, National Health Interview Survey, 2020 Survey Description. Available from https://ftp.cdc.gov/pub/Health_Statistics/NCHS/Dataset_Documentation/NHIS/2020/srvydesc-508.pdf 35 Gangopadhyaya, Anuj, Michael Karpman, and Joshua Aarons. "As the COVID-19 recession extended into the summer of 2020, more than 3 million adults lost employer-sponsored health insurance coverage and 2 million became uninsured." Washington, DC: Urban Institute (2020). 36 Figueroa JF, Khorrami P, Bhanja A, Orav EJ, Epstein AM, Sommers BD. COVID-19–Related Insurance Coverage Changes and Disparities in Access to Care Among Low-Income US Adults in 4 Southern States. JAMA Health Forum. 2021;2(8):e212007. doi:10.1001/jamahealthforum.2021.2007 37 Figueroa J, Wadhera R, Lee D, Yeh R, Sommers B. “Community-Level Factors Associated With Racial And Ethnic Disparities In COVID-19 Rates In Massachusetts” Health Affairs, November 2020, Vol. 39 No. 11: Available from https://www.healthaffairs.org/doi/pdf/10.1377/hlthaff.2020.01040 38 Rossen LM, Branum AM, Ahmad FB, Sutton P, Anderson RN. Excess Deaths Associated with COVID-19, by Age and Race and Ethnicity — United States, January 26–October 3, 2020. MMWR 2020;69:1522– 1527. Available from http://dx.doi.org/10.15585/mmwr.mm6942e2 October 2021 ISSUE BRIEF 13
39
   Simmons A, Chappel A, Kolbe AR, Bush L, and Sommers BD. Health Disparities by Race and Ethnicity During the COVID-
19 Pandemic: Current Evidence and Policy Approaches. Washington, DC: Office of the Assistant Secretary for Planning and
Evaluation, U.S. Department of Health and Human Services. March 16, 2021.
40
   Hamel, Liz, et al. “KFF COVID-19 Vaccine Monitor: September 2021.” KFF, Kaiser Family Foundation, 28 Sept. 2021.
Available from https://www.kff.org/coronavirus-covid-19/poll-finding/kff-covid-19-vaccine-monitor-september-2021/.
41
   Samson, LW, Tarazi, W, Orav, EJ, Sheingold, S, De Lew, N and Sommers, BD. Associations Between County-level
Vaccination Rates and COVID-19 Outcomes Among Medicare Beneficiaries. (Research Report No. HP-2021-23).
Washington, DC: Office of the Assistant Secretary for Planning and Evaluation, U.S. Department of Health and Human
Services. October, 2021. https://aspe.hhs.gov/sites/default/files/documents/8d15a6223df12fcb59de1f031adb1eec/aspe-
covid-medicare-vaccine-analysis.pdf
42
   Corlette, Sabrina, and Rachel Schwab. "States Lean In as the Federal Government Cuts Back on Navigator and
Advertising Funding for the ACA’s Sixth Open Enrollment." Commonwealth Fund, October 26 (2018).
43
   Issue Brief No. HP-2021-21 “Reaching the Remaining Uninsured: An Evidence Review on Outreach & Enrollment
Strategies. https://aspe.hhs.gov/reports/reaching-remaining-uninsuredoutreach-enrollment Washington, DC: Office of
the Assistant Secretary for Planning and Evaluation, U.S. Department of Health and Human Services. October, 2021.
44
   ASPE (2021) State, County, and Local Estimates of the Uninsured Population: Prevalence and Key Demographic
Features. https://aspe.hhs.gov/reports/state-county-local-estimates-uninsured-population-prevalence-key-demographic-
features
45
   Karaca-Mandic, Pinar, et al. "The volume of tv advertisements during the ACA’s first enrollment period was associated
with increased insurance coverage." Health Affairs 36.4 (2017): 747-754.
46
   Gollust, S. E., Wilcock, A., Fowler, E. F., Barry, C. L., Niederdeppe, J., Baum, L., & Karaca-Mandic, P. (2018). TV
advertising volumes were associated with insurance marketplace shopping and enrollment in 2014. Health Affairs, 37(6),
956-963.
47
   Barry CL, Bandara S, Arnold KT, Kemmick Pintor J, Baum LM, Niederdeppe J, et al. (2018). Assessing the content of
television health insurance advertising during three open enrollment periods of the ACA. Journal of Health Politics, Policy
and Law, 43(6), 961–989.
48
   Garcia Mosqueira A, & Sommers B (2016). Better Outreach Critical to ACA Enrollment, Particularly for Latinos.
Washington, D.C: The Commonwealth Fund; Available from https://www.commonwealthfund.org/blog/2016/better-
outreach-critical-aca-enrollment-particularly-latinos
49
   Bye L (2014). Covered California: Consumer Tracking Survey. San Francisco, CA: National Opinion Research Center;
Retrieved from https://hbex.coveredca.com/data-research/library/NORC%20Consumer%20Tracking%20Report.pdf
50
   Kemmick Pintor, J., Alberto, C. K., Arnold, K. T., Bandara, S., Baum, L. M., Fowler, E. F., Gollust, S. E., Niederdeppe, J., &
Barry, C. L. (2020). Targeting of Enrollment Assistance Resources in Health Insurance Television Advertising: A Comparison
of Spanish- Vs. English-Language Ads. Journal of health communication, 25(8), 605–612. Available from
https://doi.org/10.1080/10810730.2020.1818150
51
   Katie Keith (2021) Record-High Marketplace Enrollment, New Census Data, And More. Available from
https://www.healthaffairs.org/do/10.1377/hblog20210921.302725/full/
52
   U.S. Department of Health and Human Services, Press Release. HHS Announces Commitments from Partners to
Encourage Latino Consumers to Enroll in Health Insurance Coverage through HealthCare.gov. Available from
https://www.hhs.gov/about/news/2021/04/19/hhs-announces-commitments-from-partners-to-encourage-latino-
consumers.html
53
   Katie Keith (2021). Marketplace Enrollment Tops 12 Million For 2021; Largest-Ever Funding For Navigators. Available
from https://www.healthaffairs.org/do/10.1377/hblog20210422.65513/full/
54
   Centers for Medicare & Medicaid Services, US Department of Health and Human Services. 2021 FINAL MARKETPLACE
SPECIAL ENROLLMENT PERIOD REPORT. Available from https://www.hhs.gov/sites/default/files/2021-sep-final-
enrollment-report.pdf
55
   Gonzales S, Sommers BD. Intra-Ethnic Coverage Disparities among Latinos and the Effects of Health Reform. Health Serv
Res. 2018 Jun;53(3):1373-1386. doi: 10.1111/1475-6773.12733. Epub 2017 Jun 28. PMID: 28660697; PMCID:
PMC5980375.

 October 2021                                                                                            ISSUE BRIEF       14
HP-2021-22

U.S. DEPARTMENT OF HEALTH AND HUMAN SERVICES
Office of the Assistant Secretary for Planning and Evaluation

200 Independence Avenue SW, Mailstop 447D
Washington, D.C. 20201

For more ASPE briefs and other publications, visit:
aspe.hhs.gov/reports

SUGGESTED CITATION
Issue Brief No. HP-2021-2 “Health Insurance Coverage
and Access to Care Among Latinos: Recent Trends and Key Challenges”
https://aspe.hhs.gov/reports/health-insurance-coverage-access-care-among-latinos
Washington, DC: Office of the Assistant Secretary for Planning and Evaluation,
U.S. Department of Health and Human Services. October 2021.

COPYRIGHT INFORMATION
All material appearing in this report is in the public domain and
may be reproduced or copied without permission; citation as to
source, however, is appreciated.

DISCLOSURE
This communication was printed, published, or produced and
disseminated at U.S. taxpayer expense.
___________________________________

Subscribe to ASPE mailing list to receive
email updates on new publications:
https://list.nih.gov/cgi-bin/wa.exe?SUBED1=ASPE-HEALTH-POLICY&A=1

For general questions or general
information about ASPE:
aspe.hhs.gov/about

 October 2021                                                                      ISSUE BRIEF   15
You can also read


