THE ECONOMIC IMPACT OF PROVIDENCE HEALTH & SERVICES SOUTHERN CALIFORNIA
←
→
Page content transcription
If your browser does not render page correctly, please read the page content below
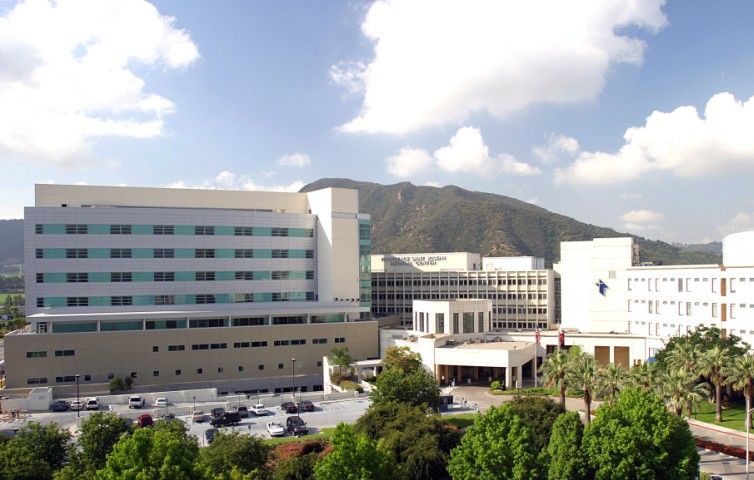
Photos: Providence Health & Services

   THE ECONOMIC IMPACT
            OF
PROVIDENCE HEALTH & SERVICES
    SOUTHERN CALIFORNIA

 Los Angeles County Economic Development Corporation
Los Angeles County Economic Development Corporation
444 S. Flower Street, 37th Floor Los Angeles, CA 90071
(888) 4-LAEDC-1 www.LAEDC.org
Christine Cooper, Ph.D.
Myasnik Poghosyan
Shannon M. Sedgwick
June 2012
This report was commissioned by Providence Health & Services Southern California.
The LAEDC Economic and Policy Analysis Group offers objective economic and policy research for public agencies
and private firms. The group focuses on economic impact studies, regional industry analyses, economic forecasts and
issue studies, particularly in water, transportation, infrastructure and environmental policy.
Every reasonable effort has been made to ensure that the data contained herein reflect the most accurate and timely
information possible and they are believed to be reliable.
The report is provided solely for informational purposes and is not to be construed as providing advice,
recommendations, endorsements, representations or warranties of any kind whatsoever.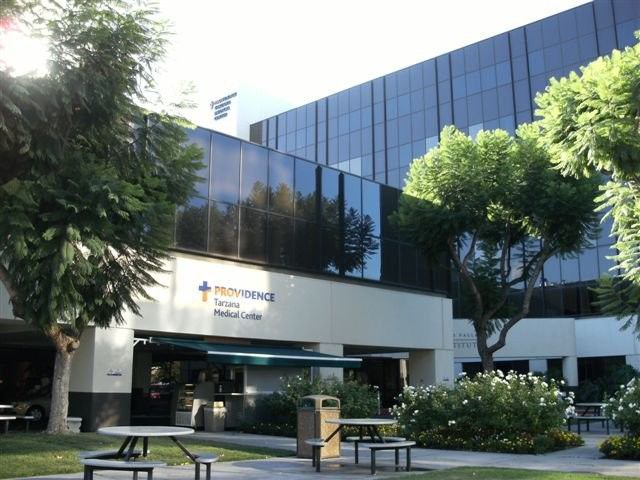
Executive Summary
Economic Activity of Providence Health &
Services Southern California                           The total economic impact is spread across the
                                                       region. More than 92 percent of the total
Providence Health & Services Southern California       employment impact occurs in Los Angeles
(PHSSC) owns and operates a network of five            County, with the remaining 8 percent distributed
well-renowned, general acute care hospitals across     throughout the other five counties of the
Los Angeles County, including Little Company of        Southern California region (Orange, Riverside,
Mary Medical Center San Pedro, Little Company          San Bernardino, Santa Barbara and Ventura).
of Mary Medical Center Torrance, Holy Cross
Medical Center in Mission Hills, Saint Joseph
Medical Center in Burbank and Tarzana Medical          Hospital Construction Spending
Center.
                                                       The hospital industry continues to invest in
According to data for 2010 from the California         construction projects at new and existing facilities,
Office of Statewide Health Planning and                and carry out retrofits motivated by regulatory
Development (OSHPD), the five Providence               mandates. In 2010, this spending reached $86.9
hospitals reported 1,548 available beds, with an       million at the five Providence Health & Services
average occupancy rate of 73 percent. The              hospitals. The total economic impact was almost
hospitals in aggregate provided nearly 410,900         $186 million in economic output in the six-county
inpatient days, with general acute care accounting     Southern California region, supporting 1,210 full-
for 75 percent. Almost 713,000 outpatient visits       and part-time jobs with labor income of more
were made to the Providence hospitals, of which        than $69 million. It is estimated that this spending
one-third were emergency department visits.            generated $7.7 million in state and local taxes
                                                       through its contribution to activity in the region.
These data do not capture the additional activity
related to the operations of the new patient care
                                                         Economic and Fiscal Impact of PHSSC Operations
wing at Providence Holy Cross Medical Center,            (So-Cal Region, 2010)
which was completed in 2011 and added 138 new
inpatient beds.                                          Estimated Annual Revenue ($ millions):          $   1,381.5

                                                         Total Economic Impact:
                                                          Output ($ millions)                            $  3,074.0
Hospital Operations                                       Employment (jobs)                                21,250.0
                                                          Labor income ($ millions)                      $ 1,330.3
The total economic impact of the five Providence
hospitals extends beyond the activity generated          Total Fiscal Impact ($ millions):               $    153.9
within the health care sector itself. Wages paid to      Source: Estimates by LAEDC

staff and payments made for purchases of goods
and services circulate throughout the economy            Economic and Fiscal Impact of PHSSC
                                                         Construction Spending
generating additional indirect and induced activity.     (So-Cal Region, 2010)

It is estimated that in 2010 the Providence              Estimated Construction Spending ($ millions):   $     86.9
hospitals generated $3.1 billion in total economic
                                                         Total Economic Impact:
output in the six-county Southern California
                                                          Output ($ millions)                            $   185.7
region and supported 21,250 full- and part-time           Employment (jobs)                                1,210.0
jobs with total labor income (including benefits)         Labor income ($ millions)                      $    69.2
of $1.3 billion. This economic activity is estimated
to have generated $154 million in state and local        Total Fiscal Impact ($ millions):               $      7.7
taxes.                                                   Source: Estimates by LAEDC
This page intentionally left blank
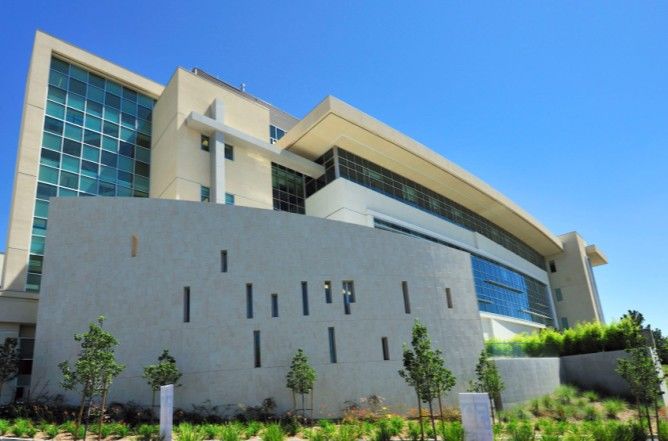
Table of Contents

INTRODUCTION
1 Providence Health & Services Southern California                3
    Hospital Accreditations and Certifications               4

2 The Health Care Sector                                          5
    Southern California Region                               5
    Los Angeles County                                       7
    Health Care Occupations                                  9

ECONOMIC ANALYSIS
3 Ongoing Operations of Providence Southern California           13
    Economic Activity                                       13
    Economic and Fiscal Impact                              14
    Occupational Analysis                                   16

4 Construction Spending of Providence Southern California        17
    Economic and Fiscal Impact                              17

APPENDIX
A1 Methodology                                                   A-3

A2 Description of Industry Sectors                               A-4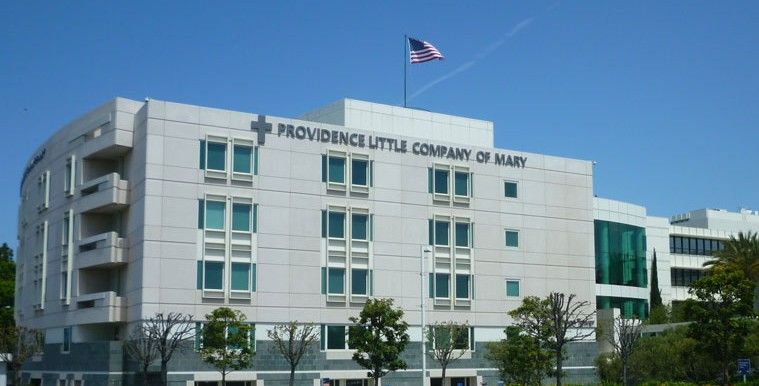
This page intentionally left blank

INTRODUCTION

                   1
               1
This page intentionally left blank

Economic Impact Analysis                                               Providence Health & Services Southern California

    1 Providence Health & Services Southern California

    P
         rovidence Health & Services Southern
         California (PHSSC) owns and operates a
         network of five well renowned, general acute
    care hospitals including: Little Company of Mary
    Medical Center San Pedro, Little Company of
    Mary Medical Center Torrance, Holy Cross
    Medical Center in Mission Hills, Saint Joseph
    Medical Center in Burbank and Tarzana Medical
    Center. Together their 1,544 available beds (of the
    1,632 licensed beds) provide inpatient and
    outpatient care, emergency and diagnostic services
    to communities throughout Los Angeles County.

    Providence Little Company of Mary Medical
    Center San Pedro offers medical services that                                     Photo: Health Care Design Magazine
    include acute rehabilitation, sub-acute care,
    obstetrical emergency, behavioral health, chemical    rehabilitation services, surgery, digestive disorders
    dependency, a sexual assault response team            and women’s and children’s services. It is one of
    (SART) and senior psychiatric services. It was the    only two hospitals in the San Fernando Valley
    first hospital to earn the Gold Seal of Approval      approved and accredited as a Level II Trauma
    from the Joint Commission for Advanced Primary        Center. It was designated as one of L.A. County’s
    Stroke Centers and is the only acute rehabilitation   first DHS approved ST-Elevation Myocardial
    provider for patients with major neurological and     Infarction (STEMI) Receiving Centers for patients
    orthopedic conditions in the Los Angeles Harbor       with severe heart attacks. Holy Cross just
    and South Bay communities.                            completed construction of a new, four-story,
                                                          LEED Silver certified, 132,000 square-foot wing,
    Providence Little Company of Mary Medical             housing an additional 138 beds for patient care,
    Center Torrance offers medical services that          which also houses the first neonatal intensive care
    include da Vinci robotic surgery for gynecologic,     unit (NICU) serving the northeast San Fernando
    urologic and cardiac procedures, and a heart          and Santa Clarita Valleys.
    center offering 24-hour coronary angioplasty and
    open heart surgery. Designated as a Level III         Providence Saint Joseph Medical Center in the
    Neonatal Intensive Care Unit, the hospital offers     City of Burbank offers medical services that
    fetal diagnostic testing and genetic counseling,      include bariatrics, diabetes care, emergency care,
    along with other women’s and children’s services.     gastrointestinal services, cardiology and vascular,
    It has earned the Gold Seal of Approval from the      imaging, neurosciences, nutritional counseling,
    Joint Commission for Advanced Primary Stroke          oncology, orthopedics, rehabilitation, surgery and
    Centers and serves as a paramedic base station for    women’s health services. The hospital was also
    the City of Torrance and part of the Palos Verdes     designated as one of L.A. County’s first DHS
    Peninsula.                                            approved STEMI Receiving Center for patients
                                                          with severe heart attacks and has earned several
    Providence Holy Cross Medical Center in the City      awards in their treatment of strokes including, the
    of Mission Hills offers medical services that         Joint Commission for Advanced Primary Stroke
    include trauma and emergency services, a cancer       Centers, the American Stroke Association and the
    center, a heart center, a state-of-the-art imaging    Providence Health and Services President’s Award
    center, vascular, orthopedics, neurosciences,         of Excellence.

     Economic and Policy Analysis Group                                                                               3
Providence Health & Services Southern California Economic Impact Analysis
Providence Tarzana Medical Center offers medical
services that include diabetes care, gastrointestinal
services, cardiology, imaging, oncology,
orthopedics, ostomy services, pediatrics,
rehabilitation, surgery, transfusion-free surgery,
vascular care, senior, women’s and children’s
services and wound center services. It has one of
the largest neonatal intensive care units in the San
Fernando Valley, with a surgery certification from
California Children’s Services (CSS), and it
receives pediatric and neonatal patients with
surgical needs from other hospitals in the area. It
has the only certified carotid stinting program in
the area.
Photo: Smith Group Architects
Providence hospitals together contribute more to
the Los Angeles region than health care services.
They provided over $91 million in community
benefits to patients and their families in the
community, numbering nearly 140,000 individuals.
Classes on illnesses and conditions, as well as
support groups, are available for patients and their
family and friends, and subsidies are available for
financial assistance for patients, medical education
and research programs for staff, and wellness and
prevention programs. They operate Providence
High School, a Blue Ribbon college-preparatory
campus. Providence Health & Services also
contributes community-building donations for
local neighborhoods and the surrounding
Photo: Providence Health & Services
communities of their hospitals, including
numerous outreach programs and clinics. independent non-profit organization which
accredits and certifies health care organizations
and programs across the U.S. All state specific
Hospital Accreditations and legislation and regulation pertaining to hospitals
for their accreditation and certification criteria are
Certifications monitored by the Joint Commission. California,
through its Department of Public Health,
Given the myriad compliance requirements (CCR, contracts with the Joint Commission in their
Titles 22 and 24, Federal Regulations Title 42, etc.) quality of care oversight for licensing (as stated in
many hospitals obtain certifications or the California Health and Safety Code § 1282).
accreditations from organizations that cross-walk
the federal, state and local requirements. An In addition to the Joint Commission accreditation,
accreditation applies to an entire health care
individual Providence hospitals obtain additional
organization, such as a whole hospital, while
certification is earned according to each program accreditations and certifications for their specialty
or services within a health care organization. care units. For facility specific examples, please
refer to the individual Providence Health and
Providence hospitals are all accredited by the Joint Services hospital reports.
Commission (formerly, the Joint Commission on
Accreditation of Health Care Organizations), an
4 Economic and Policy Analysis GroupEconomic Impact Analysis Providence Health & Services Southern California
2 The Health Care Sector
Southern California Region
Exhibit 2-1
Health Care Services in Southern California (2010)
The health care sector is composed of several
# of
inter-related and supporting industries, including Establishments
ambulatory health care services, hospitals, and Hospitals:
nursing and residential care facilities. The sector as General Medical and Surgical Hospitals1 211
a whole has been growing over the past decade Other Hospitals2 313
and is likely to be a driver of economic activity Nursing and Residential Care Facilities 3,278
Offices of Health Care Practitioners 32,140
going forward as our population grows, as it ages, Outpatient Care Centers 1,553
and as medical advances extend our productive Medical and Diagnostic Laboratories 912
lives. Home Health Care Services 1,350
39,822
Hospitals, health care centers, doctors’ offices and TOTAL Establishments
laboratories provide access to a variety of vital % of all Establishments in Region 6.05%
health care services, employing thousands of Source: CA EDD
workers, and generating significant revenues and 1 Includes federal, state and county general medical and surgical hospitals
tax dollars. such as VA hospitals
2 Includes psychiatric and substance abuse hospitals and specialty hospitals
There were nearly 40,000 private and public
establishments and almost 667,500 payroll Exhibit 2-2
employees in the health care sector, representing Employment by Industry (2010) Hospitals
9.8 percent of all payroll employment in the
Southern California region. Offices of health care 35,745
Nursing and Residential
practitioners is the largest industry by number of 17,623 Care Facilities
establishments, but the hospital industry employs 238,176
Offices of Physicians and
more workers, providing 238,176 jobs. 41,294 Other Practitioners
Outpatient and Other
These data do not include the self-employed or Ambulatory Health Services
freelance workers, which would add an estimated 218,893
115,763
Medical and Diagnostic
69,000 workers, many of whom are health care Laboratories
practitioners or work in home health care services.
Home Health Care Services
Source: CA EDD
Payroll employment in this sector has been
growing over the past twenty years. In 1990,
employment in the Southern California region in
Exhibit 2-3
the health care industry was 474,141, growing to Employment (2010)
667,494 in 2010. Growth has accelerated in the 700
All Workers
8.0
(right axis)
past decade, averaging approximately 2.3 percent
650 7.0
on an annual basis since 2000, compared to 1.1
600
percent per year in the prior decade.
Thousands
6.0
Millions
550
5.0
500
In the six-county region as a whole, total payroll Health Care
450 4.0
employment has not shown such a steady increase Sector (left axis)
over the period, and indeed experienced a 400 3.0
1990 1994 1998 2002 2006 2010
dramatic decline during the recession.
Source: CA EDD
Economic and Policy Analysis Group 5Providence Health & Services Southern California Economic Impact Analysis
Wages
Wages in the health care sector vary by industry,
as shown in Exhibit 2-4. Average wages were Exhibit 2-4
highest in hospitals in 2010, reaching $63,199, and Average Annual Wages by Industry (2010)
lowest in nursing and residential care facilities
where workers earned an average of $29,097. Hospitals $63,199
Physicians and Other Practicioners $59,304
Overall, the average annual wage in the health care Medical and Diagnostic Labs $56,940
industry in the Southern California region in 2010 Outpatient and Other Ambulatory Care $50,141
was $53,355. Home Health Care Services $30,830
Nursing and Residential Care Facilities $29,097
The purchasing power of earnings in the health All Health Care Services $53,355
care sector has been improving recently, but this
has not always been the case. In the 1990s, for Source: CA EDD
example, real wages deteriorated, reaching a low in
1997. However, real wages have shown
improvement since 2000 and in particular during
the last two years. This is in contrast to the Exhibit 2-5
average real wages for all workers in Los Angeles Average Annual Wages
County, which grew through 2000 but which have $56
Thousands of $2010
remained flat since.
$52
$48
Output Total Health Care
$44
Total All Industries
The economic census of 2007 reports revenues by $40
industry. The health care sector as a whole is 1990 1994 1998 2002 2006 2010
estimated to have had total revenues of more than
$48 billion in 2007 in the six-county region. Source: CA EDD
Additional revenues earned by the self-employed
are estimated to have been $2.2 billion.
Exhibit 2-6
Health Care Services Output (2007)
In 2010, the health care sector Estimated
Revenues
employed almost 667,500 people ($ billions)
in the six-county Southern Hospitals $ 20.5
California region, with an Offices of Health Care Practitioners 14.2
average annual wage of $53,335. Nursing and Residential Care Facilities
Outpatient and Other Ambulatory Health Care
4.0
2.6
Medical and Diagnostic Laboratories 1.2
In 2007 (the most recent year for Home Health Care Services 1.3
which data are available), total TOTAL Revenues $ 48.1
revenues exceeded $48 billion. Source: BLS
6 Economic and Policy Analysis GroupEconomic Impact Analysis Providence Health & Services Southern California
Los Angeles County
Exhibit 2-7
Across Los Angeles County, hospitals, health care Health Care Services in Los Angeles County (2010)
centers, doctors’ offices and laboratories provide # of
access to a variety of vital health care services, Establishments
employing thousands of workers, and generating Hospitals:
significant revenues and tax dollars. General Medical and Surgical Hospitals1 121
Other Hospitals2 181
The health care sector is composed of several Nursing and Residential Care Facilities 1,719
inter-related and supporting industries, including Offices of Health Care Practitioners 18,219
ambulatory health care services, hospitals, and Outpatient Care Centers 885
nursing and residential care facilities. The sector as Medical and Diagnostic Laboratories 484
Home Health Care Services 826
a whole has been growing over the past decade
and is likely to be a driver of economic activity TOTAL Establishments 22,441
going forward as our population grows, as it ages, % of all LAC Establishments 5.3%
and as medical advances extend our productive Source: CA EDD
1 Includes federal, state and county general medical and surgical hospitals such
lives. as VA hospitals
2 Includes psychiatric and substance abuse hospitals and specialty hospitals
There were more than 22,400 private and public
establishments and almost 390,000 payroll
employees in the health care sector, representing Exhibit 2-8
10.1 percent of all payroll employment in Los Employment by Industry (2010)
Hospitals
Angeles County. Offices of health care
practitioners is the largest industry by number of 20,710
Nursing and Residential
establishments, but the hospital industry employs 9,427 Care Facilities
more workers, providing 146,340 jobs. 26,153
146,340 Offices of Physicians and
Other Practitioners
These data do not include the self-employed or
Outpatient and Other
freelance workers, which would add an estimated Ambulatory Health Services
119,946
41,000 workers, many of whom are health care 67,085
Medical and Diagnostic
practitioners or work in home health care services. Laboratories
Home Health Care Services
Payroll employment in this sector has been Source: CA EDD
growing over the past twenty years. In 1990,
employment in Los Angeles County in the health
care industry was 306,582, growing to 389,661 in
2010. Growth has accelerated in the past decade, Exhibit 2-9
averaging approximately 1.9 percent on an annual Employment (2010)
basis since 2000, compared to 0.4 percent per year 380 4.4
All Workers
in the prior decade. (right axis) 4.2
360 4.0
In the county as a whole, total payroll
Thousands
Millions
3.8
employment has not shown such a steady increase 340
3.6
over the period, and indeed experienced a 3.4
dramatic decline during the recession. 320
Health Care
3.2
Sector (left axis)
300 3.0
1990 1994 1998 2002 2006 2010
Source: CA EDD
Economic and Policy Analysis Group 7Providence Health & Services Southern California Economic Impact Analysis
Wages
Exhibit 2-10
Wages of health care workers vary by industry, as Average Annual Wages by Industry (2010)
shown in Exhibit 2-10. Average wages are highest
in hospitals, reaching $65,379 annually, and lowest Hospitals $65,379
in nursing and residential care facilities where Physicians and Other Practicioners $59,487
workers earned an average of $29,089 in 2010. Medical and Diagnostic Labs $52,784
Outpatient and Other Ambulatory Care $52,014
Overall, the average annual wage in the health care Home Health Care Services $29,440
industry in Los Angeles County in 2010 was Nursing and Residential Care Facilities $29,089
$54,287. All Health Care Services $54,287
The purchasing power of earnings in the health Source: CA EDD
care sector has been improving recently, but this
has not always been the case. In the 1990s, for
example, real wages deteriorated, reaching a low in Exhibit 2-11
1997. However, real wages have shown Average Annual Wages
improvement since 2000 and in particular during $56
Thousands of $2010
the last two years. This is in contrast to the
average real wage for all workers in Los Angeles $52
County, which grew through 2000 and remained
relatively flat until just this last year. $48 Health Care Sector
All Workers
$44
1990 1994 1998 2002 2006 2010
Source: CA EDD
8 Economic and Policy Analysis GroupEconomic Impact Analysis Providence Health & Services Southern California
Health Care Occupations
Exhibit 2-13
Practitioner and Technical Services Occupations (2010)
Annual
Employment average
Occupation
in So-Cal wage in CA
Registered Nurses 136,920 $ 88,714
Licensed Practical and Vocational Nurses 38,480 51,200
Pharmacy Technicians 16,850 37,805
All Other Physicians and Surgeons 13,580 194,356
Pharmacists 13,560 120,488
Medical Records/ Information Techs 10,530 40,076
Radiologic Technologists/Technicians 9,270 66,972
Medical and Clinical Lab Technicians 8,960 42,887
Physical Therapists 8,880 85,801
EMTs and Paramedics 8,420 36,650
Dental Hygienists 8,250 91,492
Dentists, General 7,720 148,832
Respiratory Therapists 7,680 68,933
All Other Health Technologists 6,870 47,053
There are many occupations in the healthcare Medical and Clinical Lab Technologists 6,380 76,686
sector, as shown in Exhibit 2-12. Almost 40 Psychiatric Technicians 5,230 53,387
Surgical Technologists 5,210 49,514
percent of employees are healthcare practitioners
Veterinary Technologists/Technicians 5,110 35,798
such as physicians and nurses. An additional 22.6 Physician Assistants 4,870 94,980
percent are in healthcare support occupations. Speech-Language Pathologists 4,840 83,068
Other occupations include managers, Family and General Practitioners 4,750 170,389
administrative workers, food preparation workers, Occupational Therapists 4,380 85,510
teachers and maintenance personnel. All Other Health /Tech Workers 3,810 73,397
Opticians, Dispensing 3,700 37,800
Internists, General 3,100 188,186
Diagnostic Medical Sonographers 3,080 78,349
Exhibit 2-12 Healthcare Practicioner
Occupational Makeup of Health Care Dietitians and Nutritionists 2,850 65,944
Healthcare Support Pediatricians, General 2,770 168,035
4.1%
1.3% Office and Administration All others 27,780 n/a
2.8% All 383,830 $ 86,990
Personal Care and Service
3.2% 38.7%
Source: BLS
Food Prep and Serving
3.2%
Personal Care and Service
3.2% Exhibit 2-14
3.6% Management Healthcare Support Occupations (2010)
17.2% Building Maintenance Annual
Employment average
22.6% Occupation
Business and Financial in So-Cal wage in CA
Source: BLS All Other Occupations Nursing Aides, Orderlies, and Attendants 61,020 $ 28,297
Medical Assistants 49,070 31,678
Home Health Aides 31,820 23,154
Dental Assistants 25,320 35,764
The Bureau of Labor Statistics lists 51 separate All Other Healthcare Support Workers 14,990 36,401
occupations in the healthcare practitioner Pharmacy Aides 5,100 25,349
occupational group, and an additional 14 Massage Therapists 4,490 39,440
occupations in the healthcare support Physical Therapist Aides 3,710 27,738
Medical Equipment Preparers 3,670 31,062
occupational group. Exhibits 2-13 and 2-14 list the
Physical Therapist Assistants 3,040 58,533
largest individual occupations by employment in Medical Transcriptionists 2,940 42,979
both of these occupational groups in the six- Veterinary Assistants 2,940 26,719
county Southern California region in 2010, along All others 4,520 n/a
with the average annual wage paid for employees All 212,630 $ 30,600
in these occupations in California. Source: BLS
Economic and Policy Analysis Group 9This page intentionally left blank
ECONOMIC
ANALYSIS

                11
           11
This page intentionally left blank
Economic Impact Analysis Providence Health & Services Southern California
3 Ongoing Operations of Providence Health & Services
Southern California
Economic Activity
Data compiled by the State of California Office of These data do not capture the additional activity
Statewide Health Planning and Development related to the operations of the new patient care
(OSHPD) provide insight into the capabilities and wing of Providence Holy Cross Medical Center,
activity at reporting hospitals. Summary data for which was completed in 2011 and added 138 new
the five hospitals of Providence Health & Services inpatient beds.
Southern California (PHSSC) are shown in
Exhibit 3-1. Hospital operations generate substantial revenues,
employment and labor income. A summary of the
activity of the five hospitals is shown below.
Exhibit 3-1
Providence Health & Services Southern California (2010)
Exhibit 3-2
Economic Activity of Hospital Operations (2010)
Beds:
Licensed 1,636
$ millions
Available 1,548
Occupancy Rates: Net Patient Revenue $ 1,347.8
Licensed Beds 69.0% Other Operating Revenue 20.8
Available Beds 72.9% Non-Operating Revenue 12.9
Patients Days: Purchases:
General Acute Care 308,347 Supplies $ 205.8
Psychiatric Care 7,058 Services 193.8
Chemical Dependency 4,016 Leases and rentals 11.1
Rehabilitation 12,629 Other 168.2
Long-term Care 78,845
Total 410,895 Salaries and wages $ 522.1
Employee benefits 153.9
Discharges: 71,804 Physician professional fees 19.1
Other professional fees 31.1
Outpatient Visits:
Source: California Office of Statewide Health Planning and Development
Emergency Room 235,842
All Other Outpatients 477,043
Total 712,885
Source: California Office of Statewide Health Planning and Development The five hospitals received $1.35 billion in net
patient revenue and $34 million in other revenue.
The five hospitals together reported 1,636 licensed They spent $579 million in purchases, including
beds and 1,548 available beds with an average services and supplies, much of which was spent
occupancy rate of 69.0 percent and 72.9 percent, within the Los Angeles region.
respectively. These hospitals provided nearly
411,000 inpatient days of which 308,347 were for In addition to this spending, more than $522
general acute care. million was paid in wages and salaries and $154
million in employee benefits. Moreover, $50
Total discharges numbered more than 71,800. million was paid for other professional services.
There were 712,885 outpatient visits, one-third of
which were emergency department visits.
Economic and Policy Analysis Group 13Providence Health & Services Southern California Economic Impact Analysis
Economic and Fiscal Impact
Los Angeles County
The total economic impact of the hospitals of The indirect and induced impacts spill across
Providence Health & Services Southern California industries, as shown in Exhibit 3-4.
extends beyond the activity generated within the
institutions. Wages paid to the staff and payments
made for purchases of goods and services Exhibit 3-4
Economic Impact by Industry Sector
circulate throughout the economy generating (Los Angeles County, 2010)
additional indirect and induced activity.
Output
Sector Employment
($ millions)
Using the income statement reported by OSHPD,
total hospital revenues in Los Angeles County in Agriculture 4 $ 0.4
Mining 11 3.3
2010 were $1.38 billion.
Utilities 19 16.1
Construction 80 11.0
The total economic impact of PHSSC in Los Manufacturing 218 121.5
Angeles County in 2010, including direct, indirect Wholesale trade 235 40.0
and induced activity, is shown in Exhibit 3-3. Retail trade 1,140 86.4
Transportation and warehousing 285 35.5
Information 170 70.3
Finance and insurance 870 185.8
Exhibit 3-3
Economic and Fiscal Impact of PHSSC Real estate and rental 1,178 329.2
(Los Angeles County, 2010) Professional, scientific and technical
638 91.7
services
Management of companies 137 24.8
Estimated Annual Revenue ($ millions): $ 1,381.5
Administrative and waste management 1,265 65.9
Total Economic Impact: Educational services 282 21.9
Output ($ millions) $ 2,802.9 Health care and social assistance 10,972 1,535.3
Employment (jobs) 19,590.0 Arts, entertainment and recreation 235 17.3
Labor income ($ millions) $ 1,244.1 Accommodation and food services 848 53.2
Other services 815 58.0
All others 185 35.1
Total Fiscal Impact ($ millions):
Total * 19,590 $ 2,802.9
Income taxes (including profits taxes) $ 38.8
* May not sum due to rounding
Sales taxes 34.6 Source: Estimates by LAEDC
Property taxes 38.4
Fees and fines 14.2
Social insurance 5.3
Other taxes 6.8 Approximately half of these impacts occur in the
Total * $ 138.1 health care and social assistance sector, but other
* May not sum due to rounding sectors affected included administrative and waste
Source: Estimates by LAEDC
management, real estate and rental services, retail
trade, finance and insurance, and professional,
The five hospitals of Providence Health & scientific and technical services.
Services Southern California together generated
more than $2.8 billion in total economic output in A description of the industry sectors is provided
Los Angeles County and supported 19,590 full- in the Appendix.
and part-time jobs with total labor income
(including benefits) of more than $1.24 billion.
It is estimated that this activity generated more
than $138 million in state and local taxes.
14 Economic and Policy Analysis GroupEconomic Impact Analysis Providence Health & Services Southern California
Southern California Region
Given the nature of the region and the The indirect and induced impacts spill across
interconnectedness of both industry and employee industries, as shown in Exhibit 3-6.
transactions, the economic impact of the five
hospitals extends beyond the county borders into Exhibit 3-6
neighboring regions. The total economic impact Economic Impact by Industry Sector
of the five hospitals of PHSSC in the six-county (So-Cal Region, 2010)
Southern California region in 2010, including Output
Sector Employment
direct, indirect and induced activity, is shown in ($ millions)
Exhibit 3-5. Agriculture 23 $ 3.2
Mining 19 5.1
Utilities 28 23.6
Exhibit 3-5 Construction 104 14.4
Economic and Fiscal Impact of PHSSC Manufacturing 365 189.2
(So-Cal Region, 2010) Wholesale trade 316 54.5
Retail trade 1,346 101.8
Estimated Annual Revenue ($ millions): $ 1,381.5
Transportation and warehousing 333 41.6
Total Economic Impact: Information 195 79.6
Output ($ millions) $ 3,074.0 Finance and insurance 1,035 220.1
Employment (jobs) 21,250.0 Real estate and rental 1,245 360.9
Labor income ($ millions) $ 1,330.3 Professional, scientific and
738 104.3
technical services
Management of companies 199 35.6
Total Fiscal Impact ($ millions): Administrative and waste
Income taxes (including profits taxes) $ 42.2 1,438 76.4
management
Sales taxes 39.3 Educational services 315 24.0
Property taxes 43.5 Health care and social assistance 11,168 1,554.3
Fees and fines 15.5 Arts, entertainment and recreation 272 19.8
Social insurance 5.7 Accommodation and food
984 61.4
Other taxes 7.7 services
Total * $ 153.9 Other services 923 65.3
* May not sum due to rounding All others 203 38.9
Source: Estimates by LAEDC Total * 21,250 $ 3,074.0
* May not sum due to rounding
Source: Estimates by LAEDC
Together, the hospitals generated $3.1 billion in
total economic output in the six-county Southern
California region and supported 21,250 full- and As above, the largest employment impact occurs
part-time jobs with total labor income (including in the health care and social assistance sector, but
benefits) of $1.3 billion. many other industry sectors reap employment
benefits in the region as a result of the economic
It is estimated that this activity generated almost activity generated by the hospitals of Providence
$154 million in state and local taxes in the region. Health & Services Southern California.
Economic and Policy Analysis Group 15Providence Health & Services Southern California Economic Impact Analysis
Occupational Analysis
Of the jobs generated by the hospitals of PHSSC,
more than one-third are healthcare practitioner
and healthcare support occupations, with average
annual wages of $81,636 and $29,441 respectively.
The occupational distribution of the total jobs in
the six-county Southern California region is
shown in Exhibit 3-7.
Exhibit 3-7
Occupational Distribution of Total Employment Impact
(So-Cal Region, 2010)
Average
Occupational Description Employment Annual
Wages
Management 923 $ 119,480
Business and financial operations 841 72,582
Computer and mathematical science 336 80,807
Architecture and engineering 97 87,504
Life, physical and social science 129 70,189
Community and social services 404 51,316
Legal 105 124,318
Education, training and library 304 59,897
Arts, design, entmt, sports and media 182 70,263
Healthcare practitioners and tech 5,574 81,636
Healthcare support 1,594 29,441
Protective service 260 51,520
Food preparation and serving related 1,344 21,866
Building and grounds maintenance 1,020 27,062
Personal care and service 504 26,201
Sales and related 1,465 38,593
Office and administrative support 3,914 36,963
Farming, fishing and forestry 24 21,723
Construction and extraction 191 50,234
Installation, maintenance and repair 663 47,004
Production 548 31,962
Transportation and material moving 828 32,731
All * 21,250 $ 49,330
* May not sum due to rounding
Source: Estimates by LAEDC
Because the hospitals impact many industry
sectors, the economic activity they support
throughout the region provides employment for a
wide variety of occupations.
16 Economic and Policy Analysis GroupEconomic Impact Analysis Providence Health & Services Southern California
4 Construction Spending of Providence Health &
Services Southern California
Economic and Fiscal Impact
In addition to ongoing, regular and recurring (including benefits) of more than $63 million. It is
operations, the hospitals of PHSSC continue to estimated that this spending generated $6.6 million
invest in construction projects at new and existing in state and local taxes.
facilities, and carry out retrofits motivated by
regulatory mandates. This investment generates The indirect and induced impacts spill across
significant economic activity. Together, the industries, as shown in Exhibit 4-2.
hospitals report construction spending in 2010
reached $86.9 million.
Exhibit 4-2
Impact of Construction Spending by Industry Sector
(Los Angeles County, 2010)
Los Angeles County Output
Sector Employment
($ millions)
The total economic impact in Los Angeles County Agriculture 0 $ 0.0
of construction spending by PHSSC hospitals in Mining 1 0.3
2010, including direct, indirect and induced Utilities 1 0.8
activity, is shown in Exhibit 4-1. Construction 574 87.4
Manufacturing 31 12.1
Wholesale trade 18 3.0
Exhibit 4-1 Retail trade 62 4.7
Economic and Fiscal Impact of PHSSC Transportation and warehousing 20 2.6
Construction Spending Information 10 4.2
(Los Angeles County, 2010) Finance and insurance 45 9.9
Real estate and rental 28 11.4
Estimated Construction Spending ($ millions): $ 86.9 Professional, scientific and
70 10.7
technical services
Total Economic Impact: Management of companies 3 0.6
Output ($ millions) $ 165.6 Administrative and waste
Employment (jobs) 1,090.0 38 2.2
management
Labor income ($ millions) $ 63.1 Educational services 15 1.1
Health care and social assistance 65 6.5
Total Fiscal Impact ($ millions): Arts, entertainment and recreation 13 0.9
Income taxes (including profits taxes) $ 2.0 Accommodation and food
44 2.8
Sales taxes 1.6 services
Property taxes 1.8 Other services 44 3.2
Fees and fines 0.7 All others 7 1.3
Social insurance 0.2 Total * 1,090 $ 165.6
* May not sum due to rounding
Other taxes 0.3
Source: Estimates by LAEDC
Total * $ 6.6
* May not sum due to rounding
Source: Estimates by LAEDC
Most of these impacts will occur in the
construction sector, but as seen with the
Construction spending by the hospitals in 2010 economic impact of ongoing operations, many
generated $165.6 million in total economic output other industry sectors are impacted by the
in Los Angeles County and supported 1,090 full- hospitals’ construction spending.
and part-time jobs with total labor income
Economic and Policy Analysis Group 17Providence Health & Services Southern California Economic Impact Analysis
Southern California Region
The economic impact of hospital construction
spending also extends beyond Los Angeles The indirect and induced impacts spill across
County into neighboring regions. industries, as shown in Exhibit 4-4.
The total economic impact in the six-county
Exhibit 4-4
Southern California region of construction Impact of Construction Spending by Industry Sector
spending by PHSSC hospitals in 2010, including (So-Cal Region, 2010)
direct, indirect and induced activity, is shown in
Output
Exhibit 4-3. Sector Employment
($ 000)
Agriculture 1 $ 0.2
Exhibit 4-3 Mining 2 0.5
Economic and Fiscal Impact of PHSSC Utilities 1 1.2
Construction Spending Construction 576 87.6
(So-Cal Region, 2010) Manufacturing 61 20.2
Wholesale trade 25 4.3
Estimated Construction Spending ($ millions): $ 86.9 Retail trade 73 5.5
Transportation and warehousing 23 3.1
Total Economic Impact: Information 11 4.8
Output ($ millions) $ 185.7 Finance and insurance 53 11.6
Employment (jobs) 1,210.0 Real estate and rental 32 13.2
Labor income ($ millions) $ 69.2 Professional, scientific and
77 11.5
technical services
Total Fiscal Impact ($ millions): Management of companies 5 0.9
Income taxes (including profits taxes) $ 2.3 Administrative and waste
47 2.7
Sales taxes 1.9 management
Property taxes 2.1 Educational services 17 1.3
Fees and fines 0.8 Health care and social assistance 76 7.5
Social insurance 0.3 Arts, entertainment and recreation 15 1.1
Other taxes 0.4 Accommodation and food
52 3.3
services
Total * $ 7.7
Other services 50 3.6
* May not sum due to rounding
Source: Estimates by LAEDC All others 8 1.5
Total * 1,210 $ 185.7
* May not sum due to rounding
Source: Estimates by LAEDC
Construction spending by the hospitals in 2010
generated $185.7 million in total economic output
in the Southern California region and supported A description of the industry sectors is provided
1,210 full- and part-time jobs with total labor in the Appendix.
income (including benefits) of almost $70 million.
It is estimated that this spending generated more
than $7.7 million in state and local taxes through
its contribution to economic activity in the region.
18 Economic and Policy Analysis GroupAPPENDIX
A-1
1This page intentionally left blank
Economic Impact Analysis Appendix
A1 Methodology
The estimated economic impact includes
economic output, employment, and labor income,
which includes wages, salaries and benefits. The
total impact includes direct, indirect and induced effects.
Direct employment is the personnel hired by the
hospital in its ongoing operations and
construction programs, including doctors, nurses,
administrative, management, and so on. Direct
output is the value of the services provided by the
hospital. Indirect effects are those that stem from
the employment and output motivated by the
purchases made by the hospital. For example, The economic analysis is conducted using models
indirect jobs are sustained by the vendors of the developed with data and software from MIG, Inc.
medical supplies and insurance purchased by the MIG’s IMPLAN system is a robust widely-used
hospital. Induced effects are those generated by the set of modeling tools that provide economic
household spending of employees whose wages resolution from the national level down to the
are sustained by both direct and indirect spending. ZIP code level. Using multi-regional analysis,
these tools allow the estimation of the
The Southern California region is defined as the contribution of hospital operations in the county
six counties of Los Angeles, Orange, Riverside, where they occur and their consequent spillover
San Bernardino, Santa Barbara and Ventura. impact on neighboring regions.
The number of establishments as shown in The estimates for labor income and output are
Exhibits 2-1 and 2-7 represent the estimated reported in 2010 dollars to correspond with the
number of individual business units as defined by currency reported in the operations and
the U.S. Department of Labor (Bureau of Labor construction budgets. Labor income includes
Statistics) and the California Employment payments made to wage and salary workers and to
Development Department. the self-employed. Employment estimates are
measured on a job-count basis for both wage-and-
Estimates for construction spending in 2010 were salary workers and proprietors regardless of the
obtained from the hospitals. number of hours worked, and are generally
reported on an annual basis, i.e., the number of
full- and part-time jobs supported in one year.
Economic and Policy Analysis Group A-3Appendix Economic Impact Analysis
A2 Description of Industry Sectors
The industry sectors used in this report are and raw and intermediate materials and supplies
established by the North American Industry used in production, and providing services
Classification System (NAICS). NAICS divides incidental to the sale of the merchandise.
the economy into twenty sectors, and groups
industries within these sectors according to Retail Trade: Activities of this sector are retailing
production criteria. Listed below is a short merchandise generally in small quantities to the
description of each sector as taken from the general public and providing services incidental to
sourcebook, North American Industry Classification the sale of the merchandise.
System, published by the U.S. Office of
Management and Budget (2007). Transportation and Warehousing: Activities of this
sector are providing transportation of passengers
and cargo, warehousing and storing goods, scenic
Agriculture, Forestry, Fishing and Hunting: Activities and sightseeing transportation, and supporting
of this sector are growing crops, raising animals, these activities.
harvesting timber, and harvesting fish and other
animals from farms, ranches, or the animals’ Information: Activities of this sector are distributing
natural habitats. information and cultural products, providing the
means to transmit or distribute these products as
Mining: Activities of this sector are extracting data or communications, and processing data.
naturally-occurring mineral solids, such as coal
and ore; liquid minerals, such as crude petroleum; Finance and Insurance: Activities of this sector
and gases, such as natural gas; and beneficiating involve the creation, liquidation, or change of
(e.g., crushing, screening, washing and flotation) ownership of financial assets (financial
and other preparation at the mine site, or as part transactions) and/or facilitating financial
of mining activity. transactions.
Utilities: Activities of this sector are generating, Real Estate and Rental and Leasing: Activities of this
transmitting, and/or distributing electricity, gas, sector are renting, leasing, or otherwise allowing
steam, and water and removing sewage through a the use of tangible or intangible assets (except
permanent infrastructure of lines, mains, and copyrighted works), and providing related
pipes. services.
Construction: Activities of this sector are erecting Professional, Scientific, and Technical Services: Activities
buildings and other structures (including of this sector are performing professional,
additions); heavy construction other than scientific, and technical services for the operations
buildings; and alterations, reconstruction, of other organizations.
installation, and maintenance and repairs.
Management of Companies and Enterprises: Activities
Manufacturing: Activities of this sector are the of this sector are the holding of securities of
mechanical, physical, or chemical transformation companies and enterprises, for the purpose of
of material, substances, or components into new owning controlling interest or influencing their
products. management decision, or administering,
overseeing, and managing other establishments of
Wholesale Trade: Activities of this sector are selling the same company or enterprise and normally
or arranging for the purchase or sale of goods for undertaking the strategic or organizational
resale; capital or durable non-consumer goods;
A-4 Economic and Policy Analysis GroupEconomic Impact Analysis Appendix
planning and decision-making of the company or to meet varied cultural, entertainment, and
enterprise. recreational interests of their patrons, such as: (1)
producing, promoting, or participating in live
Administrative and Support and Waste Management and performances, events, or exhibits intended for
Remediation Services: Activities of this sector are public viewing; (2) preserving and exhibiting
performing routine support activities for the day- objects and sites of historical, cultural, or
to-day operations of other organizations, such as: educational interest; and (3) operating facilities or
office administration, hiring and placing of providing services that enable patrons to
personnel, document preparation and similar participate in recreational activities or pursue
clerical services, solicitation, collection, security amusement, hobby, and leisure-time interests.
and surveillance services, cleaning, and waste
disposal services. Accommodation and Food Services: Activities of this
sector are providing customers with lodging
Educational Services: Activities of this sector are and/or preparing meals, snacks, and beverages for
providing instruction and training in a wide variety immediate consumption.
of subjects. Educational services are usually
delivered by teachers or instructors that explain, Other Services (except Public Administration): Activities
tell, demonstrate, supervise, and direct learning. of this sector are providing services not
Instruction is imparted in diverse settings, such as specifically provided for elsewhere in the
educational institutions, the workplace, or the classification system. Establishments in this sector
home through correspondence, television, or are primarily engaged in activities, such as
other means. equipment and machinery repairing, promoting or
administering religious activities, grant-making,
Health Care and Social Assistance: Activities of this advocacy, and providing dry-cleaning and laundry
sector are operating or providing health care and services, personal care services, death care
social assistance for individuals. services, pet care services, photofinishing services,
temporary parking services, and dating services.
Arts, Entertainment and Recreation: Activities of this
sector are operating facilities or providing services
Economic and Policy Analysis Group A-5Los Angeles County Economic Development Corporation 444 S. Flower Street, 37th Floor Los Angeles, CA 90071 (888) 4-LAEDC-1 www.LAEDC.org
You can also read


