SOLVING THE OUT-OF-STOCK PROBLEM - A FMI/GMA Trading Partner Alliance Report
←
→
Page content transcription
If your browser does not render page correctly, please read the page content below
SOLVING THE
OUT-OF-STOCK PROBLEM
    A FMI/GMA Trading Partner Alliance Report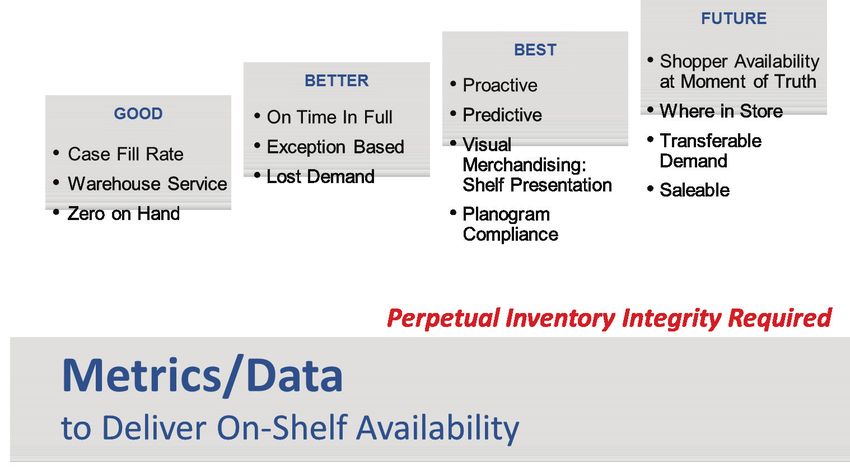
Executive Overview
    Despite many years of good-faith efforts by                            The FMI/GMA Trading Partner Alliance began
    manufacturers and retailers, the out-of-stock                          researching the out-of-stock problem in
    rate remains a stubborn eight percent, on                              2013 and presented a Good-Better-Best
    average, with out-of-stocks for promoted items                         maturity model for improving on-shelf
    often exceeding 10 percent1. That represents                           availability (OSA) at the 2014 FMI/GMA
    potential revenue loss of 8-10 percent or more                         Supply Chain Conference. As a next step
    in an industry already challenged with rising                          after the conference, the Alliance surveyed
    costs to serve the customer.                                           manufacturers and retailers to better
                                                                           understand how a wide range of practitioners
    The problem is bigger than just lost revenue,
                                                                           are currently addressing out-of-stock issues, or
    however. Today’s consumer-driven marketplace
                                                                           more correctly, how they are pursuing on-shelf
    makes improving the user experience a high
                                                                           availability. The survey results were consistent
    priority. Shoppers say product availability is
                                                                           with the Alliance’s previous diagnosis and
    a Top 3 reason for where they shop, yet on
                                                                           confirmed the gaps between current practices
    average, every time a shopper comes into
                                                                           and future desired state proposed by the
    a store, one out of every 12 items on her
                                                                           Alliance. An updated Good-Better-Best maturity
    shopping list, and one out of every 10 or less
                                                                           model for how trading partners can transition
    for promoted items, is not on the shelf.
                                                                           to a collaborative OSA approach, known as
    Not only does this harm user satisfaction and                          “One Supply Chain,” is discussed later in this
    loyalty, data from the Grocery Manufacturers                           report. The goal of the Alliance’s work and the
    of America (GMA) and the Food Marketing                                maturity model is to ultimately solve the out-of-
    Institute (FMI) Trading Partner Alliance shows a                       stock problem.
    disturbing three-strikes-and-you’re-out pattern.
                                                                           The gap between current practices and desired
    On the first occurrence of an out-of-stock, the
                                                                           performance is repeatedly demonstrated by
    typical shopper will substitute another item 70
                                                                           the study in several critical areas, including
    percent of the time; on the second occurrence
                                                                           metrics/data, process/practice, organizational
    the shopper is equally likely to substitute, make
                                                                           issues and technology integration. Key findings
    no purchase, or go to another store; and on the
                                                                           include:
    third occurrence, 70 percent will go to another
    store. Thus, there is not only the potential for                       • Metrics/Data—There is no standard
    lost revenue from the out-of-stock item itself,                          definition of OSA. While 86 percent of
    but also from the greater loss of future revenue                         retailers measure OSA with physical audits
    streams from lost brand and/or store loyalty.                            at the shelf in-store, other metrics are also
                                                                             widely used. For instance, 43 percent report
                                                                             using the Zero on hand metric, 29 percent
                                                                             use Zero on hand with lost demand triggers

    1 GMA/FMI Supply Chain Ideation Conference, May 2013; and, Retail Out-of-Stocks: A Worldwide Examination of Extent, Causes and
       Consumer Responses, FMI/GMA, 2003
1
    S O LV I N G T H E O U T- O F - S T O C K P R O B L E M : A F M I / G M A T R A D I N G P A R T N E R A L L I A N C E R E P O R T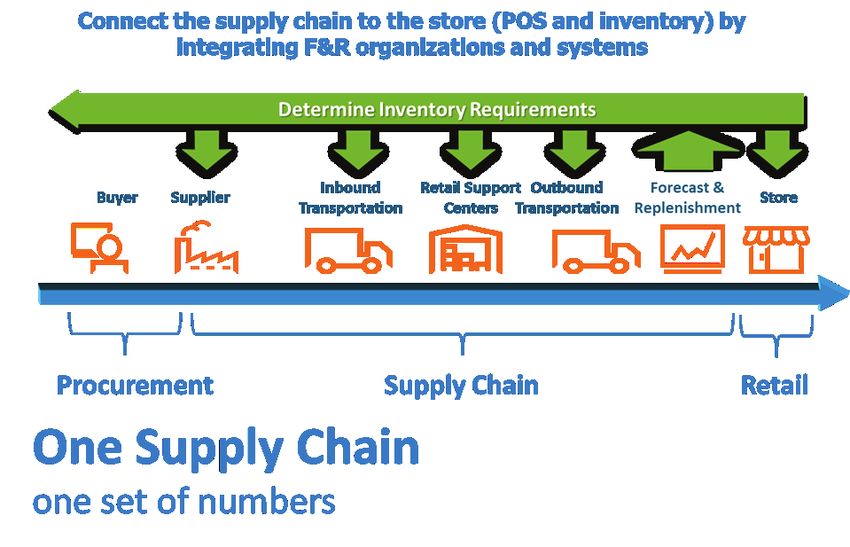
and 21 percent use minimum display values.                       Thus, the good intentions of retailers and
      Manufacturers similarly reported multiple                        manufacturers to collaborate will not be fully
      metrics for their definition of OSA. Clearly,                    realized in OSA performance until these and
      an important issue is that all parties are not                   other gaps identified in the research are
      working off of same numbers.                                     addressed. The FMI/GMA Trading Partner
                                                                       Alliance is continuing its work on the Good-
    • Process/Practice—There is poor
                                                                       Better-Best framework to help companies
      synchronization between retailers and
                                                                       incrementally reach this goal. Specific action
      manufacturers on event planning. While 58
                                                                       items identified by the Alliance so far for the
      percent of retailers say they lock down event
                                                                       industry include:
      plans four weeks or less before the event,
      73 percent of manufacturers say they need                        • Move the industry toward a ‘Zero on hand’
      at least five weeks or more to adjust their                        baseline definition of OSA to facilitate better
      production to accommodate these plans.                             communication and standardization for data
      This lack of synchronization can be a major                        exchange
      contributor to out-of-stock issues.
                                                                       • Agreement between retailers and suppliers
    • Organizational Issues—There is no clear                            on what demand signal is used for event
      owner of the inventory among retailers. An                         forecasting
      equal number of retail respondents said
                                                                       • Collaboration between retailers and suppliers
      Supply Chain Planning owned inventory as
                                                                         to better align timing between issuance of
      those who said Category Managers or Buyers
                                                                         event forecasts and production scheduling
      did, and almost as many said Merchandising
                                                                         requirements
      owns it. And since respondents were allowed
      to select more than one answer, the total of                     • Collaboration on high-side and low-side range
      responses was approximately 150 percent,                           contingency plans for events
      indicating even within one retailer more than
      one group often has ownership. Without clear
      ownership, there is also no real accountability
      for solving the problem.

    • Technology—Despite the high percentage of
      retail and manufacturing respondents who
      claim they collaborate on event forecasts,
      over 78 percent of manufacturers say they
      don’t use retailer forecasts for production and
      deployment planning, instead opting for their
      own forecasts which are primarily based on
      shipments from their DCs. Analysis indicates
      that part of the reason for this is a timing
      gap between when data is available versus
      when it is actually needed, but there is also a
      problem with the huge amounts of data that
      must be analyzed.

2
    S O LV I N G T H E O U T- O F - S T O C K P R O B L E M : A F M I / G M A T R A D I N G P A R T N E R A L L I A N C E R E P O R T
FMI/GMA Trading
Partner Alliance On-Shelf
Availability (OSA) Study
The OSA study was led by key retail and problem. This was significant in identifying the
manufacturing executives from FMI/GMA gaps discussed in this report.
Trading Partner Alliance member companies
This report summarizes the findings of the
and the survey responses came from a wide
survey around the four key gaps that must be
selection of leading manufacturers and retailers.
overcome to reach OSA maturity. These are:
Survey questions were directed specifically to
metrics/data; process/practice; organizational
retailers or manufacturers to better understand
issues; and technology. The report also provides
each side’s issues and as a means to compare
Good-Better-Best recommendations under these
and contrast the two sides’ approach to the
same four topic areas.
The Metrics/Data Gap: Agreeing on the Facts
While a rose by any other name may smell as As shown in Figure 2, for instance, 59 percent
sweet, the fact that manufacturers and retailers of manufacturers said they based their out-of-
can’t agree on the basic definition of an out- stock calculations on retailer-provided POS data,
of-stock is not so sweet. The industry needs a while another 28 percent said it is based on
common definition of terminology and metrics other retailer-provided metrics. But 40 percent
before the metrics/data gaps in OSA can be of all manufacturers, and 80 percent of those
addressed systematically. (See sidebar) using retailer-provided metrics (based on a
follow-on question), said those metrics vary
by retailer, making standardization across the
industry problematic.
Figure 2 MANUFACTURERS’ OSA MEASUREMENTS
■ Varies by Retailers
■ Retailer Metrics
■ POS Data
■ Physical Audits
0% 20% 40% 60% 80%
3
S O LV I N G T H E O U T- O F - S T O C K P R O B L E M : A F M I / G M A T R A D I N G P A R T N E R A L L I A N C E R E P O R TFMI/GMA Trading Partner Alliance Recommended OSA
Definition
Consistent with the Alliance’s Good-Better- • Leverage store technology or work process to
Best approach to moving the industry toward understand inventory location (back room vs.
standardization and best practices, the Alliance shelf) in determining OSA and implementing
has created the following definition of OSA that proactive work processes/alerts to minimize
companies should adopt to begin to bring a OSA issues.
level of standardization to the OSA process. This • Consider item profitability in the OSA analysis,
will help retailers and manufacturers to better as higher profit items may impact range of
communicate, collaborate and integrate to reach countermeasures or mitigating actions.
the OSA goals. • Consider shopper equity data and substitution
patterns in stratifying SKUs on service level
At a minimum the Alliance recommends the goals as well as to plan for SKU forecast
industry move to “Zero on Hand,” as the new volatility due to switching. In the “three strikes
on shelf availability metric baseline. Retailers model,” the first time shoppers are faced
with CAO/CGO should be able to calculate this with OOS, they will substitute another item
systematically. Retailers that do not have a CAO/ 70 percent of time when faced with OOS.
CGO system can still participate as long as there But many departments and SKUs have much
is a daily Store practice to determine out-of- higher loyalty, where the shopper wants
stocks on-shelf. exactly what they want (i.e.- personal needs,
baby, pet food).
GOOD:
• Zero On Hand – Number of instances when an The following example illustrates how these
authorized item’s perpetual inventory fell to three levels impact results.
zero or below / total store item combinations.
EXAMPLE WORKING ASSUMPTIONS
BETTER: • Items are authorized in 100 Stores
• Lost Demand – When the perpetual inventory • Stores have comparable daily item movement
snapshot occurs and there is zero on hand, for simplicity
it triggers the system to determine what the • Perpetual inventory is accurate in all 100
item would have moved utilizing CAO/CGO Stores
forecasted movement. • Zero on hand in 2 stores
• Lost Sales – Turns the anticipated lost demand • Below minimum presentation in 3 stores
into dollars (Lost Demand * Retail Price)
• Below Minimum Presentation – Minimum Forecasted Min Sales $
presentation is the minimum amount of units Items
Movement Presentation per unit
that the retailer will accept for merchandising
an item on-shelf. With this method Minimum Item A 30 12 $5.00
Presentation is the hypothetical zero and Item B 10 6 $6.00
anything below that agreed upon threshold is
Item C 1 3 $10.00
considered a failure/ out.
BEST IN CLASS & FUTURE CONSIDERATIONS: Lost
• Utilize forecasted movement (POS) and DC- OSA Zero On Below Min
Demand/
to-store delivery schedules to proactively Methods Hand Presentation
Sales
determine potential out-of-stocks (OOS) before
they happen. 60 Units/
Item A 98% 95%
$300
• Consider promoted vs. non- promoted items in
the analysis, given additional forecast volatility 20 Units/
Item B 98% 95%
in promoted SKUs. $120
2 Units/
Item C 98% 95%
$20
4
S O LV I N G T H E O U T- O F - S T O C K P R O B L E M : A F M I / G M A T R A D I N G P A R T N E R A L L I A N C E R E P O R TMeanwhile, 86 percent of retailers still measure to the agile, collaborative planning processes
out-of-stocks by physical audits at the shelf the market now requires. Greater use of Zero
in-store, among other methods, a slow, manual on hand is recommended by the Alliance going
process which is not sustainable in today’s fast- forward.
moving retail environment, and is not conducive
Figure 3 RETAILERS’ OSA MEASUREMENTS
■ Shelf Audit
■ Zero on hand
■ Zero on hand, triggers
■ Minimum display
0% 20% 40% 60% 80% 100%
Clearly, the lack of a standard definition of what of their volume. And in answer to a separate
constitutes an out-of-stock is the first stumbling question, 24 percent of manufacturers say
block for attacking this problem. See the OSA they don’t measure OSA at all. This data
definition sidebar for the Alliance’s proposal for suggests two things: first, that the lack of
standardization of this important metric. standardization, and thus trust in the data,
has led manufacturers to put less emphasis
There is also the issue of the completeness of
on OSA issues than their retail counterparts;
data measurement. As Figure 4 shows, only
and second, that manufacturers are therefore
about 9 percent of manufacturers measure
currently tracking OSA for only a few of their
OSA for more than 75 percent of their volume.
largest customers. But this lack of complete and
More telling is that over 29 percent of the
reliable tracking of OSA data is a limiting factor
manufacturers measure 25 percent or less
in solving the broader OSA problem.
Figure 4 PERCENTAGE OF MANUFACTURERS’ CUSTOMER VOLUME WHERE OSA IS TRACKED
75+%
50-75%
25-49%
0-25%
0% 10% 20% 30% 40%
Therefore, not only is there currently a lack of manner. This will have to be overcome if the
agreement on the definition of the OSA problem, industry as a whole is to successfully solve the
there also seems to be a lack of urgency in OSA problem and reap the resulting substantial
approaching the issue in a more comprehensive rewards.
5
S O LV I N G T H E O U T- O F - S T O C K P R O B L E M : A F M I / G M A T R A D I N G P A R T N E R A L L I A N C E R E P O R TMaking Effective Use the Data
Another stumbling block for manufacturers This data volume issue may also be a legacy
and retailers effectively collaborating on OSA of the limitations of the demand forecasting
is the sheer size and variability of the data sets technology manufacturers have traditionally
being communicated to suppliers. The survey used which does not have the scalability to
suggests this may be an issue since both handle the huge volume of SKU-level store POS
groups fall back on using traditional in-house data. In addition, when measuring forecast
DC shipment data for forecasting even when accuracy, 100 percent of manufacturing
more accurate POS data is available and shared. respondents said they base their measurement
on their own shipments to retailers, further
To start with, 17 percent of retailers say they
suggesting manufacturers are struggling to
don’t share POS data with their suppliers at
effectively use retailer provided data.
all. But even though 83 percent do share this
data, only 57 percent of manufacturers say Surprisingly, given retailers have access to
they are able to use this data in their demand their POS data, 75 percent of retailers also
and production forecasts. Anecdotal evidence use aggregated shipment data from their
suggests that the disparity in data formats DCs rather than their own POS data as the
provided by retailers increases the complexity demand signal for their automated forecasting
for suppliers trying to integrate this data into and replenishment systems— perhaps also a
their planning processes. Add to this the volume and technology limitation issue.
tremendous volumes involved in item within
Another factor the survey results demonstrate
store-level POS data being share and the
is that retailers and manufacturers continue to
magnitude of the challenge facing suppliers
work in silos. Each has their own language, their
starts to become obvious.
own data and their own ways of doing things
that have been built up over decades of doing
business as separate entities. Therefore, sharing
Top 10 Reasons Why Retailers Should Share POS data, while well intentioned, is only a first
POS Data with Suppliers
step in this difficult process of getting everyone
10. Your mother always taught you to share your things on the same page. That is why collaborative
9. It’s what friends and partners should do efforts—people talking to people and working
8. It builds trust and strengthens partnerships out differences—will be critical to establish
7. It helps suppliers better meet retailers’ needs standards for data sharing and the associated
6. It helps suppliers quickly adjust to new product introduction sales communication processes.
trends
5. It helps suppliers better understand promotion effectiveness Thus, simply sharing data between retailers and
4. It helps suppliers understand local demand patterns manufacturers will not be enough to solve the
3. It helps suppliers better understand the effects of seasonality by OSA problem until all partners agree on data
region standards, communication formats and timing
2. It enables retailers and manufacturers to more effectively so they can put the data to use to agilely adjust
collaborate on OSA
production, distribution, replenishment and
1. You can’t effectively solve the OSA problem without accurate, merchandising plans down to the shelf level.
timely POS data
6
S O LV I N G T H E O U T- O F - S T O C K P R O B L E M : A F M I / G M A T R A D I N G P A R T N E R A L L I A N C E R E P O R TThe Process/Practice Gap: Synchronizing Efforts
Analyzing the data from the survey uncovered This is not to say that CAO overrides are
several areas where current processes are necessarily bad. Anecdotal evidence from
counterproductive to solving the OSA problem. Alliance members suggests overrides of up
These processing gaps include internal to five percent of store items are normal. The
operational issues, timing issues between reasons for these overrides include variations
retailers and manufacturers, and other in local demand, adjustments for shrinkage or
synchronization issues across the supply chain. spoilage, and other non-predictable in-store
occurrences.
The basic building block of OSA is visibility to
what inventory is actually in each store at any However, the bigger fear is that CAO overrides
point in time. Often referred to as a perpetual are the result of poor in-store practices. For
inventory process, this inventory visibility is example, not training, and enforcing, that
the foundation of an effective computer-aided cashiers must scan all items at checkout rather
ordering (CAO) system (sometimes also called than scanning the first item and hitting the
computer generated ordering or CGO). Retailers quantity button for items that are not, in fact,
cannot hope to effectively solve the OSA identical. Or taking items from store shelves
problem without a perpetual inventory process to use in other departments, such as the deli,
and CAO in place. bakery or prepared foods, without recording
inventory adjustments. Or failing to properly
However, having a CAO solution in place does
scan or record all items in replenishment
not necessarily mean a retailer has either
shipments. Without accurate accounting of
enterprise-wide visibility to in-store inventory
all inventory in the store, perpetual inventory
or that internal policies and practices support
counts are inaccurate and CAO effectiveness
an accurate perpetual inventory process. For
will be impaired.
example, although half of the retailers report
using some form of CAO, most of those that do A complicating factor for the use of CAO/CGO
use CAO allow stores to override or influence is that neither demand nor merchandising
the CAO order. While there are legitimate plans are constants. While a certain baseline
reasons to allow store overrides, such as local of products exhibit fairly smooth demand and
weather emergencies or special local events, sales numbers, and are therefore easy to
the fact that 40 percent also allow stores to forecast and generate orders for, demand for
override CAO system settings suggests that other products is more volatile. Promotions,
there is a lack of standardization across the special events, new product introductions and
enterprise, making it very difficult to implement unforeseen events such as snowstorms or
effective corporate OSA programs. By extension, natural disasters can all significantly impact
if corporate OSA programs are not effective, demand and/or supply. Procedures for adjusting
collaboration with suppliers will be severely CAO/CGO must therefore be part of the overall
hampered. OSA plan. Ultimately, the goal is to improve the
CAO process to the point that overrides are not
necessary.
7
S O LV I N G T H E O U T- O F - S T O C K P R O B L E M : A F M I / G M A T R A D I N G P A R T N E R A L L I A N C E R E P O R TTiming is Everything
Another obvious process gap shown in the for example, 50 percent of retailers lock down
survey results is the timing on event forecasting. their event forecasts, and can thus provide
Although 79 percent of retailers say they meaningful forecasts to their vendors, only 2-4
include vendors in their event forecast planning weeks before an event, with an additional eight
process, a mismatch in timing may be undoing percent locking the forecast down less than two
these good intentions. As shown in Figure 5, weeks prior to the event.
Figure 5 RETAILER LOCKDOWN TIMING ON EVENT FORECASTS
■ 5-8 weeks
■ 2-4 weeks
■ 25%) CHANGES TO
RETAILER PLANS
Displays ■ 9+ weeks
■ 5-8 weeks
Materials ■ 1-4 weeks
Production
Distribution
0% 50% 100%
8
S O LV I N G T H E O U T- O F - S T O C K P R O B L E M : A F M I / G M A T R A D I N G P A R T N E R A L L I A N C E R E P O R THowever, the problem goes beyond lockdown making changes to their forecasts of three
timing. For whatever reasons, the majority of percent or greater after lockdown, with 25
retailers make changes to their forecasts after percent saying they make these changes over
the lockdown date. As shown in figure 7, a 20 percent of the time.
whopping 92 percent of respondents reported
Forecast Timing
The survey data shows an obvious mismatch progress on OSA through better collaboration.
between the timing of when retailers say the As a starting point, the FMI/GMA Trading Partner
generally provide event forecasts to manufacturers Alliance recommends that manufacturers and
and the amount of time manufacturers say they retailers collaborate on high-side and low-side
need for production and deployment planning and contingency planning as a first step in resolving
execution. Overall, 58 percent of retailers provide the issues caused by the event forecast timing
these forecasts four weeks or less before the event mismatch. (See sidebar on Forecast Timing) Under
kick-off date. Manufacturers, however, generally this process, retailers and manufacturers would
need four to eight weeks of foreknowledge of agree on a single demand forecast along with a
retailer requirements in order to provide the range of demand uplift for each event or promotion
merchandise. This gap is an excellent candidate for rather than work to a single number. The range
collaboration. would be based on a joint list of assumptions and
The Alliance has two recommendations that should potential risks, and would include what reactions
help overcome this timing issue. First, eliminate each party will take if the variance to plan occurs.
the concept of an event “lockdown” date. Since For example, if a promotion creates significantly
92 percent of retailers admit they make some greater demand than anticipated, the high side
degree of changes after this date anyway, its contingency may be that the manufacturer
usefulness is questionable. Second, to replace agrees to provide addition inventory in a specified
this concept, retailers and manufacturers should timeframe and the retailer agrees to accept full
begin collaborating on forecasts early in the event case shipments rather than shelf-ready displays.
planning process and continue to adjust plans as Unfortunately, no respondents indicated they
warranted throughout the planning and execution have such a program in place today. Instead,
of the event. manufacturers either allocated extra inventory
As part of the event planning collaboration, over forecast only to strategic customers (with
participants should not be locked into “a number” potential impact spread among other customers) or
for the forecast, but rather, should be developing allocated extra inventory only if it would not impact
a range of expected demand. This will allow joint other customers. Neither alternative gets at the root
creation of appropriate high-side and low-side of the problem.
contingency plans that cushion the impact of By collaborating on a high-side and low-
variance in demand. By focusing on demand side contingency plans early in the process,
forecasting as a process rather than a date and as manufacturers can adjust production plans and
a range rather than a number, the timing issue can work with their materials suppliers to ensure
be narrowed, if not eliminated, and contingency sufficient inventory will be available to cover
plans can help reduce the impact of any variations. forecast variations and changes after lockdown
Clearly, event forecasting is one area where while retailers are flexible in how the additional
retailers and manufacturers can make significant inventory may be delivered or priced.
9
S O LV I N G T H E O U T- O F - S T O C K P R O B L E M : A F M I / G M A T R A D I N G P A R T N E R A L L I A N C E R E P O R TFigure 7 HOW OFTEN RETAILERS MAKE CHANGES TO FORECASTS AFTER THE LOCKDOWN DATE
■ 20%
0% 50% 100%
The Organizational Gap: Owning Change
Once you get past the data sharing and process it will also require a commitment to change
issues, the next question is whether there from the people inside each organization.
is organizational readiness to support OSA But just who those people are is uncertain.
initiatives. On the manufacturing side, the fact Survey responses from both retailers and
that 24 percent do not even track OSA, and on manufacturers indicate there are no clear
the retail side, the fact that 17 percent don’t owners of the inventory or forecast decisions.
share POS data with suppliers, suggests there An equal number of retail respondents said
may be resistance. Supply Chain Planning owned inventory as those
who said Category or Buyers did, and almost as
Even among those companies that track OSA,
many said Merchandising owns it.
there seems to be a lack of commitment across
their organizations and supply chains. For And since respondents were allowed to select
example, although 71 percent of manufacturers more than one answer, the total of responses
say OSA is a top business priority, only 53 was approximately 150 percent, indicating
percent say it is a key focus for their end-to-end even within one retailer more than one group
supply chains, and that number drops further often has ownership of inventory. Without clear
to 43 percent who say it is a focus area or ownership, and thus responsibility, for managing
metric for measuring their sales force. Since inventory levels and developing forecasts, there
OSA is a total supply chain issue, not simply a is no accountability for results. This organization
manufacturing or retail issue, all parties must be alignment issue will be one step in helping to
involved in the solution. Not only will this require improve OSA.
collaboration up and down the supply chain,
10
S O LV I N G T H E O U T- O F - S T O C K P R O B L E M : A F M I / G M A T R A D I N G P A R T N E R A L L I A N C E R E P O R TFigure 8 WHO OWNS RETAIL INVENTORY
■ SC Planning
■ Merchandising
■ Category/Buyers
■ Dist/Trans
■ Stores
0% 15% 30% 45% 60%
These ownership issues cause several problems stores to override CAO forecasts, a potential
for effective OSA programs. First, the variance in accountability issue.
which department owns the inventory makes it
Second, for those retailers where there is more
hard for manufacturers to know who they should
than one owner of inventory, effectively there is
be dealing with from retailer to retailer in setting
no owner, and thus, no accountability. Without
up collaborative OSA processes. Interesting,
accountability, there is little incentive to improve
although only nine percent of retailers say their
OSA, so implementing effective programs
stores have ownership of the inventory, and less
is unlikely. These issues spill over into the
than eight percent say stores are responsible for
forecasting process.
event forecasts, the majority of retailers allow
Who’s in the Driver’s Seat?
While there has been much written about parties are even collaborating or not, how can
who is driving the relationship—the brand effective programs be put in place to address
manufacturer or the retailer, and whether that the many issues impacting OSA?
has changed over the years—the real issue
In this light, it is not surprising that less than 13
might be who is setting the forecasts on which
percent of manufacturers said they were Very
OSA depends.
Satisfied with the accuracy of the forecasts and
For instance, according to the survey, 79 could use them for direct adjustments to their
percent of retail respondents say that they production or deployment plans. Furthermore,
forecast event demand collaboratively with when manufacturers were asked what they
their suppliers, while only 63 percent of do when faced with forecasts from the retailer
manufacturers say that’s how they perceive it is different from their own, less than 19 percent
done. Similarly, 85 percent of retailers say that say they collaborate with the retailer to reconcile
internally their category managers/ buyers are the differences, as opposed to 79 percent who
responsible for the event forecast, but only 30 said they primarily use their own forecast. This
percent of manufacturers perceive this to be the also harps back to the issue of trust in the data.
case. In contrast, 60 percent of manufacturers
Thus, part of the cultural change needed
think that their sales or supply chain reps are
to facilitate the collaboration that will drive
responsible. If there is no agreement on who
improvement in OSA involves decisions on
is responsible for the forecast, or whether the
11
S O LV I N G T H E O U T- O F - S T O C K P R O B L E M : A F M I / G M A T R A D I N G P A R T N E R A L L I A N C E R E P O R Townership, roles and who makes decisions trading partners. Without these well understood
regarding the many issues impacting OSA. There guidelines, establishing effective OSA processes
must be clear roles and accountability within and programs will be unlikely, nor will they be
organizations as well as open communication sustainable even if put in place.
of those roles and responsibilities between the
The Technology Gap: Is Automated Collaboration Possible?
The survey data implies several gaps in the This points out a larger problem—the silos that
technology used by retailers and manufacturers exist in many companies, and between trading
in the critical steps of forecasting demand partners, that prevent effective data sharing and
and subsequent planning for OSA. As noted usage. These silos are often organizational, but
earlier, although 79 percent of retailers say can also be due to technology. As a result, each
they share POS data with their suppliers, few department and each company creates their
manufacturers or retailers seem to be using this own forecast with their own built-in assumptions
data in their forecasting and planning processes. and perceived risks, creating an ever-increasing
bullwhip effect that multiplies forecast error.
There is no question that the potential data
Why not use one shared forecast and let all
volumes involved in the use of store level
other calculations flow from there?
POS data are huge. In the past, this volume
prohibited many forecasting and replenishment Integration of in-house systems to use a single
systems from using the more accurate store- set of available data in a timely way is the first
level POS data. Recent advancements in technology building block for solving the OSA
technology have removed that limitation. problem. The more difficult issue to overcome
is the lack of standardization and integration
However, even if the technology is in place to
between trading partner technologies. This
address the large volume of data to produce
disconnect will render OSA efforts moot unless
accurate SKU-level forecasts by store or store
retailer and manufacturing partners develop
cluster, the question remains of whether it will
a collaborative process, and the necessary
get used. As mentioned earlier, there are data
systems interfaces, to share a single POS-based
format and communication issues that hinder
forecast (a single version of the truth) and
the use of the POS data sets as well. The
base all subsequent supply chain calculations
industry must work to standardize what, when
off of that one forecast. This is foundational to
and how it shares data, the communication
developing One Supply Chain.
processes and protocols used, and how that
information will be put to use for agreed upon
forecasts.
12
S O LV I N G T H E O U T- O F - S T O C K P R O B L E M : A F M I / G M A T R A D I N G P A R T N E R A L L I A N C E R E P O R TThe Good-Better-Best
Framework for Solving the
OSA Problem
Given all of the challenges discussed in this The GBB framework focuses on a step-by-
report and the data, process, organization step approach for closing the data, process,
and technology gaps defined by this research organization and technology gaps identified. The
study, it should be clear that there is no framework provides target actions for improving
easy solution to the OSA problem facing metric/data quality and sharing, organizational
retailers and manufacturers. The FMI/GMA improvement, and process/practice
Trading Partner Alliance recognizes this fact standardization supported by POS integrated
and has created a Good-Better-Best (GBB) forecasting and replenishment. The framework
framework for addressing the issues and is represented by the Effectiveness Pyramid
challenges incrementally, as well as some shown in figure 9. The ultimate goal is to arrive
recommendations for an improved future state at a fully collaborative state where joint business
of collaboration and OSA mastery. planning (JBP) can be done interactively
between trading partners so that the relationship
is really supporting One Supply Chain.
Figure 9 THE OSA EFFECTIVENESS PYRAMID
JBP
POS Integrated
Forecasting & Replenishment
Store Order Forecast POS Sharing
Store Replenishment/CAO
Standards, Metric/Data & Process/Practice
13
S O LV I N G T H E O U T- O F - S T O C K P R O B L E M : A F M I / G M A T R A D I N G P A R T N E R A L L I A N C E R E P O R TGood-Better-Best Metrics/Data
The foundation of the OSA Effectiveness on Hand” as the new OSA metric baseline.
Pyramid, and the starting point for companies Retailers with CAO/CGO capability should be
looking to improve their OSA performance, able to calculate this systematically. Retailers
is standardizing their metrics and data. At a that do not have a CAO/ CGO system can still
minimum, this will require retailers to implement participate as long as there is a daily store
a perpetual inventory program to provide practice to determine out-of-stocks. If you are
accurate visibility to inventory at each store and using and sharing OSA methods, be clear as
across the enterprise. This accurate inventory to which method(s) you are using or sharing to
visibility must be combined with an agreed upon support apples-to-apples peer comparisons.
standard definition between trading partners of Next, determine where you are currently
what constitutes an out-of-stock condition. versus where you want to be for OSA metrics.
Leverage the hierarchy of the Good- Better-
The FMI/GMA Trading Partner Alliance
Best framework to help you and the industry
recommends that the industry move to “Zero
eventually achieve the desired future state.
Figure 10 GOOD-BETTER-BEST METRICS/DATA
Good-Better-Best Process/Practice
Best practice processes will need to be OSA within the stores. This will include proper
developed and implemented both internally and training for cashiers, stocking personnel, and
between trading partners in order for data to everyone else that handles, uses or otherwise
be shared securely and in a timely manner, as deals with inventory.
well as to ensure collaborative processes are
Next there will have to be an evaluation of the
in place to affect OSA outcomes. It starts with
CAO processes—do you have a CAO/CGO
getting your internal house in order through
process and system in place; how and why will
initiating standard operating procedures for
14
S O LV I N G T H E O U T- O F - S T O C K P R O B L E M : A F M I / G M A T R A D I N G P A R T N E R A L L I A N C E R E P O R Toverrides be used; and what is the impact on earlier, as a first step in breaking down the
actual orders and OSA? Consider running a silos and begin working from a single, shared
pilot study in a few stores covering a selected forecast.
category and set of products to work out details
Again, pilot programs with limited participants
and evaluate the impact of changes.
and objectives can help to smooth the way
As you are getting your own house is in order, for wider adoption of OSA programs later on.
start to engage suppliers for collaborative Remember, this is a journey, not a quick fix. But
ways to use POS data, integrate technology over time, participants should see substantial
and leverage consumer insights for better revenue lift and cost savings from performing as
forecasting. Consider initiating a joint high side One Supply Chain.
contingency planning process, as discussed
Figure 11 GOOD-BETTER-BEST PROCESS/PRACTICE
Good-Better-Best Organizational Improvement
As with the process area, organizational critical for OSA program success.
improvements must start internally. Initiating
The lack of alignment between OSA strategies
an integrated business planning process is one
and rewards was evident in the survey results.
way to start breaking down the internal silos
Although 71 percent of manufacturers say OSA
and get people and departments talking and
is a top business priority, only nine percent
planning together. But rewards and incentives
include OSA as a factor in incentives or rewards.
must also be aligned. Too many corporate
Given the current very primitive state of cross-
strategies get blindsided by incentive programs
organizational and trading partner collaboration
that reward staff for goals within the silos that
on OSA, this low percentage is to be expected
are counterproductive to the organization as
since too many factors are currently beyond
a whole. Aligning incentive compensation is
15
S O LV I N G T H E O U T- O F - S T O C K P R O B L E M : A F M I / G M A T R A D I N G P A R T N E R A L L I A N C E R E P O R Tthe control of individuals or departments. Still, effectiveness and related incentives. This should
one of the goals of implementing an effective be extended to trading partner incentives as the
and collaborative OSA program should be to program matures.
eventually get better alignment between OSA
Figure 12 GOOD-BETTER-BEST ORGANIZATIONAL IMPROVEMENT
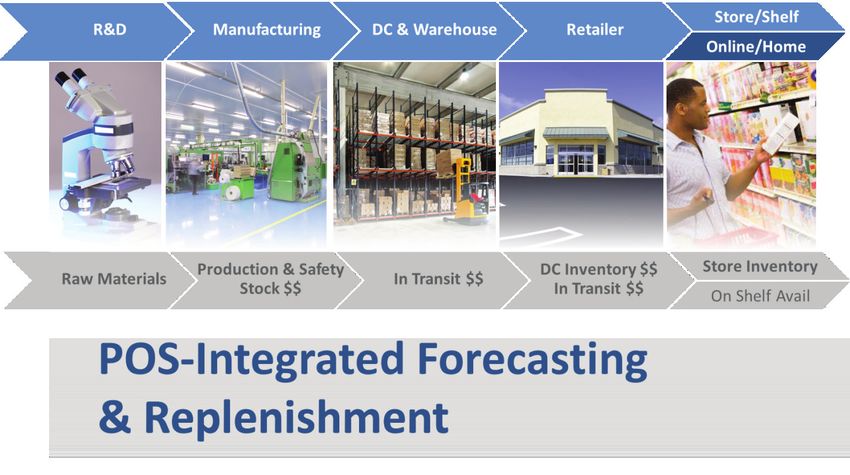
Technology Integration
We live in an integrated world today. The as the driver for forecasting demand. Integrate
Internet made that possible; omni-channel this demand data, along with seasonality, new
retail is making it an everyday imperative. The product introductions and promotions, into
old siloed ways of doing business cannot hope replenishment planning. Integrate replenishment
to support this new paradigm. Likewise, the plans with DC and store inventory distribution
technology we use to support this integrated and execution plans so that you realize the
world can no longer live in silos. Technology benefits of your efforts.
must be integrated across departments and
As internal systems are being integrated, work
functions internally, and must be integrated
with trading partners to integrate inter-company
to trading partners’ technology. As figure 13
processes and systems. The goal should be
depicts, from raw materials to the shelf is all
to have a single POS-driven forecast driving
one integrated process, and the technology that
all production, materials, distribution and
supports this process must function as one.
replenishment calculations. The concept is to
Continuing on the Good-Better-Best theme, never forecast what you can calculate so you
there is no need to attempt this all at once. eliminate forecast error and the bullwhip effect.
Start by integrating internal systems so there This will be the basis of the One Supply Chain
is visibility to store-level inventory and sales model (see Figure 14) the Alliance recommends
across the enterprise. Use store-level POS data as the ultimate solution for OSA going forward.
16
S O LV I N G T H E O U T- O F - S T O C K P R O B L E M : A F M I / G M A T R A D I N G P A R T N E R A L L I A N C E R E P O R TFigure 13 TECHNOLOGY INTEGRATION
17
S O LV I N G T H E O U T- O F - S T O C K P R O B L E M : A F M I / G M A T R A D I N G P A R T N E R A L L I A N C E R E P O R TInsights to Action
Information and insights have little value unless create specific action steps for companies to
they are used to spur meaningful action. Thus, take to address the OSA challenge. This begins
the Alliance is using the insights gained from with One Supply Chain.
this study together with their previous work to
One Supply Chain
For at least a decade now supply chain must work together collaboratively if on-shelf
professionals have understood that in today’s availability is to improve. The FMI/GMA Trading
global, hyper-connected world it is no longer Partner Alliance has worked hard over the
my company against your company—it is past 18 months to lay the groundwork for this
my supply chain against your supply chain. collaboration. The survey on which this report
No retailer or manufacturer by themselves is based demonstrates that manufacturers and
can solve the persistent out-of-stock problem retailers are generally in agreement with the
that is costing businesses billions of dollars gaps and solutions the Alliance presented at the
each year. All members of the supply chain 2014 Supply Chain Conference.
Figure 14 ONE SUPPLY CHAIN
The result of the Alliance’s work and the survey the Alliance has dubbed One Supply Chain.
is a maturity model that can incrementally As figure 14 shows, there are many moving
move companies and the industry toward a parts to One Supply Chain processes carried
more collaborative approach to OSA which out by multiple players. But if all participants
18
S O LV I N G T H E O U T- O F - S T O C K P R O B L E M : A F M I / G M A T R A D I N G P A R T N E R A L L I A N C E R E P O R Tcollaborate on a shared view of POS data and to the benefit of all. Therefore, the Alliance
inventory for a single definition of demand at strongly recommends that all FMI/GMA member
the store level, and base all subsequent supply companies and their trading partners adopt
chain calculations from that single forecast, the One Supply Chain approach for OSA
OSA will inevitably be significantly improved excellence.
Insights to Action – The Way Forward
The Alliance has identified four next steps the As with all business processes, improving
industry should take to move toward more on-shelf availability is an on-going journey, not
collaborative and successful OSA process. a destination. This report and the Alliance’s
These are: presentation at the 2015 FMI/GMA Supply Chain
Conference conclude Phase 2 of the Alliance’s
• Adopt a ‘Zero on hand’ baseline definition of
Charter and set the stage for Phase 3, which is
OSA to facilitate better communication and
to formulate and help the industry to execute
standardization for data exchange
a five-year plan to bring OSA to 98 percent. To
• Agreement between retailers and suppliers learn more and become part of this important
on what demand signal is used for event journey, contact your FMI or GMA representative.
forecasting
FMI: Pat Walsh – pwalsh@fmi.org
• Collaboration between retailers and suppliers
GMA: Daniel Triot – dtriot@gmaonline.org
to better align timing between issuance of
event forecasts and production scheduling
requirements
• Collaboration on high-side and low-side range
contingency plans for events
19
S O LV I N G T H E O U T- O F - S T O C K P R O B L E M : A F M I / G M A T R A D I N G P A R T N E R A L L I A N C E R E P O R TAppendix
The FMI/GMA Trading Partner Alliance OSA Sub-Committee includes representatives from the
following companies:
• Food Marketing Institute • JDA Software
• Grocery Manufacturers Association • McCormick
• Clorox • Meijer
• Delhaize • Mondele–z International
• GENCO • Nestlé USA
• HEB • Procter & Gamble
• Inmar • Walgreens
There were a total of 77 retail and manufacturer/distributor respondents to the survey.
20
S O LV I N G T H E O U T- O F - S T O C K P R O B L E M : A F M I / G M A T R A D I N G P A R T N E R A L L I A N C E R E P O R TYou can also read


