Report summary food contact materials and packaging
←
→
Page content transcription
If your browser does not render page correctly, please read the page content below
Report summary food contact materials and
packaging

                    1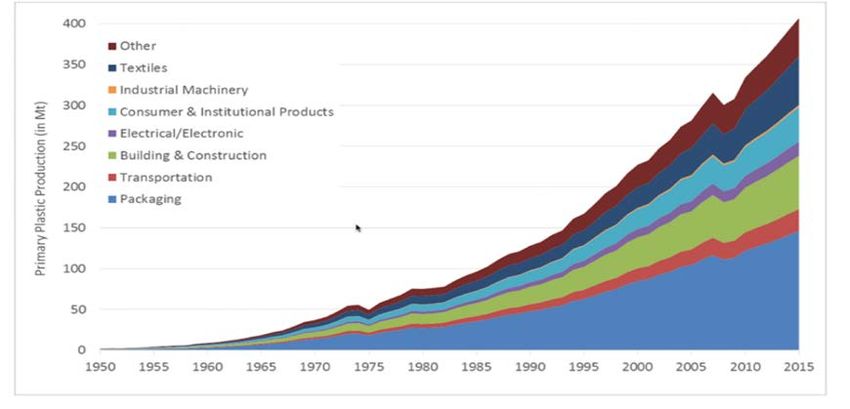
Contents
1. Uses / Applications .................................................................................................................. 3
   1.1 Packaging .................................................................................................................................. 3
   1.2 Consumer cookware ............................................................................................................ 3
   1.3 Industrial applications ....................................................................................................... 4
2. Main PFAS substances ............................................................................................................ 4
   2.1 Packaging .................................................................................................................................. 4
   2.2 Consumer cookware ............................................................................................................ 4
   2.3 Industrial applications ....................................................................................................... 5
3. Manufacturing & market price + market development ...................................... 6
   3.1 Packaging .................................................................................................................................. 6
   3.2 Consumer cookware ............................................................................................................ 8
   3.3 Industrial applications ....................................................................................................... 8
4. Tonnage........................................................................................................................................... 9
   4.1 Packaging .................................................................................................................................. 9
   4.2 Consumer cookware .......................................................................................................... 11
   4.3 Industrial applications ..................................................................................................... 11
5. Emissions product manufacturing and product use ........................................... 12
   5.1 Packaging, consumer cookware and industrial applications.................... 12
6. Exposure ....................................................................................................................................... 17
7. General discussion on emissions and exposure ................................................... 17
8. Alternatives ................................................................................................................................. 18
   8.1 Packaging ................................................................................................................................ 18
   8.2 Consumer cookware .......................................................................................................... 19
   8.3 Industrial applications ..................................................................................................... 19
9. Economic impacts in case of a full PFAS ban .......................................................... 20
   9.1 Packaging ................................................................................................................................ 20
   9.2 Consumer cookware .......................................................................................................... 20
   9.3 Industrial applications ..................................................................................................... 20
10.       Methods used & uncertainties ..................................................................................... 21
   10.1 Packaging ............................................................................................................................. 21
   10.2 Consumer cookware ....................................................................................................... 22
   10.3 Industrial applications .................................................................................................. 22
11.       ANNEX ........................................................................................................................................ 23
12.        References.............................................................................................................................. 26

                                                                            2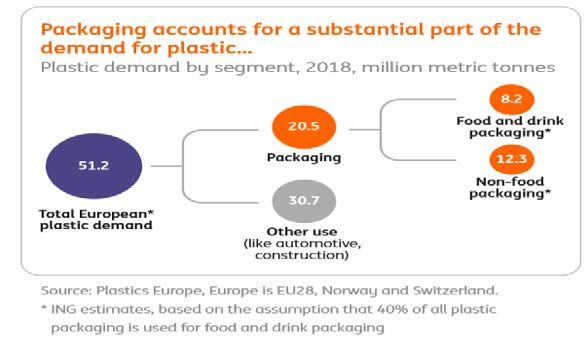
Introduction

The report investigates the use of PFAS in food contact materials (FCM) and packaging, covering the
following applications:

   •   Food contact packaging in which PFAS are largely used to confer oil and grease resistance. Generic
       packaging in which PFAS is assumed to be used (plastics mainly) is also described;
   •   Consumer cookware in which PFAS primarily provide non-stick surfaces;
   •   Industrial food and feed production equipment in which PFAS are used for non-stick surfaces.

The scope of the work covers the manufacture of goods in each sector and the use of those goods.
Production of PFAS and management of materials at end of life (waste stage) are addressed in separate
reports.

1. Uses / Applications
Below the main uses for the applications are described whereby three main topics are distinguished:
Packaging (and other paper applications), consumer cookware and industrial applications.

1.1 Packaging

   •   Food packaging
          o Greaseproof paper;
          o Baking papers;
          o Heat resistant packaging;
          o Other food packaging.
   •   Feed packaging
          o Pet food;
          o Agricultural feed.
   •   Other (generic) packaging
          o Paper and board (P&B) for non-food/feed applications;
          o Other packaging (plastic, glass, metal) for non-food/feed applications;
          o Folding packaging cartons, carbonless forms, masking papers, tablecloths and wall
               papers;
          o Coating of beverage cans;
          o Sheets for protecting new cars.

1.2 Consumer cookware

Non-stick coatings for:
   • Frying pans;
   • Ovenware;
   • Sauce pans;
   • Cooking plates in electric gadgets such as sandwich toasters, waffle irons.

                                                   3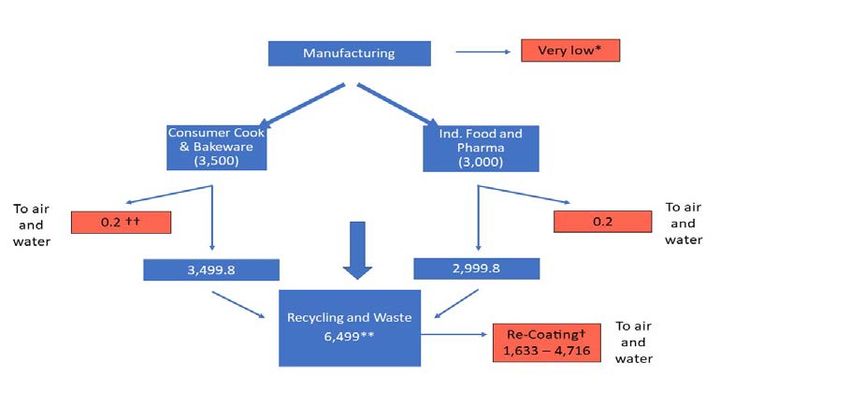
1.3 Industrial applications

One of the main uses for PFAS in food processing lines is to provide a non-stick coating to conveyor belts,
using PTFE or polyvinylidene fluoride (PVDF). Other uses:
    • Ovenware (including recoating services)
    • Variety of components:
            o Seals, O-rings, gaskets;
            o Tubing and pipes;
            o Expansion joints;
            o Valves and fitments;
            o Conveyor belting, chutes, guiding rails, rollers, funnels and sliding plates;
            o Tanks, funnels, roller (etc.) linings;
            o Blades of knives and scissors;
            o Springs;
            o Filter membranes and sensor covers;
            o Lubricants.

2. Main PFAS substances
2.1 Packaging

The majority of substances are fluorosurfactants, mostly telomeric, either as such or as side-chains of
polymers.
    • Telomeric sulphonamides e.g. perfluorooctyl sulphonamide;
    • Sulphonic acids e.g. perfluorobutane sulphonic acid;
    • Fluorotelomer alcohols (phosphate diesters, diPAPs) e.g. (8:2 FTOH) di-phosphate;
    • Perfluoroalkyl phosphonic acids (PFPAs);
    • Propenoic/butanedioic/heptanoic acid esters and as side-chains on a polymer;
    • Polyacrylates with perfluorinated side-chains;
    • Fluorosilicone/siloxanes.

2.2 Consumer cookware

    •   Gen-X - emulsifier, polymer processing aid (PPA)
    •   Fluoropolymers/Monomers:
        •      Ethylene or tetrafluoroethylene (TFE)-based:
               o       PTFE;
               o       Ethylene TFE (ETFE);
               o       Ethylene chlorotrifluoroethylene (ECTFE).
        •      Propylene-based
               o       FEP (perfluoroethylene propylene);
               o       Hexafluoropropylene variations.
        •      Polyvinylidene fluoride (PVDF) – based
               o       Perfluoroalkyl vinyl ethers e.g. PFMVE;
               o       Copolymers of hexafluoropropylene;
               o       PTFE copolymers.
        •      PFA (perfluoroalkoxy ethanes).
               o       Fluorosilicones/siloxanes.
               o       Perfluoroelastomers (terpolymers) (liquid processing systems).

                                                    4
2.3 Industrial applications
The PFAS substances most often used now in industrial processing include PTFE (known as Teflon), FEP,
PFA and ethylene tetrafluoroethylene (ETFE) (co-polymers of ethylene and tetrafluoroethylene known as
Tefzel).
• Gen-X - emulsifier polymer processing aid (PPA)
• Fluoropolymers /Monomers:
• Ethylene or tetrafluoroethylene (TFE)-based:
o PTFE;
o Ethylene TFE (ETFE);
o Ethylene chlorotrifluoroethylene (ECTFE).
• Propylene-based
o FEP (perfluoroethylene propylene);
o Hexafluoropropylene variations.
• Polyvinylidene fluoride (PVDF) – based
o Perfluoroalkyl vinyl ethers e.g. PFMVE;
o Copolymers of hexafluoropropylene;
o PTFE copolymers.
• PFA (perfluoroalkoxy ethanes);
• Fluorosilicones/siloxanes;
• Perfluoroelastomers (terpolymers) (liquid processing systems).
Below in table 1 some (indicative) substances used in food contact material are mentioned. .
Table 1: Substances (indicative list with some examples) used in food contact material.
CAS Chemical Function /
Substance Name Abbreviation Use
Number Formula Regulatory Listing
2,3,3,3-tetrafluoro-2- PPA in Reg. 10/2011.
GenX, Consumer and
heptafluoropropoxy)- Substitute for PFOA
HFPO-DA, 13252-13-6 C6HF11O3 industrial
propinoic acid; or perfluoro[2-(n-
FRD-903 cookware
propoxy)propanoic acid]
Polytetrafluoroethylene; PTFE (Teflon) 9002-84-0 (C2F4)n Cooking and Monomer
a polymer of: tetrafluoroethylene baking listed in Reg 10/2011
116-14-3 C2F4 equipment
Polymer for coating
cookware, such as coatings
on frying pans and articles
for oven baking, and
moulded articles for
industrial use.
Silicone Rubber, fluorinated No data 64706-30-65 No data Liquid
processing No data
equipment
Perfluoroalkyl(C6-C16)
phosphates of bis(2-
hydroxyethyl)amine
NH2+(CH2CH2
or Food, nonfood
OH) (O)P(O-)
Diethanolamine salts of mono- No data 65530-64-5 & feed Additive
(OCH2CH2
and bis(1H,1H,2H,2H- packaging
CnF2n+1)2
perfluoroalkyl(C8-C18)
phosphates
[mono- and di-PAP, FT]
53. Manufacturing & market price + market development
Food and drink is the largest manufacturing sector in the European Union (EU) in terms of turnover, value
added, and employment, making a 2.1% contribution to EU gross value added (Food Drink Europe, 2019).
It was estimated that the food and beverage sector accounted for 15% of turnover and some 13% added
value of the EU manufacturing industry in 2012. The sector involves 291,000 companies, employing some
4.82 million people and generating a turnover of €1.2tr as of 2017 (Food Drink Europe, 2020). Exports
outside the EU account for 10% of the turnover of the food and drink sector (€120 billion out of a total
turnover of €1.2 trillion/year) (Food Drink Europe, 2019).
Import & Export:
No import data was available. Exports outside the EU account for 10% of the turnover of the food and
drink sector (€120 billion out of a total turnover of €1.2 trillion/year) (Food Drink Europe, 2019). No
differentiation for the three topics could be made.
3.1 Packaging
Paper and board packaging use in packaging has been relatively steady in the EU since 2015 (CEPI, 2020).
In 2015, 38.95 million tonnes of paper were consumed in the EU for packaging, whilst in 2019 this figure
had risen to 41.35 million tonnes, representing a compound annual growth rate of 1.5% per year.
Market size was $3.7 billion in 2020 growing 3%, $4.9 billion by 2025. Overall, some factors suggest the
market for PFAS in packaging could grow whilst others suggest the market could shrink.
Paper and board packaging tonnages were based on CEPI information. See table 2.
Table 2: Paper and Board Consumption for Food and Feed & Generic Packaging in Europe in 2019 (CEPI, 2020)
Quantity
(Million tonnes)
Case materials 28.4
Carton board 6.2
Wrappings 2.6
Other paper and board for packaging 4.2
Total 41.4
It is observed that increased recycling of goods contaminated with PFAS will lead to spread of PFAS
throughout all of the paper and board market.
For plastic packaging tonnages, tonnages information is widely available (in contrast to possible PFAS
content information). According to Geyer, Jambeck & Law (Geyer, Jambeck, & Law, 2017) there is a strong
upward trend in global plastic production, including packaging material. See figure 1 below.
6Figure 1: Global Trend in Plastic Demand 1950 – 2015. Source: (Geyer, Jambeck, & Law, 2017)
Regarding the packaging part of plastics the information from ING, 2019 has been used. See figure 2.
Figure 2: Plastic Packaging as a Proportion of total Plastic Demand in Europe. Source (ING, 2019)
Increased demand for plastics and paper and board for packaging appears from industry surveys. It has to
be mentioned that The Single Use Plastic Directive could lead to more moulded fibre food packaging
nearly all of them containing PFAS.
Market price & autonomous market development:
No detailed information on market prices. There is information on price-differences to alternatives (see
the Alternatives chapter). The autonomous market development see also the tables in the Annex.
No. of production sites:
No specific information available.
73.2 Consumer cookware
It has been estimated, based on Plastics Europe information, that 3,500 tonnes of fluoropolymers (FPs)
were sold into the cookware market of the EU28 in 2015, representing sales of €60 million to the
FLUOROPOLYMER industry and with associated goods generating a production value of €2 billion (AFW,
2017). The figure of €60 million represented just under 8% of the FLUOROPOLYMER market in the EU for
2015 (AFW, 2017)
The global non-stick cookware market is estimated to be growing strongly at rates around 5% to 7% per
year and it is estimated that it will be worth $12.5 billion by 2025 (Grand View Research, 2019;
IndustryARC, 2020). Within this, the market for ‘ceramic’ products that do not use PFAS is anticipated by
the same source to be growing around 6.9% per year (Grand View Research, 2019)
It is concluded that the likely trend in the EU consumer cookware market for the next decade in the
absence of a restriction will be for use of Fluoropolymers to be maintained at existing levels, around 3,500
tonnes annually (AFW, 2017).
For EU the best baseline is for constant demand in this sector in the coming years, broadly in line with
stakeholder opinion. There is growth in demand for alternative non-sticks (particularly ceramics) which
could fill growth in demand for non-sticks within Europe.
Market price & autonomous market development:
No detailed information on market prices. There is information on price-differences to alternatives (see
chapter on Alternatives). For autonomous market development see also the tables in the Annex.
No. of production sites:
No specific information available.
3.3 Industrial applications
There is potential for some growth in the market for PFAS particularly on the component side (rather than
coatings) given stricter legislation on food quality and the use of more severe conditions for cleaning and
sterilisation of food processing equipment. Estimated growth ranges in the order of 10-20%
by 2025 relative to 2015. A future estimate of growth of 1-2% seems appropriate. Applied to the 3,000
tonnes per year usage for the EU28 in 2015 (AFW, 2017), demand would increase to between 3,300 and
3,700 tonnes per year (noting that this range covers both food and pharmaceutical operations, and that
it has not been possible to disaggregate the quantities for each application).
Market price & autonomous market development:
No detailed information on market prices. There is information on price-differences to alternatives (see
the Alternatives chapter). For autonomous market development see also the tables in the Annex.
No. of production sites:
No specific information available.
84. Tonnage
4.1 Packaging
Paper and board (P&B) packaging
EEA-wide tonnage figures of PFAS used in paper and board food packaging in this project have not been
identified in the literature or from stakeholders. Instead, the PFAS tonnages utilised as a basis for deriving
emission estimates have been calculated from available data with a number of assumptions applied. The
sources of data for estimating PFAS tonnages in Paper & Board (P&B) packaging are as follows and the
data used are tabulated in the below table 3.
Table 3: Summary of Data Used for Estimating PFAS (Surfactants) Tonnage in Paper and Board Food Packaging
Geographical Coverage Data Source
Tonnes
Total P&B Packaging EU-27 & United Kingdom Carton Board 6,169,000 (CEPI, 2020)
Consumption (UK) Data from 2019
(That may be used in & Norway (NO) Wrapping 2,647,000
food & feed contact i.e.
closest disaggregated Sum of above 8,816,000
categories to food
packaging) Case materials 28,369,000
Other P&B 4,166,000
packaging
Total 41,351,000**
Total organic fluorine UK 95% of the Range of fluorine (Fidra, 2020)
content of supermarket packaging had content (mg/kg or
food packaging e.g. fluorine content g/tonne):
popcorn bags, cookie Average = 537
bags, pizza boxes, Maximum = 1200
greaseproof paper.
Paper and paperboard US 46% food contact papers and 20% (Schaider et al, 2017)
food wrappers from paperboard samples have detectable
fast food restaurants fluorine
Permitted EU and US EU(BfR): 0.5 – 1.2% Range is: (BfR, 2020b)
concentrations of PFAS US FDA typically 0.4 – 1.2% (U.S. Food and Drug
in paper and board food 0.5% (dry weight) Administration, 2021)
packaging Call for evidence
0.4 – 1.0%
Estimate of the Not specified (assumed EU) Up to 1% (assume 0.5 – 1.0%) (RIVM, 2020a)
proportion of total*
paper packaging that
contains PFAS
Notes: *Presumed to be packaging that may come into contact with food, rather than generic (packaging for non-food items)
packaging; **Assumed to include feed and food contact P&B
In the table below, based on Paper & Board packaging tonnages and average PFAS content (see table 3),
PFAS quantity is calculated
9Table 4: Estimates of Intentionally Added PFAS in Total P&B Packaging for Different Assumptions According to in EU-
27 & UK & NO 2019
Proportion of Total P&B with Quantity of P&B* Permitted Level PFAS (%) Quantity of PFAS
PFAS (%) (tonnes) (tonnes)
0.5 206,755** 0.4 827
206,755 1.2 2,481
1.0 413,510** 0.4 1,654
413,510 1.2 4,962
*: Based on total Paper and Board (P&B) Packaging consumption = 41.351,000 tonnes.
**: See also calculation below
Range of P&B packaging containing PFAS:
If 0.5% of the total P&B packaging consumed
contains PFAS (RIVM, 2020a) = 0.5/100 x 41,351,000
= 206,755 tonnes of P&B packaging
If 1.0% of the total P&B packaging consumed
contains PFAS (RIVM, 2020a)
= 1.0/100 x 41,351,000
= 413,510 tonnes of P&B packaging
i.e. the quantity of P&B packaging containing PFAS in 2019 was 206,755 – 413,510 tonnes
For comparison purposes, the quantities of PFAS in P&B food packaging were estimated in addition using
a different starting assumption i.e. the fluorine content of the P&B packaging. From (Fidra, 2020), the
quantity of fluorine that is present in P&B packaging is a maximum of 1200 mg/kg (equivalent to g/tonne)
or an average of 537 g/tonne. These two figures have been used to derive a range of the total quantity of
PFAS in wrapping and board packaging. To estimate the PFAS content of P&B packaging an approximation
of the PFAS content has been derived assuming the fluorine content is 50% of the total molecular weight.
This is based upon an estimated average value assuming the PFAS present can be molecules such as
perfluorohexanoic acid (PFHxA) (fluorine content 66%), or side-chain polyacrylates e.g. polymethacrylate
(fluorine content is 12.8% (Wenqiang, 2014)) that was also utilised in the proposed restriction for PFHxA
(ECHA, 2020b). See table 5 for the results.
Table 5: Estimates of PFAS in Carton Board and Paper Wrapping Packaging for Different Assumptions Based on
Detected Fluorine Levels in EU-27 & UK & NO 2019
Proportion of Quantity of Quantity with Detected fluorine Quantity Quantity of
Wrapping and carton and PFAS** concentration† fluorine in PFAS††
Carton board wrapping* (tonnes) (g/tonne) paper or board$ (tonnes)
with PFAS (%) (tonnes) (tonnes)
46 (paper) 2,647,000 1,217,620 537 654 1,308
2,647,000 1,217,620 1200 1,461 2,922
95 (paper) 2,647,000 2,514,650 537 1,350 2,700
2,647,000 2,514,650 1200 3,018 6,036
20 (board) 6,169,000 1,233,800 537 663 1,326
6,169,000 1,233,800 1200 1,481 2,962
Notes:
• * from Table 3
• **(column 1 /100) x column 2
• † maximum and average concentration of fluorine detected in supermarket and fast food restaurant P&B packaging
(Fidra, 2020)
• ††Quantity of PFAS is calculated from the fluorine content assuming fluorine comprises 50% of the molecular weight
Without further information to enable a more accurate analysis, the upper and lower bound of each of
the ranges of tonnages from table 4 and 5 have been utilised to estimate emissions during the service-life
of paper and board packaging.
10Generic plastic packaging
Publicly available data on the quantities of plastic packaging that contains PFAS have not been identified.
Expert judgement estimates of the quantity of plastic packaging that contains PFAS (residues) is
approximately maximum 0.1% (RIVM, 2020a). Applying this expert judgement and assuming the use of
PFAS would be mainly in plastics with food contact:
4.2 Consumer cookware
Pharmaceutical applications are outside of the scope of this report and because the data for this segment
are not broken down further in (AFW, 2017) 1, the quantity of 3,000 tonnes is an over-estimate of the total
amount of Fluoropolymers used in the food industry. These data cover EU-28 (i.e. including the UK) and
include imported Fluoropolymers as well as those manufactured in the EEA.
Table 6 Tonnage data (2015) Used for the Emission Estimates from Fluoropolymers (AFW, 2017)
Market Segment Quantity of Fluoropolymers Sold (tonnes)
Consumer Cook and Bakeware 3,500
Industrial Food Production and Pharmaceuticals 3,000
From the description in (AFW, 2017) this data does not include any polymer processing aids (PPAs) that
have been used in the production of Fluoropolymers, except it can be assumed any present as an impurity
in the final Fluoropolymer.
4.3 Industrial applications
Tonnages of Fluoropolymers are disaggregated to some degree in (AFW, 2017). For the industrial use
category ‘food and pharmaceuticals’, 3,000 tonnes of Fluoropolymers were sold in the EU-28 in 2015.
Unfortunately, this figure has not been able to be further disaggregated to provide a split between the
food and pharmaceutical sectors. Given the uncertainties, the tonnage and emission estimates described
should be regarded as indicative only.
The yearly European Economic Area (EEA) PFAS tonnages used are summarised for the three applications.
Emissions to the environment are also mentioned in the scheme below.
Sub uses Tonnages/y
Packaging 827 - 4.962
Consumer cookware 3.500
Industrial applications 3.000
1
Plastics Europe has not been able to provide any further disaggregated data.
115. Emissions product manufacturing and product use
5.1 Packaging, consumer cookware and industrial applications
Because PFAS emission data are not generally available, one method that has been employed in the
current report is to derive emission estimates using the so-called ‘standard REACH methodology’, which
is set out in ECHA’s R.16 Guidance (ECHA, 2016). Estimates presented here are derived using the first level
(tier 1) methodology. This relies upon having tonnage data for the substance(s) of interest at the relevant
point in the life cycle of that substance. In table 7 the emissions during manufacturing of Paper & Board
are presented. In table 8 the emissions during service life of Paper & Board are presented.
Table 7: Summary of Estimated PFAS Emissions from the Manufacture of Paper and Board Packaging (2019),
Consumer and Industrial Cookware
Material Method Used Addition/Detection PFAS Emissions from Use at an Industrial site Total Emissions*
(tonnes/year) (tonnes/year)
Air Water Soil
Quantitative REACH Intentionally** added
Methodology (ECHA, 471.5 471.5 9.4 943.0
lower
Paper and Board 2016)
Food Packaging in Calculated using
EU-27 & UK Environmental Release
Detected† higher 3440.5 3440.5 68.8 6,881.0
& NO(2019) Category (ERC) 5
(Surfactants)
Quantitative Emissions
from P&B manufacturing Intentionally** added No data 11.3 – 82.6 101.8 – 743.1 113.1 – 825.7
(FDA, 2010)
Consumer and
Industrial Cookware
(EEA) No No
No quantitative
(Fluoropolymers Qualitative Intentionally added quantitative quantitative Very Low
data
excluding polymer data data
processing aids)
Notes:
*Sum of emissions to individual environmental compartments
**i.e. added during the papermaking process during this revolution of the papermaking-recycling loop, †Detected by measuring total fluorine
concentration in food packaging, so includes PFAS from current and possibly previous revolutions of the papermaking-recycling loop. Shaded
data used in in tonnage flow diagrams (Figure 3).
12Table 8: Summary of Estimated PFAS Emissions from Articles During their Service-life (Indoors and Outdoors)
Addition/ Detection Total PFAS Emissions Total Outdoor Total PFAS emissions Total
from widespread use Emissions$ from widespread use Indoor Emissions$
Material Use* ERC 10a (Outdoor) (tonnes/year) ERC 11a (Indoor) (tonnes/year)
(kg/year) (kg/year)
Air Water Soil Air Water Soil
Intentionally added
21 – 41 1,323 – 2,646 1,323 – 2,646 2.7 – 5.3 21 - 41 21 - 41 Not applicable 0.0 – 0.1
Total paper and lower**
board food
Paper and Board packaging Intentionally added
62 – 124 3,970 – 7,939 3,970 – 7,939 8.0 – 16.0 62 – 124 62 – 124 Not applicable 0.1 – 0.3
Food Packaging in higher†
EU-27 & UK
& NO
Consumer Food 33 – 73 2,093 – 4,675 2,093 – 4,675 4.2 – 9.4 33 – 73 33 – 73 Not applicable 0.1 – 0.2
(2019)
Wrappings Detected lower
(Surfactants)
Detected higher 68 – 151 4,320 – 9,658 4,320 – 9,658 8.7 – 19.5 68 – 151 68 – 151 Not applicable 0.1 – 0.3
Consumer Food Detected lower 33 2,122 2,122 4.3 33 33 Not applicable 0.1
Carton Board
9.6 Not applicable 0.2
Packaging Detected higher 74 4,739 4,739 74 74
Fluoropolymers Sold
in EU-28 Consumer Cook
(2015) Not applicable 88 5,600 5,600 11.3 88 88 Not applicable 0.2
and Bakeware
(Fluoropolymers
excluding polymer
processing aids) Food and
Pharma Not applicable 75 4,800 4,800 9.7 75 75 Not applicable 0.2
Industry Use††
Notes: PFAS used in paper and board packaging are surfactants (telomers and polymers with telomeric side-chains; PFAS used in consumer and industrial cookware are fluoropolymers. Data from polymer processing aids has not been
included, except for impurities. The emission estimates of PFAS from Fluoropolymers in this table are based upon EU-28 consumption data that excludes exports but included imports.
*For each of the uses different estimates are derived based on different assumptions i.e. all the emission estimates are not intended to be summed up, however the results of the comparable estimations have been used to derive
ranges. **derived from the lower end of a range of figures, † derived from the higher end of a range of figures, ††The source data includes Fluoropolymer use in the pharmaceutical industry that is not in the scope of the report but
cannot be separated out. Therefore, the resulting emissions can be over-estimates. Shaded data used in tonnage flow diagrams (Figure 4).$ Emissions from outdoor and indoor uses should not be summed together; instead, they
represent possible emissions if the total tonnage is used either outdoors or indoors.
Re-coating emissions not mentioned here but plotted in figure 4 and explained in table 9
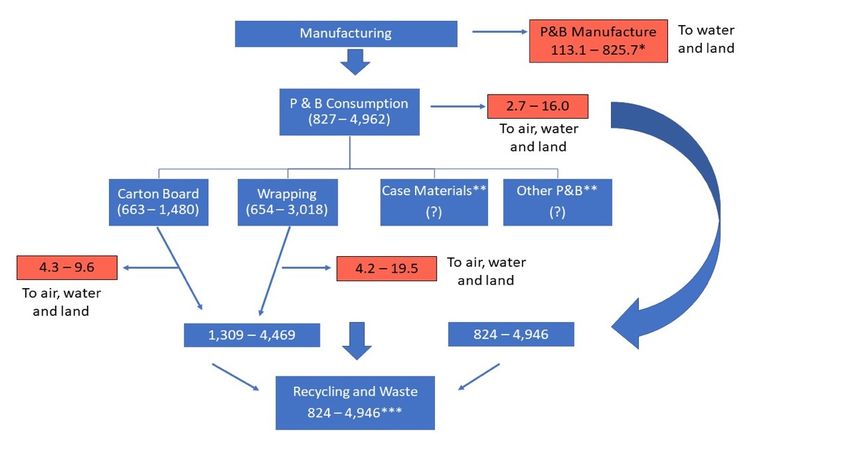
13Below a tonnage and emission flow chart for paper and board packaging (the main packaging use where
PFAS is applied) is plotted
Estimates either from
total P&B consumption
(right branch) or from
data for carton board and
wrapping packing (left
branch) result in
reasonably similar
estimates of the total
PFAS tonnage flows from
manufacturing to
recycling or waste
disposal.
Figure 3: Indicative PFAS (surfactant) tonnage flows (tonnes/year) for paper & board packaging in 2019 (EU-27 & NO
& UK)
Notes for Figure:
Values in red boxes are emissions of PFAS/year. Emissions of PFAS from the service-life of packaging are based solely on outdoor use and
represent a worst-case scenario. Outdoor emissions could be considered to include emissions from litter
Values in blue boxes are tonnage flows of PFAS from manufacturing through the service-life of products to waste/recycling.
• *Emissions from paper and board (P&B) manufacturing represent a reasonable worst-case scenario.
• ** It has not been possible to clarify the quantities of PFAS in vase materials and other P&B.
• ***The quantities of PFAS going to waste/recycling is either 1,309 – 4,469 tonnes or 824 – 4,926 tonnes, depending upon the starting
point for the estimate - either right or left branch.
For indicative purposes, the widest range of tonnages is indicated. (CEPI, 2020) notes 72% of P&B packaging is recycled in EU-27 & NO & UK.
There may be PFAS in case materials and other P&B packaging, but no data has been identified to support this. Polymer processing aid emission
are not included, except for impurities.
The data on PFAS in generic packaging are scarce and during the extensive stakeholder consultation to
prepare the report, data returns on this issue have been very low. Nevertheless, on the basis of available
data, emissions of PFAS from generic packaging has been addressed in a qualitative manner.
14PFAS emissions from the manufacturing of P&B food and feed contact materials have been estimated
using:
• The REACH methodology (ERC’s) and
• Data that is available from PFAS entries in the US Inventory of Effective Food Contact Substance
(FCS) Notifications (U.S. Food and Drug Administration, 2021) for large US P&B manufacturing
plants. The US FDA data is based upon information from the P&B industry and is therefore
expected to be more representative of real life than the generic approach of the REACH
methodology.
Below a tonnage and emission flow chart for consumer cookware and industrial cookware is plotted.
Figure 4: Indicative PFAS (Fluoropolymers) Tonnage Flows (Tonnes/year) For Consumer Cookware and Industrial Food
Products in 2015 (EU-28)
Notes for Figure:
Values in red boxes are emissions of PFAS (fluoropolymer)/year. Emissions of PFAS during their service-life when used in the food industry are
based solely on indoor use and represent a reasonable worst-case scenario. Values in blue boxes are tonnage flows of PFAS from manufacturing
through the service-life of products to waste/recycling. Emissions from the service-life of consumer cookware and industrial products is a very
small proportion of the overall quantity of PFAS flow. PFAS removed from re-coating appears to be a much larger proportion. The remaining
quantities have been expressed with a decimal point to indicate the prior emissions and do not reflect their accuracy.
• * Emissions from manufacturing are estimated on a qualitative basis and are for normal operating conditions.
• ** The total quantities of PFAS going to the waste/recycling phase of the life cycle are summed for indicative purposes (note this is an
over-estimate). PFAS-coated metal cookware is generally recycled at the end of its life to reclaim the valuable metal (STO, 2020-21).
• † Emissions from re-coating industrial cookware are a worst-case scenario estimate.
• †† Qualitative evidence suggests losses from consumer cookware could be 10% or more. Polymer processing aid emissions are not
included, except for impurities.
No publications have been identified that indicate the quantity of Fluoropolymer lost during cookware
use by consumers. However, numerous examples have been found online on consumer websites of pans
that have clearly lost a significant part (10%* or more) of the Fluoropolymer-coating during use, revealing
the bare metal.
*: 10% of 6,500 = 650, with an average life span of approximately 5 years, leads to 130 tonnes/y. This is emitted to the environment.
15During the preparation of the report, re-coating has been seen as a potential emission source.
Comprehensive data on the quantities of Fluoropolymers removed from industrial cookware for recycling
purposes (which is then re-coated) have not been identified. However, in Sweden, information was
available and has been extrapolated. Given the uncertainties with the tonnage and emission estimates,
the values should be regarded as indicative only.
Table 9: Data Used to Calculate the Quantities of PTFE in Industrial Cookware
Parameter Quantity Source
Pans re-coated in Sweden each 20,000* (RIVM, 2020b)
year**
Total surface area of the Swedish 500,000 sq. metres (RIVM, 2020b)
pans
Population of Sweden 10.38 million (Statista, 2020)
Population of EEA (without UK) 453,500,612 (Eurostat, 2020a)
Density of PTFE 2.16 g/cubic cm (WSH, 2021)
Average coating thickness 35 – 100 µm (PTFE Coatings, 2021)
Notes: *Assumed to be number of units stripped and re-coated per year; **Assumed to be in all of Sweden, i.e. not one operators’
data.
i.e. in Sweden each year between 37.8 – 108 tonnes of PTFE are removed from industrial bakeware.
In the table below, the PFAS emissions for packaging, consumer cookware and industrial cookware are
presented.
16Table 10: Key Findings from the Exposure Assessment – Emissions of PFAS & methods used
Life-Cycle Phase PFAS Emission PFAS Type Coverage Estimation Scenario Methodology Other Details
and Activity Estimate ***
(tonnes/year)
Service-life of P&B 2.7 – 19.5 Telomers and EU-27 & UK & NO Worst-case REACH* Based on outdoor
FCM Packaging polymers with side- emissions
chain telomers
Service-life of 0.2** Fluoropolymers EU-28 Reasonable worst-case REACH Based on indoor
Consumer emissions
Cookware
Service-life of 0.2† Fluoropolymers EU-28 Worst-case REACH Based on indoor
products used in emissions
the food industry
Manufacturing of 113.1 – 825.7 Telomers and EU-27 & UK & NO Reasonable worst-case Calculation from Based on data for large
P&B FCM polymers with side- stakeholder data installations in the US
Packaging chain telomers
Manufacturing Very low Fluoropolymers and EEA Normal operating Estimation Qualitative
Consumer PPAs conditions from stakeholder assessment
Cookware and data
Products used in
Re-coating 1,633 to 4,716 Fluoropolymers and EEA Worst-case Calculation from Calculation is for PTFE
Industrial PPAs stakeholder data only
Cookware
PFAS used in paper and board packaging are surfactants (telomers and polymers with telomeric side-chains; PFAS used in consumer and
industrial cookware are fluoropolymers. Emission data based on polymer processing aids (PPAs) has not been included, except for impurities.
• * Standard REACH methodology (ECHA, 2016).
• ** May be an under-estimate.
• *** Type of PFAS from which emissions originate using expert judgement. † May be an over-estimate.
It is envisaged that use and emissions of PFAS in these sectors will continue at a similar rate to the
estimates today. There is evidence of some trends in parts of the market, but these suggest a mix of
increasing and decreasing demand.
6. Exposure
Others than emissions to environment this is not described.
7. General discussion on emissions and exposure
The extent to which the data collected for the food industry is applicable to the animal feed industry
is unclear. The relevant EU trade associations and a leading company have all highlighted that there is
an absence of data on this issue. Given the high-performance grease and water repellence properties
needed for some animal feed packaging (STO, 2020-21) it is likely that PFAS are used for this function
in the same way as in food packaging. This is supported by other recent work (OECD, 2020). For the
purposes of this report and based on this evidence, it is assumed that the FCMs used in food packaging
and Fluoropolymers used for human food process applications are similar to those used in animal feed
applications. No calculations have been made for feed applications however.
17Emissions during the production and use of articles are, in general, small, apart from the production
of PFAS treated paper and board and recoating operations for industrial bakeware. Understanding of
waste management systems and the fate of PFAS sent to waste management is therefore extremely
important for understanding the potential for human exposure from these sources.
8. Alternatives
8.1 Packaging
A wide range of alternatives for packaging is available including:
• Natural greaseproof paper
• Clay coatings
• Silicone
• Biopolymers
• Synthetic plastics
• Waxes
The assessment found several options that met the necessary criteria made from uncoated paper, or
paper treated with waxes and clay. Several other options met at least some criteria whilst on others
it was concluded that there was insufficient data available to pass judgment. A study for the Nordic
Council has come to similar conclusions that alternatives to the use of fluorinated materials are
available and functional for almost all uses of paper and board FCMs intended for various foods, and
close to cost-neutral for retailers, and hence likely also for manufacturers (Trier, Taxvig, Rosenmai, &
Pedersen, 2017).
The OECD (OECD, 2020) reported that the key reason for the current lack of market share of non-
fluorinated alternatives is their higher cost. The study indicated that PFAS-free paper and board for
food packaging is 11-32% more expensive than food packaging using short chain PFAS (OECD, 2020).
Table 11: Comparison of the Costs of Alternatives Used in Paper and Board Food Packaging.
Paper/board product Average* cost and Average cost Average difference Average difference
treatment (€/tonne difference between between base paper between PFAS-
paper) base paper and PFAS- and PFAS- treated treated and non-
treated and non- and non-fluorinated fluorinated paper
fluorinated paper paper (%)
(€/tonne paper) (%)
Base paper 1,250 Not applicable Not applicable Not applicable
Short-chain PFAS 1,400 +150 +12 +11 to +32%
Chemical 1,550 +300 +24% +11%
alternative
Physical alternative 1,850 +600 +48% +32%
*: Source: (OECD, 2020)
18The analysis suggests that costs of switching away from the PBT substance to alternatives in the food
packaging market is proportionate to the reduction in risk, based on comparison with the indicative
benchmarks that have been used previously in REACH.
8.2 Consumer cookware
• Ceramic, silicone coatings
• Stainless steel
• Silicone bakeware (not just coated)
• Anodised aluminium
Other options (e.g. copper) have little penetration into the market or are not yet widely
available/tested (e.g. superhydrophobic coatings).
There are several alternatives to the use of Fluoropolymer-coated cookware that are already available
on the consumer market, and in some cases have significant market share. Currently, there is little
evidence for systematic differences in price between these options. There is good evidence that good
quality Fluoropolymer-coated options will outlast ceramic coatings, which in turn will be outlasted by,
for example stainless steel pans. To further complicate the situation, consumer surveys indicate that
a good quality ceramic coating can be expected to outlast a low-quality Fluoropolymer coating
(Which?, 2021).
8.3 Industrial applications
• Ceramic, silicone coatings (e.g. industrial cookware)
• Stainless steel (e.g. industrial cookware, production line components)
• Silicone bakeware (e.g. industrial cookware, lubricants, seals)
• Synthetic rubbers (e.g. seals, gaskets, pipes, tubes for liquid processing)
These options applied for different uses, e.g. ceramic or silicone coatings to bakeware, synthetic
rubbers for components such as gaskets and tubing.
The use of Fluoropolymers in the industrial food and feed sectors is complicated by a wide variety of
applications from baking tin coatings to pipes, pipe coatings and various types of seal, with differing
potential for PFAS release and population exposure. The ease of substituting alternatives will be
similarly variable.
Some parts of the market (e.g. some industrial bakeries) are already using alternatives to
Fluoropolymer coatings in bakeware. Analysis has been presented by one company demonstrating
that whilst the coatings do not last as long as Fluoropolymer coatings, and hence need more frequent
re-coating, the overall cost of re-coating operations is significantly cheaper. Another company
providing a similar service, however, claims that the use of Fluoropolymer coatings is essential.
Estimates of the quantity of PFAS released as a result of Fluoropolymer use by the sector are
dependent to a large extent on the waste management phase.
199. Economic impacts in case of a full PFAS ban
9.1 Packaging
The Washington State Department of Ecology (Washington State DOE, 2021) has carried out an
extensive analysis for an assessment of alternatives to the use of PFAS in food packaging. Limited
information has been obtained on the difference in price between packaging options. Results from
the Washington State study did not show systematic differences in price between PFAS- and non-PFAS
options, for several specific types of article (Washington State DOE, 2021)
Results indicated a range for the substitution cost of €37.5 to €112.5 per kg for a PFAS content of the
paper of 0.4%, and €12.5 to €37.5 per kg for a PFAS content of the paper of 1.2%. All estimates are
well below the lower indicative benchmark of €1,000 per kilogram PBT substance observed by
(Oosterhuis, 2017).
9.2 Consumer cookware
There are several alternatives to the use of Fluoropolymer-coated cookware that are already available
on the consumer market, and in some cases have significant market share. Currently, there is little
evidence for systematic differences in price between these options.
Information from observed prices on the market indicate that there is no systematic difference in the
price of frying pans manufactured using Fluoropolymer or other coatings. On this basis, even a small
reduction in emissions associated with a switch to alternatives is proportional for goods with a similar
product lifetime. The longer service lifetimes for some Fluoropolymer coated goods compared to
some alternatives (particularly ceramic coatings) can, however, affect this conclusion. Nevertheless,
some uncoated kitchenware (e.g. stainless steel saucepans) can far outlast Fluoropolymer-coated
pans, so for that part of the market the reverse situation applies.
9.3 Industrial applications
There are numerous elements to economic impacts of a ban on the use of Fluoropolymers in the food
and feed production and transport sectors, including: Non-Fluoropolymer options are clearly available
on the market to perform the same general functions.
Some elements of cost are described drawing on information from the stakeholder consultation. It
should be noted that respondents were mainly from companies providing or using Fluoropolymers,
rather than producers and users of alternatives:
• The cost of components made of different materials. Data collected (AFW, 2017) indicate a
cost for PTFE in the region of €17,000 to €20,000 / tonne and of Fluoropolymer more generally
averaging around €15,000/t, leading to a factor 3 increase in the costs of some components
(specifically, pipes and tubing were identified).
• The costs of R&D to develop new solutions has to be taken into account
• Increased downtime and shorter service life has to be taken into account
The diversity of the food and drink sector, the range of applications of Fluoropolymers within the
sector and the lack of data on many of those applications prevents calculation of the economic impacts
of a restriction to a reasonable level of confidence.
2010. Methods used & uncertainties
Comprehensive data on the quantities of PFAS placed on the EEA market for the uses in the scope of
this report are not publicly available.
PFAS used in packaging have been estimated by several methods taking as a starting point the P&B
market data such as tonnage consumed that is publicly available from the Confederation of European
Paper Industries (CEPI, 2020). The geographical scope of this includes the European Union (EU)-27,
the United Kingdom (UK) and Norway.
The quantities of Fluoropolymers consumed in EU-28 primarily have been drawn from a Plastics
Europe source – A Socio-economic Analysis of the European Fluoropolymer Industry (AFW, 2017). This
contains data for the Fluoropolymer market in 2015 and is disaggregated into various market
segments. From discussions with stakeholders (STO, 2020-21) it is understood these data are the most
accurate and comprehensive that are publicly available, are widely used by industry, and have been
constructed partially from data obtained from Fluoropolymer manufacturers, but also from EUROSTAT
data averaged over a five-year period to reduce the effects of annual fluctuations (AFW, 2017). These
data are also currently in the process of being updated (STO, 2020-21). In the absence of other
comparable data, these data have been used as the principal source of Fluoropolymer consumption
data.
On the basis of the above sources and emission estimates from the Exposure Assessment module,
indicative tonnage flows have been constructed from product manufacturing through to end-of-
life/recycling.
Assuming the estimates of usage from (AFW, 2017) are broadly correct (acknowledging that they cover
both the food and pharmaceutical industries rather than food specifically), the major uncertainty
affecting the analysis concerns the fraction of PFAS emitted as a result of use by the sector.
10.1 Packaging
Important uncertainties are present in the estimation of the quantities of PFAS used in the packaging
sector and resulting emissions. In the absence of a comprehensive list of PFAS currently used in FCMs
in the European Economic Area (EEA), EEA manufacturers and suppliers refer to three legislative
regulatory positive lists (‘regulatory lists’)
The three main regulatory lists are:
1) Recommendations for consumer products that meet the requirements of § 31.1 of the
German Foods, Consumer Articles and Feed Act and of Article 3 (1a) of Regulation (EC) No.
1935/2004 on materials and articles intended to come into contact with food (‘BfR
Recommendation list’) published by the German Federal Institute for Risk Assessment (BfR)
(BfR, 2019c);
2) PFAS entries in the US Inventory of Effective Food Contact Substance (FCS) Notifications to
the US Food and Drug Administration (FDA) which authorises food contact substances through
Title 21 Code of Federal Regulations Part 176 (‘FDA 21 Code’) and under the Food Contact
Notification program (FDA, 2019) (U.S. Food and Drug Administration, 2021); and
213) Commission Regulation (EU) No 10/2011 of 14 January 2011 on plastic materials and articles
intended to come into contact with food 2 (‘EU 10/2011’). Annex I of this Regulation is a
positive list of authorised monomers, other starting substances, macromolecules obtained
from microbial fermentation, additives and polymer production aids (PPAs) that may come
into contact with food and limit values are established for some individual substances.
To supplement these sources, other principal sources of data for PFAS used/were used included: 1)
the stakeholder consultation (STO, 2020-21) and 2) literatures sources (Glüge et al, 2020; Trier, Taxvig,
Rosenmai, & Pedersen, 2017; Bokkers B. , 2018), and to a limited degree several individual European
Food Safety Agency (EFSA) opinion substance reports and a report ‘Product – Chemical Profile for Food
Packaging Containing Perfluoroalkyl or Polyfluoroalkyl Substances’ (California Environmental
Protection Agency, 2020).
Chemical substance identification is not straightforward from these regulatory lists for several
reasons. The entries are often not listed as a substance but instead as components of reaction
mixtures
10.2 Consumer cookware
During the preparation of the report insufficient information has been obtained to allow a quantitative
estimation of the emissions during the manufacture of domestic and industrial cookware. Because of
the absence of such information, even a default calculation by the REACH methodology has not been
possible.
10.3 Industrial applications
In case of recoating the removed coating can be released in gaseous emissions or to water, depending
upon whether the coating is removed by ‘burning off’ at 450 C for 4-5hrs to break down the coating
followed by grit blasting (RIVM, 2020b); water blasting at 1500 bar (RIVM, 2020b); or by abrasive
stripping (Guerrero-Vaca et al, 2020). Burning off has the potential to release PFAS breakdown
substance such as trifluoracetic acid (TFA) (Nature, 2001) to air, subsequent grit blasting or abrasive
removal has the potential to create solid waste and water blasting emissions to the aquatic
compartment.
From the data available here, it has not been possible to allocate the emissions to the different
environmental compartments, or to estimate the quantity of the total PTFE removed that actually
ends up in the environment, because it is assumed that a significant fraction is removed by risk
management measures at re-coating installations in the EU before being released to the environment.
Stakeholders contributing to this report have explained PFAS-coated metal cookware is generally
recycled at the end of its life (STO, 2020-21). This is particularly the case for cookware from industrial
sources. (And to a lesser degree from consumer sources). However, the current primary aim of this
recycling is to reclaim the valuable metal, rather than remove the PFAS.
Another uncertainty is in relation to the quantities of PFAS in comparison with the total quantity of
PFAS consumed by the food industry of 3,000 tonnes, a figure recognised to be an over-estimate
because it also includes PFAS used in the pharmaceutical industry.
2
https://eur-lex.europa.eu/legal-content/EN/TXT/PDF/?uri=CELEX:32011R0010&from=EN
2211. ANNEX
Tonnage & emissions
PFAS emissions
Tonnage
(tonnes/y) in EEA
Expected trend
Sub-use (tonnes/y in EEA) (--/-/0/+/++)* Ex. waste stage emissions
PFAS solely polymers in table
Product: 41,351,000
(paper and board)
Product: 20,500,000
(plastic packaging)
Packaging + (3%) 124 – 871
PFAS: 827 – 4,962
ton (in paper and
board)
PFAS: No data (for
plastic packaging)
Product: No data
Cookware PFAS: 3,500 ton + (5%)
(Plastic Europe,
AFW, 2017)
1,633 – 4,716
Product: No data
(mainly recoating emissions)
PFAS: 3,000* ton
Industrial applications (Plastic Europe, ++ (10-20%)
AFW, 2017)
*: including pharmaceuticals
(could not be disaggregated)
*-- = strong decrease, - = decrease, + = increase, ++ = strong increase, 0 = neutral
23Alternatives
Sub-use Non-PFAS alternatives
Packaging Natural greaseproof paper
Vegetable parchment
Clay coatings
Silicone
Biopolymers
(e.g. chitosan, starch, cellulose, polyvinyl alcohol, bioplastics such as polylactic acid (PLA),
biowaxes)
Synthetic plastics
(e.g. low-density polyethylene (LDPE), linear low-density polyethylene (LLDPE), high
density polyethylene (HDPE), polypropylene (PE), ethylene vinyl alcohol (EVOH), polyvinyl
alcohol (PVOH), polyvinylidene chloride (PVDC), polyethylene terephthalate (PET))
Microfibrillar cellulose (MFC), cellulose nanofibrils (CNFs), cellulose nanocrystals (CNCs)
Aqueous dispersions of co-polymers (e.g. styrene acrylic emulsion (SAE))
Aqueous dispersions of waxes (e.g. TopScreen)
Water soluble hydroxyethylcellulose (HEC)
Alkyl succinic anhydride (ASA), alkyl ketene dimer (AKD)
Aluminium foil
Lamination using impermeable barriers
Other plant fibres (miscanthus, etc.)
Bitumen coating
Re-usable materials
24Sub-use Non-PFAS alternatives
‘Ceramic’ coatings (sol-gel)
Consumer Cookware Replacement of coating material
Silicone coatings
Replacement of coating material
Silicone cookware (not coated metal)
Alternative base material, uncoated
Superhydrophobic coatings
Hydrophobic coatings, replacement of coating material
Nanoscopic layer which is able to resist water. They are made from different materials like
zinc oxide polystyrene, precipitated calcium carbonate, carbon nano-tube substances,
manganese oxide polystyrene.
Enamelled cast iron / seasoned cast iron
Alternative base material and non-stick coating
Full ceramic cookware (not just coated)
Alternative base material
Carbon steel
Alternative base material, uncoated
Anodized aluminium coating
Alternative base material, may be coated
Stainless steel
Alternative base material, uncoated
Copper
Alternative base material, uncoated
Industrial applications Stainless steel
Ceramic coatings
Silicone and silicone coatings
Synthetic rubbers and similar compounds (nitrile rubber, ethylene propylene rubber,
neoprene, PES (polyethersulfone))
2512. References
AFW. (2017). Socio-economic Analysis of the European Fluoropolymer Industry. Amec
Foster Wheeler, for Plastics Europe.
BfR. (2019c). Paper and board for food contact . Retrieved from
https://bfr.ble.de/kse/faces/resources/pdf/360-english.pdf
BfR. (2020b, 10 26). Database BfR Recommendations on Food Contact Materials.
Retrieved from BfR Web site: https://bfr.ble.de/kse/faces/DBEmpfehlung_en.jsp
California Environmental Protection Agency. (2020). Product – Chemical Profile for Food
Packaging Containing Perfluoroalkyl or Polyfluoroalkyl Substances.
ttps://dtsc.ca.gov/wp-content/uploads/sites/31/2020/07/Draft-Profile_PFASs-in-
Food-Packaging_FINAL_ADA.pdf.
CEPI. (2020). KEY STATISTICS 2019 European pulp & paper industry. Confederation of
European Paper Industries.
ECHA. (2016). Guidance on information requirements and chemical safety assessment.
Chapter R.16: Environmental exposure assessment.
ECHA. (2020b). RoI Entry for PFHxA. Retrieved from ECHA Registry of Intentions
Restrictions: https://echa.europa.eu/registry-of-restriction-intentions/-
/dislist/details/0b0236e18323a25d
Fidra. (2020). Forever chemicals in the food aisle; PFAS content of UK supermarket and
takeaway food packaging. PFAS-Free Org. Retrieved from
https://www.pfasfree.org.uk/wp-content/uploads/Forever-Chemicals-in-the-Food-
Aisle-Fidra-2020-.pdf
Food Drink Europe. (2019). Data and Trends: EU Food and Drink Industry 2019.
hthttp://fooddrink.bg/assets/upload_files/125/oJXFEcgow1WFuYrHsIobmdwBRqtZ
VIrsOuDRzoZ6.pdf.
Geyer, R., Jambeck, J., & Law, K. (2017). Production, use, and fate of all plastics ever
made. Science Advances, 3, DOI: 10.1126/sciadv.1700782.
Glüge et al. (2020). An overview of the uses of per- and polyfluoroalkyl substances
(PFAS). Environmental Science: Process and impacts., 22, 2345-2373.
Grand View Research. (2019). Nonstick Cookware Market Worth $12.5 Billion By 2025 |
CAGR: 4.9%. Retrieved from Grand View Research:
https://www.grandviewresearch.com/press-release/global-nonstick-cookware-
market
Guerrero-Vaca et al. (2020). Experimental Study for the Stripping of PTFE. Coatings on
Al-Mg Substrates Using Dry Abrasive Materials. Materials, 13, 799.
26ING. (2019). Plastic packaging in the food sector Six ways to tackle the plastic puzzle.
https://think.ing.com/uploads/reports/ING_-_The_plastic_puzzle_-
_December_2019_%28003%29.pdf.
Nature. (2001). Out of the frying-pan, into the air. Nature, doi:10.1038/news010719-19.
OECD. (2020). PFAS and alternatives in food packaging (Paper and paperboard) Report
on the commercial availability and current uses.
https://www.oecd.org/chemicalsafety/portal-perfluorinated-chemicals/PFASs-
and-alternatives-in-food-packaging-paper-and-paperboard.pdf: OECD Series on
Risk Management No.58.
Oosterhuis, F. e. (2017). Towards a proportionality assessment of risk reduction
measures aimed at restricting the use of persistent and bioaccumulative
substances. Environmental Policy and Regulation.
RIVM. (2020a). Personal communication & Wageningen University and Research centre.
Schaider et al, L. A. (2017). Fluorinated Compounds in U.S. Fast Food Packaging.
Environmental Science and Technology Letters
27You can also read