Using non-uniformly sampled r accordion experiments
←
→
Page content transcription
If your browser does not render page correctly, please read the page content below
Rapid measurement of heteronuclear transverse relaxation rates
 using non-uniformly sampled r accordion experiments
 Sven Wernersson1, Göran Carlström2, Andreas Jakobsson3, Mikael Akke1,*
 1
 Biophysical Chemistry, Center for Molecular Protein Science, Department of Chemistry, Lund University, Box 124, SE-
5 22100 Lund, Sweden
 2
 Centre for Analysis and Synthesis, Department of Chemistry, Lund University, Box 124, SE-22100 Lund, Sweden
 3
 Department of Mathematical Statistics, Lund University, Box 118, SE-22100 Lund, Sweden
 Correspondence to: Mikael Akke (mikael.akke@bpc.lu.se)

 Abstract. Multidimensional, heteronuclear NMR relaxation methods are used extensively to characterize the dynamics of
10 biological macromolecules. Acquisition of relaxation datasets on proteins typically require significant measurement time, often
 several days. Accordion spectroscopy offers a powerful means to shorten relaxation rate measurements by encoding the
 ‘relaxation dimension’ into the indirect evolution period in multidimensional experiments. Time savings can also be achieved
 by nonuniform sampling (NUS) of multidimensional NMR data, which is used increasingly to improve spectral resolution or
 increase sensitivity per unit time. However, NUS is not commonly implemented in relaxation experiments, because most
15 reconstruction algorithms are inherently nonlinear, leading to problems when estimating signal intensities, relaxation rate
 constants and their error bounds. We have previously shown how to avoid these shortcomings by combining accordion
 spectroscopy with NUS, followed by data reconstruction using sparse exponential mode analysis, thereby achieving a dramatic
 decrease in the total length of longitudinal relaxation experiments. Here, we present the corresponding transverse relaxation
 experiment, taking into account the special considerations required for its successfully implementation in the framework of
20 the accordion-NUS approach. We attain the highest possible precision in the relaxation rate constants by optimizing the NUS
 scheme with respect to the Cramér-Rao lower bound of the variance of the estimated parameter, given the total number of
 sampling points and the spectrum-specific signal characteristics. The resulting accordion-NUS R1r relaxation experiment
 achieves comparable precision in the parameter estimates, compared to conventional CPMG R2 or spin-lock R1r experiments,
 while saving an order of magnitude in experiment time.

25 1 Introduction

 NMR relaxation offers a powerful means to study the dynamics of proteins and other biological macromolecules (Alderson
 and Kay, 2020; Mittermaier and Kay, 2009; Palmer, 2004). Most commonly, relaxation experiments on proteins are acquired
 as a series of two-dimensional (2D) spectra, in order to resolve as many resonances as possible, wherein relaxation rates are
 measured via their effect on the resonance intensities in a ‘third dimension’ obtained by parametrically varying the length of
30 a relaxation time period or the refocusing frequency of an applied radio-frequency field, or both. Thus, relaxation experiments
 often involve significant time requirements, and may take up to several days. An ingenious alternative to these lengthy
 experiments is offered by the accordion approach originally developed by Bodenhausen & Ernst (Bodenhausen and Ernst,
 1981, 1982) to study chemical exchange. In accordion spectroscopy, the ‘third dimension’ is incremented synchronously with
 the second (indirect) dimension, with the result that the relaxation decay is encoded into the interferogram of the indirect
35 evolution period. Consequently, the total experiment time is reduced significantly. More recent implementations include the
 constant-time accordion experiment (Carr et al., 1998; Mandel and Palmer, 1994), from which relaxation rate constants can
 be extracted using either time-domain analysis of the interferogram (Mandel and Palmer, 1994), or lineshape analysis of the
 Fourier-transformed data (Chen and Tjandra, 2009; Harden and Frueh, 2014; Rabier et al., 2001).

 1
Nonuniform sampling (NUS) of the indirect dimensions of multidimensional NMR data can greatly shorten the total
40 experiment time (Gołowicz et al., 2020; Mobli and Hoch, 2014), and has become commonplace in the last decade. However,
 most spectral reconstruction algorithms suffer from nonlinearity of signal intensities, which limits ‘plug-and-play’ use of NUS
 in quantitative experiments, and requires careful consideration of both sampling schemes and data modeling to produce
 consistent results and reliable error estimates (East et al., 2021; Linnet and Teilum, 2016; Mayzel et al., 2017; Stetz and Wand,
 2016; Urbańczyk et al., 2017). We recently introduced an approach that avoids these problems by combining accordion
45 spectroscopy with NUS (Carlström et al., 2019), and analyzing the resulting data using DSURE (damped super-resolution
 estimator), a sparse reconstruction technique enabling maximum-likelihood estimation of the time-domain signal parameters
 from NUS data (Juhlin et al., 2018; Swärd et al., 2016). We stress the point that accordion spectroscopy encodes the desired
 relaxation rate constants in the interferogram of the multidimensional data set, and hence the analysis does not rely on
 measuring intensities in multiple NUS datasets. Moreover, maximum likelihood estimation of model parameters makes it
50 straightforward to derive reliable error bounds. Our approach leads to accumulated time savings through both the accordion
 and NUS methods. Compared to a conventional relaxation experiment, accordion reduces the experiment time by a factor of
 M/2, where M is the number of datasets included in the conventional approach, and NUS reduces the experiment time by a
 factor of Nfull/N, where Nfull is the number of data points sampled in the indirect dimension of the conventional experiment and
 N is the number of points in the NUS scheme. We previously demonstrated this approach by measuring longitudinal relaxation
55 rate constants (R1) in proteins with time savings of up to a factor of 20 (Carlström et al., 2019). For example, using this
 approach we have successfully measured R1 on protein samples with 10-fold lower concentration than normally used
 (Verteramo et al., 2021).
 A number of considerations are of general importance when choosing the detailed sampling scheme for NUS,
 including the need to keep the total number of increments small in order to speed up data acquisition, to sample short t1 values
60 to optimize sensitivity and long t1 values to optimize spectral resolution (Hyberts et al., 2014; Mobli and Hoch, 2014). Various
 NUS schemes have been developed to accommodate these different requirements, including the popular Poisson-gap scheme
 (Hyberts et al., 2010). However, in the context of relaxation experiments, the most important aspect is to achieve high precision
 in the estimated relaxation rate constants. To this end, we have previously developed a method to optimize the sampling
 scheme with respect to the Cramér-Rao lower bound (CRLB), which yields a lower bound on the achievable variance of the
65 parameters, given the actual spectrum characteristics (i.e., the total number of component signals and their resonance
 frequencies, linewidths, and intensities) and the number of sampling points (Carlström et al., 2019; Månsson et al., 2014;
 Swärd et al., 2018); similar implementations have followed (Jameson et al., 2019; Waudby et al., 2021).
 Here, we introduce accordion-NUS R1r pulse sequences that complement the previously presented R1 experiment
 (Carlström et al., 2019). The R1r relaxation experiment can be implemented using either on-resonance or off-resonance spin-
70 lock fields, making it suitable for measurement of R2 relaxation rate constants to characterize fast dynamics, as well as
 conformational/chemical exchange processes across a wide range of timescales (Akke and Palmer, 1996). The present paper
 addresses several issues concerning measurement of transverse relaxation rates in accordion mode combined with NUS. We
 validate the accordion-NUS method by extensive comparisons with data acquired using uniformly sampled accordion
 experiments, as well as conventional non-accordion experiments of both the R1r and CPMG R2 types. In addition, exchange
75 contributions to the transverse relaxation rates were characterized using CPMG relaxation dispersion experiments. Our results
 show that the accordion-NUS R1r experiment enables measurement of accurate R2 relaxation rate constants with a relative
 uncertainty of only 2–3% using a sampling density of 50% in the indirect dimension. Lower sampling densities lead to
 progressively reduced precision, with 5% relative uncertainty being obtained using less than 20% sampling density.

 2
2 Materials and Methods

 80 2.1 Constant-time accordion relaxation methodology

 For completeness, here we briefly outline the salient features of the constant-time accordion method (Mandel and Palmer,
 1994). Figure 1 shows the accordion R1r pulse sequence. The total relaxation delay is Tk = n⋅4⋅t, where n is the sampled point
 number in t1, t = (k⋅Dt1)/4, Dt1 is the dwell time, and k is the accordion scaling factor. The total constant-time delay T = t1 +
 t2 + t3, where t1 = (T – t1)/2, t2 = T/2 – D, t3 = D + t1/2, D = 1/(4J), and J is the 1H-15N 1J-coupling constant (~92Hz). The
 85 constant-time evolution period leads to reduced signal-to-noise compared to the non-constant time alternative, but is still
 favorable due to its superior resolution of closely spaced signals (Mandel and Palmer, 1994), which is of critical importance
 in accordion experiments (see Results). In the forward accordion experiment, where Tk is incremented together with t1, the
 effective relaxation rate constant of the interferogram is given by: R2,fwd = Rinh + k⋅R1r, where Rinh describes line-broadening
 due to static magnetic field inhomogeneity. By comparison, in a non-constant time experiment, the linewidth would be given
 90 by R2 + Rinh + k⋅R1r, i.e., essentially a factor of two greater than in the constant time version (Mandel and Palmer, 1994). In
 the reverse accordion experiment, where Tk is decremented as t1 is incremented, the effective relaxation rate constant of the
 interferogram is given by: R2,rev = Rinh – k⋅R1r. The rotating-frame relaxation rate constant is calculated as: R1r = (R2,fwd –
 R2,rev)/(2k ). As an alternative, R1r can also be determined by subtracting from R2,fwd the linewidth measured in an interferogram
 from a reference experiment with the relaxation period set to 0: R1r = (R2,fwd – Rref)/k. In estimating the standard error of R1r
 95 by error propagation, the factor of 2 difference in the numerator of the alternative approaches offsets the higher signal-to-noise
 in the reference experiment, as compared to the reverse experiment, with the result that the error bars are actually lower in the
 forward-reverse accordion approach.

 2.2 NMR sample preparation

 Uniformly 15N-enriched galectin-3C was expressed and purified as described previously (Diehl et al., 2009, 2010; Wallerstein
100 et al., 2021). The NMR sample containing galectin-3C in complex with the ligand 3’-[4-(3-fluorophenyl)-1H-1,2,3-triazol-1-
 yl]-3’-deoxy-β-D-galactopyranosyl-1-thio-β-D-glucopyranoside was prepared as described (Wallerstein et al., 2021) to yield
 a final protein concentration of 0.9 mM in 5 mM HEPES buffer, pH 7.3.

 3
Constant Time
 Relaxation
 Period, T
 y Period Tκ y -x
 y ∆ ∆ ∆ ∆ ∆ ∆
 1H

 τ1 τ2 τ3
 A/B
 φ1 y y φ3 ±x y

 15N d1 ∆ ∆
 SL decouple

 ±

 g0 g2 g2 g3 g4 g4 g4 g4 g5 g2 g2 g2 g2 g6

 A B

 Adiab[ ] τ
 SL

 2τ τ
 Adiab

 n
 -x

 1 2 1 3
 Φ2 Φ2

 4
 [ ] τ
 SL

 2τ τ 4
 n
 y y

 5

105 Figure 1. Pulse sequence for the 1H-detected accordion-NUS 15N R1r spin-lock experiment. Thin (thick) black bars correspond to 90° (180°)
 non-selective pulses. All pulses have phase x, unless otherwise indicated. The spin-lock at the beginning of the sequence is a heat-
 compensation block (Wang and Bax, 1993). The open bell-shaped pulse at the beginning of the sequence is a selective pulse on the water
 resonance (Grzesiek and Bax, 1993). INEPT polarization transfer steps (Bodenhausen and Ruben, 1980; Morris and Freeman, 1979) use Δ
 = 1/(4JHN), where JHN is the one-bond scalar coupling constant. The relaxation period can be run with (A) adiabatic ramps, or with (B) hard-
110 pulse alignment blocks (Hansen and Kay, 2007). In both cases, 180° 1H pulses are present at time points t and 3t to suppress cross-correlated
 relaxation (Massi et al., 2004). The hard pulse alignment delays are d1 = 1/(2 wSL) – 2/wN, d2 = d/wSL – 2/wN, d3 = d/(2 wSL) – 2/wN, d4 =
 1/wN, d5 = 1/(2 wSL) – 2/wN where wN is the field strength of the high power 15N 90-degree pulse, wSL is the spin-lock field strength, and d =
 1.35 is a scaling factor optimized for alignment of spins with offsets within ±wSL. The total relaxation delay Tk = n⋅4⋅t, where n is the
 sampled point number in t1, and t = (k⋅Dt1)/4, with k = 3. The total constant-time period T = t1 + t2 + t3 = 70 ms, where t1 = (T – t1)/2, t2 =
115 T/2 – D, and t3 = D + t1/2. The phase cycle is f1= (x, –x), f2= 8(y), 8(–y), f3= (x, x, y, y, –x, –x, –y, –y). The receiver phase cycle is rec =
 (x, –x, –x, x, x, –x, –x, x) with relaxation block (A), and rec, (–rec) with block (B). Gradient enhanced PEP polarization transfer (Kay et al.,
 1992b; Palmer et al., 1991) is achieved by acquiring a second data set with inversion of the phase of the 15N 90° pulse indicated with ±x,
 and gradient g5. The gradients g5 and g6 are used for coherence selection. The phase φ1 and the receiver phase are inverted for each t1
 increment. The gradient times and levels are g0: 1 ms, 8.9 G cm-1; g1: 1ms, 8.9 G cm-1; g2: 0.5 ms, 7.1 G cm-1; g3: 1 ms, 44.4G cm-1; g4:
120 0.5 ms, 14.2G cm-1; g5: 1.25 ms, 53.2 G cm-1; g6: 0.125 ms, 53.8 G cm-1.

 2.3 NMR relaxation experiments

 All pulse sequences were based on the 1H-15N HSQC format (Bodenhausen and Ruben, 1980). Conventional and accordion
 15
 N R1r experiments were acquired with uniform sampling (US) on an Agilent/Varian VNMRS 600 MHz instrument equipped
 with a 5 mm HCN triple-resonance room temperature probe. To allow comparisons between the two different ways of
125 estimating R1r from accordion data, accordion experiments were performed using a combination of forward and reverse
 accordion modes (i.e., incrementing or decrementing the relaxation delay in step with t1) together with a reference experiment
 excluding the accordion relaxation period but including the alignment blocks (Fig. 1). Both the conventional and accordion
 R1r experiments were performed with two different methods for aligning the magnetization along the effective spin-lock field
 axis: either hard pulses and delays (Hansen and Kay, 2007) or adiabatic amplitude/frequency ramps with a tan/tanh profile of

 4
130 1.8 ms duration (Mulder et al., 1998). In the former case, the scaling factor d was set to 1.35 for optimum alignment of spins
 with offsets within ±wSL from the spin-lock carrier frequency. The 15N dimension was acquired with a spectral width of 2006
 Hz, sampled over 132 increments in the accordion R1r experiment utilizing adiabatic alignment, with 128 increments in the
 accordion experiment using hard-pulse alignment, and with 128 increments in both conventional R1r experiments. The 1H
 dimension was acquired with a spectral width of 8446 Hz, sampled over 2028 complex data points, in all experiments. All
135 accordion experiments (forward, reverse, and reference) were acquired interleaved. Conventional R1r experiments were
 acquired by interleaving the relaxation periods of (6, 12, 23.9, 2×47.9, 95.7, and 191.4) ms. All R1r experiments employed a
 spin-lock field strength of wSL/(2p) = 1380 Hz. The effective spin-lock field strength in the rotating frame is given by weff =
 (wSL2 + W2)1/2, where W is the offset from the spin-lock carrier (Akke and Palmer, 1996; Davis et al., 1994). The transverse
 relaxation constant R2 was extracted from the R1r relaxation rates by correcting for off-resonance effects using the relationship
140 R1r = cos2(q)R1 + sin2(q)R2, where q is the tilt angle of the spin-lock field defined by tan(q) = wSL/W, and the previously
 determined R1 rate constant.
 Conventional R1 and R2 CPMG experiments (Farrow et al., 1995; Skelton et al., 1993) were acquired with uniform
 sampling on a Bruker NEO 600 MHz instrument equipped with a 5 mm HPCN QCI cryo-probe, using spectral widths of 2129
 Hz, sampled over 128 increments, in the 15N dimension and 9615 Hz, sampled over 2048 complex data points, in the 1H
145 dimension. The R1 and R2 relaxation periods were acquired interleaved with the t1 increments using delays of (2×0.04, 0.08,
 0.12, 0.2, 0.4, 2×0.6, 0.72, 2×0.8, 1.0, 1.2, 1.6, and 2.0) s and (0, 42.2, 2×84.5, 126.7, and 169.0) ms, respectively. The R1
 experiment utilized 1H WALTZ decoupling during the relaxation period. The R2 experiment employed CPMG pulse trains
 with a fixed refocusing frequency, nCPMG = 1/(2tCPMG) = 625 Hz, where tCPMG is the delay between 180° pulses in the CPMG
 train, and a 180° pulse length of 80 µs. The R2 values were not corrected for off-resonance effects. We also recorded CPMG
150 relaxation dispersion datasets at static magnetic field strengths of 11.7 T and 14.1 T, using Agilent/Varian spectrometers
 equipped with 5 mm HCN triple-resonance room temperature probes. The relaxation dispersion experiment was run as a
 constant-time version (Mulder et al., 2001) of the relaxation-compensated CPMG pulse sequence (Loria et al., 1999), using
 18 refocusing frequencies acquired interleaved with 128 t1 increments covering spectral widths of 1550 Hz (2006 Hz) at 11.7
 T (14.1 T). The experiments at 11.7 T and 14.1 T employed refocusing frequencies nCPMG of (2×0, 2×50, 2×100, 2×150, 2×200,
155 250, 300, 400, 500, 600, 700, 750, and 950) Hz and (2×0, 2×50, 2×100, 2×150, 2×200, 2×250, 350, 450, 550, 700, 850, and
 1000) Hz, respectively.

 2.4 Nonuniform sampling schemes

 NUS schemes were generated by selecting data points from the uniformly sampled accordion R1r dataset. CRLB optimized
 NUS schemes were obtained as described previously (Carlström et al., 2019). In practice, scheme optimization can be
160 performed using modeled data constructed by taking known values of Ak, wk, and Rk obtained from DSURE estimation of an
 HSQC experiment, together with an estimate of the extra decay caused by relaxation during the accordion period (Carlström
 et al., 2019). Single-column CRLB optimized (col-opt) (Carlström et al., 2019; Swärd et al., 2018) and sine-weighted Poisson-
 gap (Hyberts et al., 2010) sampling schemes were implemented for the accordion R1r dataset with adiabatic ramps, using in-
 house MATLAB scripts. Poisson-gap sampling schemes were generated by randomly varying the argument of the sinusoidal
165 weighting function between 0 and p/2; see (Hyberts et al., 2010). The best sampling scheme was identified as the one having
 the lowest sum of the CRLB calculated over all columns containing peaks. In the case of the col-opt approach, the selection
 was made among 97 different single-column CRLB optimized schemes corresponding to each slice of the interferogram
 containing protein signals, whereas in the case of Poisson-gap sampling 1000 different schemes were compared. The sampling
 scheme was optimized individually for each of the reference, forward, and reverse accordion experiments. In each case, we
170 generated individual datasets sampled with N = 22, 27, 32, 37, 42, 47, 52, 57, 62, 66, 67, 72, 77, 82, 87, 92, 97, 102, 107, 112,

 5
117, 122, or 127 increments in the indirect dimension. The NUS datasets resulting from the different sampling schemes were
 subsequently reconstructed using the DSURE algorithm.

 2.5 Data reconstruction, processing, and analysis

 Non-accordion (i.e., conventional) datasets were processed using NMRPipe (Delaglio et al., 1995), with forward linear
175 prediction to double the number of data points, cosine-squared window apodization, and zero-filling to twice the size rounded
 to the nearest power of two. R1r, R1, and R2 relaxation rate constants were estimated from the conventional experiments by
 integrating the peak volumes using PINT (Ahlner et al., 2013; Niklasson et al., 2017), followed by fitting mono-exponential
 decay functions to the volumes using in-house MATLAB scripts. The fitted R2 values determined by CPMG experiments were
 not adjusted for off-resonance effects (Korzhnev et al., 2000). Standard errors were estimated using jackknife resampling
180 (Mosteller and Tukey, 1977) as implemented in PINT. Standard errors in R2 derived from R1r experiments were estimated by
 Monte-Carlo simulations using 10,000 samples drawn from normal distributions with widths corresponding to the standard
 errors of R1r and R1 (Press et al., 1986).
 The accordion datasets were processed and analyzed using the DSURE algorithm (Juhlin et al., 2018) implemented
 in MATLAB (The Mathworks, Inc.). DSURE reconstruction was performed on individual t1 interferograms, as described
185 previously (Carlström et al., 2019). DSURE models interferograms as sums of exponentially decaying sinusoids
 ( ) = ∑,+ + exp[ + − + ] + ( ) (1)
 where Ak, wk, and Rk are the complex-valued amplitude, frequency, and decay rate of the k:th signal, respectively, e(t) represents
 additive noise, and the sum runs over all K signals identified in a given interferogram. In reconstructing accordion data, the
 time domain data from the reverse mode was inverted and complex conjugated before estimation using DSURE. Standard
190 errors of the estimated parameters were calculated as the CRLB, which is very close to the RMSE for statistically efficient
 estimators like DSURE. Explicit comparison of the RMSE, calculated from Monte-Carlo simulations using 1000 samples, and
 the CRLB indicates that the two measures are in excellent agreement, and deviate by at most a factor of 1.6 for the worst case
 (an interferogram containing 3 signal maxima) among our 50% NUS data.

 2.6 Statistical analysis

195 To compare the performance of the different approaches for measuring transverse relaxation rates, we used 4 different metrics.
 The relative difference and absolute deviation between datasets x and y are defined for a given residue i as Drel = 2(xi – yi)/(xi
 + yi) and Dabs = |xi – yi|, respectively. The RMSD between two datasets is calculated pairwise over all residues (Nres), RMSD =
 [(åi(xi – yi)2/Nres)]1/2. The mean relative uncertainty of a given dataset is the mean, calculated over all residues, of the individual
 uncertainty in xi (sxi; one standard deviation, as estimated by the DSURE algorithm) divided by xi, MRU = (åi sxi/xi)/Nres).

200 3 Results and Discussion

 3.1 Pulse sequence design

 The accordion-NUS R1r pulse sequence (Fig. 1) is based on our previous implementation to measure R1 (Carlström et al.,
 2019), which included minor modifications of the original constant-time accordion experiment (Mandel and Palmer, 1994). In
 designing accordion-NUS versions of transverse relaxation experiments, it is necessary to consider the interplay between the
205 minimum length of the relaxation block (A or B in Fig. 1), the number of sampled t1 points, and the maximum attainable t1
 value. R2 relaxation rate measurement is typically performed in one of two ways, using either CPMG pulse trains or a
 continuous spin-lock during the relaxation period, so as to maintain in-phase magnetization and avoid significant evolution
 into anti-phase terms (Skelton et al., 1993), as well as reduce chemical/conformational exchange (Rex) and magnetic-field

 6
inhomogeneity (Rinh) contributions to the effective transverse relaxation rate constant (R2,eff). Furthermore, it is necessary to
210 suppress the effects of cross-correlated relaxation, which amounts to introducing additional relaxation delays (Kay et al.,
 1992a; Palmer et al., 1992), and to mitigate the effects of off-resonance effects and pulse imperfections (Korzhnev et al., 2000),
 leading to extended phase cycles (Yip and Zuiderweg, 2004). CPMG-type experiments for measuring chemical exchange
 involve extended spin-echo elements to average the relaxation rates of in-phase and anti-phase coherences (Loria et al., 1999).
 All in all, these requirements typically lead to relatively long relaxation blocks in CPMG-based experiments. Since the
215 accordion experiment increments (or decrements) the relaxation period synchronously with the t1 period, the minimum
 incrementation step for the relaxation period limits the maximum number of points that can be acquired in the t1 dimension.
 In our initial testing of CPMG-based accordion experiments to measure R2, we found that the maximum achievable length of
 the t1 dimension was 64 points, before the duty cycle and relaxation losses became serious concerns. While the resulting
 resolution in t1 might suffice in certain cases, we opted instead for increased flexibility and designed the transverse relaxation
220 experiment based on a spin-lock period. This strategy allows for significantly shorter increments of the relaxation period, and
 further enables facile adaptation to off-resonance R1r experiments for conformational exchange measurement. We
 implemented two types of pulse sequence elements to align the magnetization along the effective spin-lock field: adiabatic
 amplitude/frequency ramps (Mulder et al., 1998), or an element comprising hard pulses and delays (Hansen and Kay, 2007).
 The hard-pulse element is shorter than the adiabatic ramp (0.25–0.45 ms versus 1.8 ms in the present case), and in principle
225 reduces relaxation losses, while the adiabatic ramp achieves superior alignment over a wider range of offsets, making it suitable
 for off-resonance R1r experiments used to characterize chemical exchange processes.

 3.2 Comparison of DSURE-modeled accordion R1r relaxation data and conventional relaxation data

 The 1H-15N 2D spectrum resulting from the accordion R1r relaxation data reconstructed using DSURE is shown in Fig. A1,
 together with representative examples of DSURE models of interferograms. We compared the performance of the accordion
230 R1r experiments acquired with the two different alignment elements (adiabatic vs hard-pulse, see section 2.3), and also
 compared the results obtained using the two different combinations of accordion modes (forward–reverse vs forward–
 reference, see section 2.1). To validate the accordion R1r values determined using DSURE, we first compared these with rate
 constants determined from the conventional R1r experiment and the R2 CPMG experiment (Fig. 2). Figure 2 shows the results
 obtained using the forward–reverse accordion data and adiabatic alignment, while the corresponding data obtained using hard-
235 pulse alignment is highly similar and shown in Fig. A2. In general, the results are in very good agreement, with very few
 residues showing statistically significant deviations between experiments (Figs. 2a–d). Comparing the accordion R1r values
 with the conventional data, we obtain an RMSD of 0.45 s-1, whereas the comparison with the CPMG data yields an RMSD of
 0.59 s-1. The CPMG data were not corrected for off-resonance effects (Korzhnev et al., 2000), leading to offset-dependent
 systematic errors of up to 5% that might explain the somewhat poorer agreement in this case. The distributions of relative
240 differences are centered around the mean values 0.02 s-1 and 0.00 s-1, and are sharper than normal distributions (Figs. 2e, f).
 The means of relative differences should be compared with the average relative uncertainties of the estimated R1r values,
 which are 0.14 s-1 for the conventional data and 0.21 s-1 for the accordion data, indicating that the accordion R1r experiment
 yields accurate data of comparable precision compared to the conventional experiment. The slight tendency towards higher R2
 values determined from the accordion experiment reflects small, but noticeable differences for a subset of residues (viz.
245 residues 151, 154, 181, 182, and 184). Visual inspection of these peaks indicates that these differences are likely due to overlap
 problems, which are exacerbated by the additional line broadening present in accordion spectra. In principle this problem could
 be mitigated by optimizing the accordion scaling factor k, or by acquiring data as a 3D experiment (Carr et al., 1998; Chen
 and Tjandra, 2009). For some residues, notably L219, the R2 value from the reference CPMG data set is considerably higher
 (Fig. 2b), reflecting the different levels of residual exchange contributions to the transverse relaxation rate resulting from the

 7
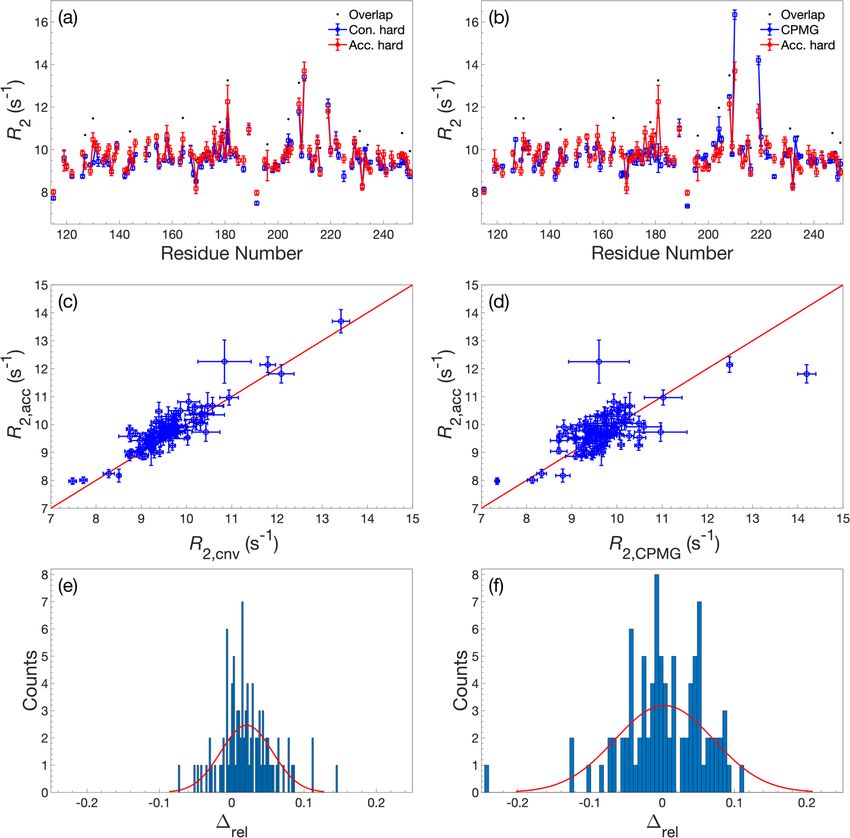
250 different refocusing frequencies. The L219 peak has an offset of –572 Hz from the 15N spin-lock carrier, which results in an
 effective spin-lock field of weff/(2p) = 1494 Hz, more than a factor two greater than the effective CPMG refocusing field (625
 Hz) in the reference R2 dataset. L219 also shows clear signatures of fast conformational exchange in CPMG relaxation
 dispersion experiments (Fig. A3).
 The two alignment variants yield highly similar results in the context of the accordion experiment, and the same is
255 true for the two combinations of accordion modes (Fig. A4). The RMSD between the two alignment variants is 0.19 s-1 and
 the mean relative difference is 0.0 s-1, and the corresponding numbers for the two combinations of accordion modes are 0.24
 s-1 and 0.0 s-1, respectively. In the following presentation of accordion-NUS experiments, we will base all analyses on the
 results obtained from the forward–reverse accordion approach using data acquired with adiabatic alignment.

260 Figure 2. Comparison of R2 determined by accordion R1r or conventional relaxation experiments. R2 values determined by accordion R1r
 (red) spin-lock experiments compared with (a, c, e) R2 determined by conventional R1r (blue) and (b, d, f) R2 determined by conventional R2
 CPMG (blue). Both R1r experiments were acquired with adiabatic ramps. (a, b) R2 plotted versus residue number. Black dots indicate residues
 showing significant overlap in the 1H-15N HSQC spectrum. (c, d) Covariance plot of R2 datasets. (e, f) Histogram of the relative differences
 between datasets. The red curve describes the normal distribution that best fits the data. In panels (a–d), error bars indicate ± 1 SD.

 8
265 3.3 Comparison of non-uniformly sampled and uniformly sampled accordion R1r relaxation data

 Next, we tested the performance of the accordion R1r experiment acquired with NUS. We have previously evaluated the
 performance of various NUS schemes for the acquisition of accordion R1 data, and found that superior results were obtained
 for schemes generated by column-wise optimization directly against the CRLB (denoted col-opt in the following) or schemes
 following the Poisson-gap distribution (Carlström et al., 2019). Therefore, we restrict our present comparisons to the
270 performance of these two NUS schemes. Starting from the uniformly sampled accordion R1r dataset acquired with adiabatic
 ramps and the forward–reverse accordion mode (from here on denoted the US dataset), we generated two times two datasets,
 where we used either col-opt or Poisson-gap sampling schemes, both optimized for the forward accordion experiment alone
 (set F), or optimized individually for each of the forward and reverse experiments (set F+R). In a real case scenario, it is
 arguably more practical to perform the optimization on model data sets constructed by taking known values of Ak, wk, and Rk
275 obtained from DSURE estimation of an HSQC experiment, together with an estimate of the extra decay imparted by the
 accordion period (Carlström et al., 2019). Thus, there is no need to first record a US accordion data set prior to optimizing the
 NUS scheme.
 Figure 3 illustrates the performance of the accordion-NUS R1r experiment acquired with different NUS schemes (red
 and blue symbols) and optimization protocols (left- and right-hand columns). We compared the R1r values determined by
280 accordion-NUS with those obtained from the accordion-US dataset. In general, the performance decreases with decreasing
 number of sampled points, as might be expected. The RMSD between the NUS and US datasets shows a clear trend towards
 higher values as the number of sampling points decrease, from less than 0.2 s–1 at Nfull to 0.8–1.0 s–1 at N = 22 or 18% sampling
 density (Figs. 3a, b). However, these plots show some degree of scatter, which reflects the random nature of the NUS schemes,
 where any given scheme with a lower number of points might yield lower RMSD than another scheme with higher number of
285 points. By contrast, the mean relative uncertainty (MRU) in the estimated R1r parameter shows an essentially monotonous
 increase with decreasing number of points, from 2.2% at Nfull to 5% at N = 22 (Figs. 3c, d). The increasing uncertainty is
 relatively modest down to about 50% sampling (N = 66), where MRU is c:a 2.8%, but beyond this point both the RMSD and
 the MRU start to increase more steeply. These results are rather similar for the Poisson-gap and col-opt optimized schemes,
 with a small advantage for col-opt schemes, especially in the case of the precision of the estimated parameters (Figs. 3c, d).
290 However, greater improvements in precision are expected for relaxation rate constants of signals in interferograms whose
 sampling schemes have been individually optimized with respect to the CRLB, as shown previously (Carlström et al., 2019).
 Altogether, these results indicate that our present implementation of the accordion-NUS approach to measure R1r achieves
 equally good precision of the estimated relaxation rate constants as did our previously presented accordion-NUS R1 experiment
 (Carlström et al., 2019). Furthermore, the sampling schemes optimized separately for each of the forward and reverse
295 experiments (F+R) show a modest advantage in performance over F for low N, which might be expected (compare Fig. 3a
 with 3b, and Fig. 3c with 3d).

 9
Figure 3. Performance comparison of accordion-NUS R1r experiments. (a, b) RMSD between the NUS dataset and the corresponding US
300 dataset. (c, d) Mean relative uncertainty of the NUS R1r estimates. The left-hand panels (a, c) show result obtained with NUS schemes
 optimized only for the forward accordion experiment, while the right-hand panels (b, d) show the corresponding results obtained with
 schemes optimized individually for the forward and reverse accordion experiments. All data were acquired using adiabatic alignment.

 3.4 Spectral characteristics affecting accuracy and precision of accordion-NUS R1r relaxation rate constants

 Next, we investigated how various spectral characteristics affect the accuracy and precision of the estimated relaxation rate
305 constant. We calculated the absolute deviation (Dabs) between the US estimate and the 50% NUS estimate (N = 66), as well as
 the relative uncertainty, for each residue and plotted the results against signal intensity, resonance frequency offset from the
 spin-lock carrier, and the number of estimated signals present in the interferogram of the col-opt and F+R optimized data (Fig.
 4). There is no obvious relationship between Dabs and signal intensity, although larger values of Dabs (> 0.4 s–1) are not observed
 for the most intense signals (Fig. 4a). However, there is a trend towards lower relative uncertainty with higher signal intensity
310 (Fig. 4d), where a value of 1.5% is observed for the strongest signals and 6–8% at the other extreme. The results further reveal
 that the number of signals in the interferogram has an effect on both Dabs and the relative uncertainty, with a trend toward
 slightly larger errors as the number of signals increases (Figs. 4c, f); the relative uncertainty varies from 1.5% for single signals
 to 6–8% for the worst cases among interferograms containing 7 signals. Reassuringly, the mean relative uncertainty increases
 only slightly from 2% for single peaks to 3.2% for 7 peaks. Thus, there is no dramatic decrease in performance even at the
315 highest number of signals. This effect of the number of signals also explains the apparent higher Dabs and higher relative

 10
uncertainty for residues with offsets around 0 and 500 Hz, because this region of the spectrum is the most crowded (Figs. 4b,
 e). Furthermore, this result mirrors the observations of deviations between the accordion and conventional data discussed
 above in connection with Fig. 2.

 4 Conclusions

320 We have described a non-uniformly sampled accordion R1r experiment that complements the previously presented accordion-
 NUS R1 experiment (Carlström et al., 2019). The present accordion-NUS R1r experiment allows accurate and precise
 measurement of the transverse relaxation rate constant R2, while reducing sampling of the indirect dimension by at least 50%.
 The combination of accordion relaxation rate measurements with NUS achieves time saving of an order of magnitude
 compared to conventional experiments, in keeping with previous results presented for the corresponding accordion-NUS R1
325 experiment (Carlström et al., 2019). In addition to on-resonance R2 measurements, demonstrated herein, we anticipate that this
 experiment will be useful for on- and off-resonance R1r experiments to characterize chemical exchange processes. The
 accordion-NUS approach has broad applications in heteronuclear relaxation studies; with suitable modifications, the pulse
 sequence reported here for backbone 15N spins should be applicable to many other sites, e.g., 13C spins.

 11
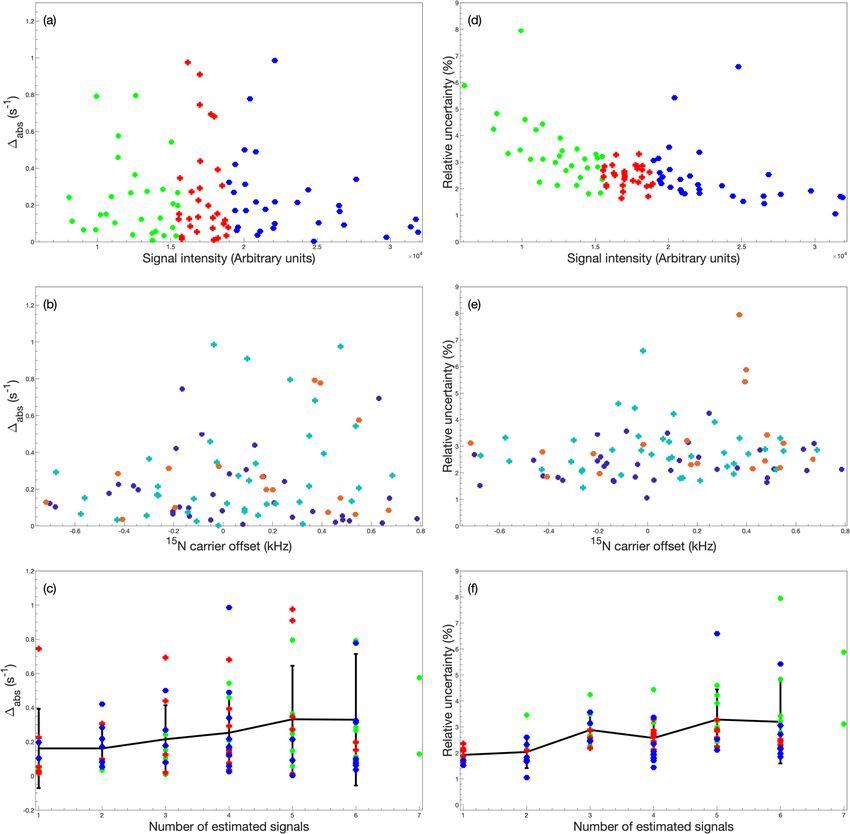
330

 Figure 4. Dependence of accordion-NUS R1r accuracy and precision on spectrum characteristics. (a–c) Absolute deviation (Dabs) between
 R1r values obtained from US and 50% NUS data, and (d–f) relative uncertainty (si/R1r,i) of R1r values obtained from 50% NUS data, plotted
 as a function of (a, d) signal intensity, (b, e) 15N spin-lock carrier offset, and (c, f) number of estimated signals in the interferogram. In panels
335 a, c, d, and f, the data are divided into tertiles according to signal intensity and color coded as: green, first tertile (lowest intensity); red,
 second tertile; blue, third tertile. In panels b and e, the data are divided into subsets according to the number of estimated signals in the
 interferogram and color coded as: purple, 1, 2, or 3 signals; cyan, 4 or 5 signals; orange, 6 or 7 signals. The black symbols with error bars in
 panels (e) and (f) represent the average and standard deviation of all data with a given number of peaks in the interferogram. All data were
 acquired using adiabatic alignment and determined using col-opt and F+R optimized NUS schemes.

340 Code and data availability

 Backbone chemical shift assignments have been deposited at Biological Magnetic Resonance Bank with the accession code:
 50283. The NMR pulse sequences, relaxation data sets, and extracted relaxation rate constants are available at Mendeley Data
 together with MATLAB scripts implementing the DSURE algorithm (https://doi.org/10.17632/zyryxrgkc3.1).

 12
Author contributions

345 SW, GC and MA conceived the overall experimental approach and designed pulse sequences; AJ contributed the DSURE
 algorithm and designed the analysis protocol together with GC; SW and GC performed experiments; SW, GC and MA
 analyzed data; all authors contributed to writing the manuscript.

 Competing interests

 The authors declare that they have no conflict of interest.

350 Acknowledgments

 This research was supported by the Swedish Research Council 2018-4995 and the Swedish SRA eSSENCE 2020 6:2.

 References

 Ahlner, A., Carlsson, M., Jonsson, B. H. and Lundström, P.: PINT: A software for integration of peak volumes and extraction
 of relaxation rates, J. Biomol. NMR, 56, 191–202, doi:10.1007/s10858-013-9737-7, 2013.
355 Akke, M. and Palmer, A. G.: Monitoring Macromolecular Motions on Microsecond–Millisecond Time Scales by R1r–R1
 Constant-Relaxation-Time NMR Spectroscopy, J. Am. Chem. Soc., 118, 911–912, 1996.
 Alderson, T. R. and Kay, L. E.: Unveiling invisible protein states with NMR spectroscopy, Curr. Opin. Struct. Biol., 60, 39–
 49, doi:10.1016/j.sbi.2019.10.008, 2020.
 Bodenhausen, G. and Ernst, R. R.: The accordion experiment, a simple approach to three-dimensional NMR spectroscopy, J.
360 Magn. Reson., 45(2), 367–373, doi:10.1016/0022-2364(81)90137-2, 1981.
 Bodenhausen, G. and Ernst, R. R.: Direct determination of rate constants of slow dynamic processes by two-dimensional
 “accordion” spectroscopy in nuclear magnetic resonance, J. Am. Chem. Soc., 104, 1304–1309, 1982.
 Bodenhausen, G. and Ruben, D. J.: Natural abundance nitrogen-15 NMR by enhanced heteronuclear spectroscopy, Chem.
 Phys. Lett., 69, 185–189, 1980.
365 Carlström, G., Elvander, F., Swärd, J., Jakobsson, A. and Akke, M.: Rapid NMR relaxation measurements using optimal
 nonuniform sampling of multidimensional accordion data analyzed by a sparse reconstruction method, J. Phys. Chem. A, 123,
 5718–5723, doi:10.1021/acs.jpca.9b04152, 2019.
 Carr, P. A., Fearing, D. A. and Palmer, A. G.: 3D Accordion Spectroscopy for Measuring 15N and 13CO Relaxation Rates in
 Poorly Resolved NMR Spectra, J. Magn. Reson., doi:10.1006/jmre.1998.1374, 1998.
370 Chen, K. and Tjandra, N.: Direct measurements of protein backbone 15N spin relaxation rates from peak line-width using a
 fully-relaxed Accordion 3D HNCO experiment, J. Magn. Reson., 197, 71–76, doi:10.1016/j.jmr.2008.12.001, 2009.
 Davis, D. G., Perlman, M. E. and London, R. E.: Direct measurements of the dissociation-rate constant for inhibitor-enzyme
 complexes via the T1r and T2 (CPMG) methods, J. Magn. Reson. Ser. B, 104, 266–275, 1994.
 Delaglio, F., Grzesiek, S., Vuister, G. W., Zhu, G., Pfeifer, J. and Bax, A.: NMRPipe: A multidimensional spectral processing
375 system based on UNIX pipes, J. Biomol. NMR, 6, 277–293, 1995.
 Diehl, C., Genheden, S., Modig, K., Ryde, U. and Akke, M.: Conformational entropy changes upon lactose binding to the
 carbohydrate recognition domain of galectin-3, J. Biomol. NMR, 45, 157–169, doi:10.1007/s10858-009-9356-5, 2009.
 Diehl, C., Engström, O., Delaine, T., Håkansson, M., Genheden, S., Modig, K., Leffler, H., Ryde, U., Nilsson, U. J. and Akke,
 M.: Protein flexibility and conformational entropy in ligand design targeting the carbohydrate recognition domain of galectin-
380 3, J. Am. Chem. Soc., 132, 14577–14589, 2010.
 East, K. W., Delaglio, F. and Lisi, G. P.: A simple approach for reconstruction of non-uniformly sampled pseudo-3D NMR
 13
data for accurate measurement of spin relaxation parameters, J Biomol NMR, doi:10.1007/s10858-021-00369-7, 2021.
 Farrow, N. A., Zhang, O., Forman-Kay, J. D. and Kay, L. E.: Comparison of the backbone dynamics of a folded and an
 unfolded SH3 domain existing in equilibrium in aqueous buffer, Biochemistry, 34, 868–878, 1995.
385 Gołowicz, D., Kasprzak, P., Orekhov, V. and Kazimierczuk, K.: Fast time-resolved NMR with non-uniform sampling, Prog.
 Nucl. Magn. Reson. Spectrosc., doi:10.1016/j.pnmrs.2019.09.003, 2020.
 Grzesiek, S. and Bax, A.: The importance of not saturating H2O in protein NMR. Application to sensitivity enhancement and
 NOE measurements, J. Am. Chem. Soc., 115, 12593–12594, 1993.
 Hansen, D. F. and Kay, L. E.: Improved magnetization alignment schemes for spin-lock relaxation experiments, J. Biomol.
390 NMR, 37(4), 245–255, doi:10.1007/s10858-006-9126-6, 2007.
 Harden, B. J. and Frueh, D. P.: SARA: A software environment for the analysis of relaxation data acquired with accordion
 spectroscopy, J. Biomol. NMR, 58(2), 83–99, doi:10.1007/s10858-013-9807-x, 2014.
 Hyberts, S. G., Takeuchi, K. and Wagner, G.: Poisson-gap sampling and forward maximum entropy reconstruction for
 enhancing the resolution and sensitivity of protein NMR data, J. Am. Chem. Soc., 132(7), 2145–2147, doi:10.1021/ja908004w,
395 2010.
 Hyberts, S. G., Arthanari, H., Robson, S. A. and Wagner, G.: Perspectives in magnetic resonance: NMR in the post-FFT era,
 J. Magn. Reson., 241(1), 60–73, doi:10.1016/j.jmr.2013.11.014, 2014.
 Jameson, G., Hansen, A. L., Li, D., Bruschweiler-Li, L. and Brüschweiler, R.: Extreme Nonuniform Sampling for Protein
 NMR Dynamics Studies in Minimal Time, J. Am. Chem. Soc., 141(42), 16829–16838, doi:10.1021/jacs.9b08032, 2019.
400 Juhlin, M., Elvander, F., Sward, J. and Jakobsson, A.: Fast Gridless Estimation of Damped Modes, in ISPACS 2018 - 2018
 International Symposium on Intelligent Signal Processing and Communication Systems, pp. 346–351., 2018.
 Kay, L. E., Nicholson, L. K., Delagio, F., Bax, A. and Torchia, D. A.: Pulse sequences for removal of the effects of cross
 correlation between dipolar and chemical-shift anisotropy relaxation mechanisms on the measurement of heteronuclear T1 and
 T2 values in proteins, J. Magn. Reson., 97, 359–375, 1992a.
405 Kay, L. E., Keifer, P. and Saarinen, T.: Pure absorption gradient enhanced heteronuclear single quantum correlation
 spectroscopy with improved sensitivity, J. Am. Chem. Soc., 114, 10663–10665, 1992b.
 Korzhnev, D. M., Tischenko, E. V and Arseniev, A. S.: Off-resonance effects in 15N T2 CPMG measurements, J. Biomol.
 NMR, 17, 231–237, 2000.
 Linnet, T. E. and Teilum, K.: Non-uniform sampling of NMR relaxation data, J. Biomol. NMR, 64(2), 165–173,
410 doi:10.1007/s10858-016-0020-6, 2016.
 Loria, J. P., Rance, M. and Palmer, A. G.: A relaxation-compensated Carr-Purcell-Meiboom-Gill sequence for characterizing
 chemical exchange by NMR spectroscopy, J. Am. Chem. Soc., 121, 2331–2332, 1999.
 Mandel, A. M. and Palmer, A. G.: Measurement of relaxation rate constants using constant-time accordion heteronuclear NMR
 spectroscopy, J. Magn. Reson. Ser. A, 110, 62–72, 1994.
415 Månsson, A., Jakobsson, A. and Akke, M.: Multidimensional Cramér-Rao lower bound for non-uniformly sampled NMR
 signals, in European Signal Processing Conference, pp. 974–978., 2014.
 Massi, F., Johnson, E., Wang, C., Rance, M. and Palmer, A. G.: NMR R1ρ Rotating-Frame Relaxation with Weak Radio
 Frequency Fields, J. Am. Chem. Soc., 126(7), 2247–2256, doi:10.1021/ja038721w, 2004.
 Mayzel, M., Ahlner, A., Lundström, P. and Orekhov, V. Y.: Measurement of protein backbone 13 CO and 15 N relaxation
420 dispersion at high resolution, J. Biomol. NMR, 69(1), 1–12, doi:10.1007/s10858-017-0127-4, 2017.
 Mittermaier, A. K. and Kay, L. E.: Observing biological dynamics at atomic resolution using NMR, Trends Biochem. Sci.,
 doi:10.1016/j.tibs.2009.07.004, 2009.
 Mobli, M. and Hoch, J. C.: Nonuniform sampling and non-Fourier signal processing methods in multidimensional NMR, Prog.
 Nucl. Magn. Reson. Spectrosc., 83, 21–41, doi:10.1016/j.pnmrs.2014.09.002, 2014.

 14
425 Morris, G. A. and Freeman, R.: Enhancement of nuclear magnetic signals by polarization transfer, J. Am. Chem. Soc., 101,
 760–762, 1979.
 Mosteller, F. and Tukey, J. W.: Data Analysis and Regression. A Second Course in Statistics, Addison-Wesley, Reading,
 MA., 1977.
 Mulder, F. A. A., de Graaf, R. A., Kaptein, R. and Boelens, R.: An off-resonance rotating frame relaxation experiment for the
430 investigation of macromolecular dynamics using adiabatic rotations, J. Magn. Reson., 131(2), 351–357, 1998.
 Mulder, F. A. A., Skrynnikov, N. R., Hon, B., Dahlquist, F. W. and Kay, L. E.: Measurement of slow (microseconds-
 milliseconds) time scale dynamics in protein side chains by 15N relaxation dispersion NMR spectroscopy: Application to Asn
 and Gln residues in a cavity mutant of T4 lysozyme, J. Am. Chem. Soc., 123, 967–975, 2001.
 Niklasson, M., Otten, R., Ahlner, A., Andresen, C., Schlagnitweit, J., Petzold, K. and Lundström, P.: Comprehensive analysis
435 of NMR data using advanced line shape fitting, J. Biomol. NMR, 69, 93–99, doi:10.1007/s10858-017-0141-6, 2017.
 Palmer, A. G.: NMR characterization of the dynamics of biomacromolecules, Chem. Rev., 104(8), 3623–3640,
 doi:10.1021/cr030413t, 2004.
 Palmer, A. G., Cavanagh, J., Wright, P. E. and Rance, M.: Sensitivity improvement in proton-detected two-dimensional
 heteronuclear correlation NMR spectroscopy, J. Magn. Reson., 93, 151–170, 1991.
440 Palmer, A. G., Skelton, N. J., Chazin, W. J., Wright, P. E. and Rance, M.: Suppression of the effects of cross-correlation
 between dipolar and anisotropic chemical shift relaxation mechanisms in the measurement of spin-spin relaxation rates, Mol.
 Phys., 75, 699–711, 1992.
 Press, W. H., Flannery, B. P., Teukolsky, S. A. and Vetterling, W. T.: Numerical Recipes. The Art of Scientific Computing,
 Cambridge University Press, Cambridge., 1986.
445 Rabier, P., Kieffer, B., Koehl, P. and Lefevre, J.-F.: Fast measurement of heteronuclear relaxation: frequency-domain analysis
 of NMR accordion spectroscopy, Magn. Reson. Chem., 39, 447–456, 2001.
 Skelton, N. J., Palmer, A. G., Akke, M., Kördel, J., Rance, M. and Chazin, W. J.: Practical aspects of two-dimensional proton-
 detected 15N spin relaxation measurements, J. Magn. Reson. Ser. B, 102, 253–264, 1993.
 Stetz, M. A. and Wand, A. J.: Accurate determination of rates from non-uniformly sampled relaxation data, J. Biomol. NMR,
450 65(3–4), 157–170, doi:10.1007/s10858-016-0046-9, 2016.
 Swärd, J., Adalbjörnsson, S. I. and Jakobsson, A.: High resolution sparse estimation of exponentially decaying N-dimensional
 signals, Signal Processing, 128, 309–317, doi:10.1016/j.sigpro.2016.04.002, 2016.
 Swärd, J., Elvander, F. and Jakobsson, A.: Designing sampling schemes for multi-dimensional data, Signal Processing, 150,
 1–10, 2018.
455 Urbańczyk, M., Nowakowski, M., Koźmiński, W. and Kazimierczuk, K.: Joint non-uniform sampling of all incremented time
 delays for quicker acquisition in protein relaxation studies, J. Biomol. NMR, 68, 155–161, doi:10.1007/s10858-017-0115-8,
 2017.
 Verteramo, M. L., Ignjatović, M. M., Kumar, R., Wernersson, S., Wallerstein, J., Carlström, G., Chadimova, V., Ekberg, V.,
 Leffler, H., Zetterberg, F., Logan, D. T., Ryde, U., Akke, M. and Nilsson, U. J. In preparation, 2021.
460 Wallerstein, J., Ekberg, V., Misini Ignjatović, M., Kumar, R., Caldararu, O., Peterson, K., Leffler, H., Logan, D. T., Nilsson,
 U. J., Ryde, U. and Akke, M.: Entropy–Entropy Compensation Between the Conformational and Solvent Degrees of Freedom
 Fine-tunes Affinity in Ligand Binding to Galectin-3C, JACS Au, 1, 484–500, doi:10.1021/jacsau.0c00094, 2021.
 Wang, A. C. and Bax, A.: Minimizing the effects of radio-frequency heating in multidimensional NMR experiments, J. Biomol.
 NMR, 3, 715–720, 1993.
465 Waudby, C. A., Burridge, C. and Christodoulou, J.: Optimal design of adaptively sampled NMR experiments for measurement
 of methyl group dynamics with application to a ribosome-nascent chain complex, J Magn Reson, 326, 106937, 2021.
 Yip, G. N. B. and Zuiderweg, E. R. P.: A phase cycle scheme that significantly suppresses offset-dependent artifacts in the R-

 15
2-CPMG N-15 relaxation experiment, J. Magn. Reson., 171, 25–36, 2004.

470

 16
Appendix A

 Figure A1. Representative accordion R1r datasets. (a, b) Full 2D 1H-15N HSQC spectra from the (a) US reference experiment
 and (b) 50% NUS forward accordion experiment following DSURE reconstruction. The red lines identify columns 1405
475 containing a single peak and 1644 containing 8 peaks. (c, d) DSURE models of the interferograms of columns (c) 1405 and
 (d) 1644 extracted from the 50% NUS accordion experiment. The black dots indicate the sampled data points, while the blue
 curve shows the interferogram reconstructed by DSURE. (e, f) Interferograms of columns (e) 1405 and (f) 1644 extracted from
 the US reference experiment. Due to the constant time evolution period in t1, the interferograms in the reference experiment
 (e, f) show essentially no decay, whereas the interferograms in the accordion experiment (c, d) show significant decays due to
480 the encoded R1r relaxation rate(s).

 17
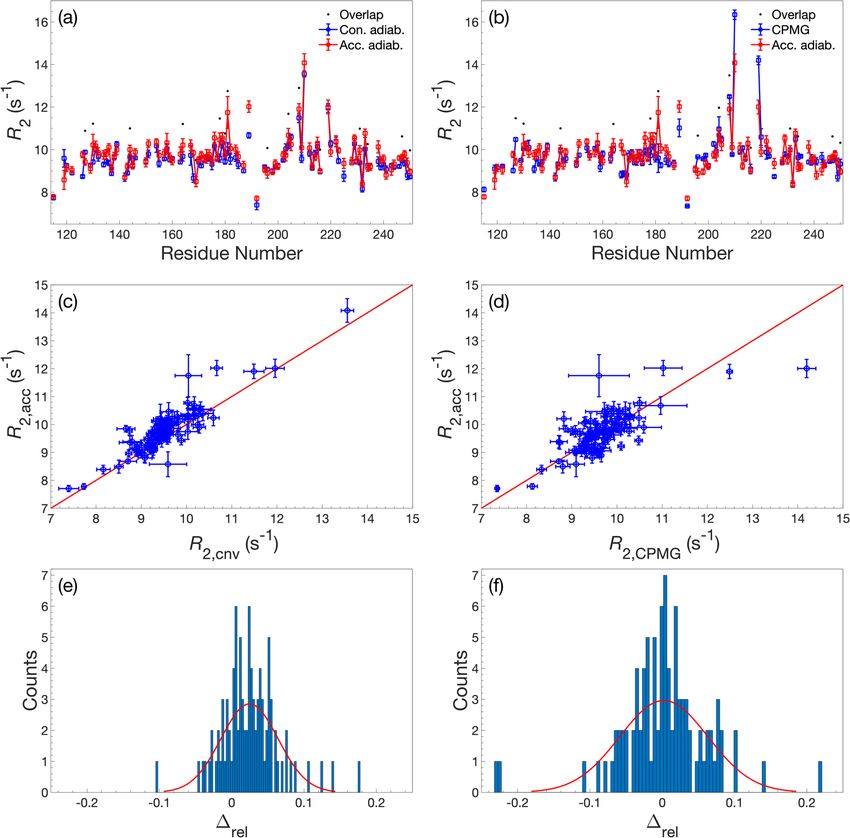
Figure A2. Comparison of R2 determined by accordion R1r or conventional relaxation experiments. R2 values determined by accordion R1r
485 (red) spin-lock experiments compared with (a, c, e) R2 determined by conventional R1r (blue) and (b, d, f) R2 determined by conventional R2
 CPMG (blue). Both R1r experiments were acquired with hard-pulse alignment. (a, b) R2 plotted versus residue number. Black dots indicate
 residues showing significant overlap in the 1H-15N HSQC spectrum. (c, d) Covariance plot of R2 datasets. (e, f) Histogram of the relative
 differences between datasets. The red curve describes the normal distribution that best fits the data. In panels (a–d), error bars indicate ± 1
 SD.

490

 18
20

 19
 R2 (s-1 )

 18

 17

 16

 15

 0 100 200 300 400 500 600 700 800 900 1000
 cp
 (Hz)
 Figure A3. CPMG relaxation dispersion profiles of residue L219, acquired at static magnetic field strengths of 11.7 T (blue) and 14.1 T
 (black). Dashed lines show the results of fitting a two-state exchange model globally to both data sets, which yielded an exchange rate of
 7150 ± 4100 s–1, major state population of 0.99 ± 0.01, and chemical shift difference of 7 ± 4 ppm. The dotted horizontal lines show the
495 average R2 value at each field strength.

 19
500 (Figure A4 continues on the next page)

 20
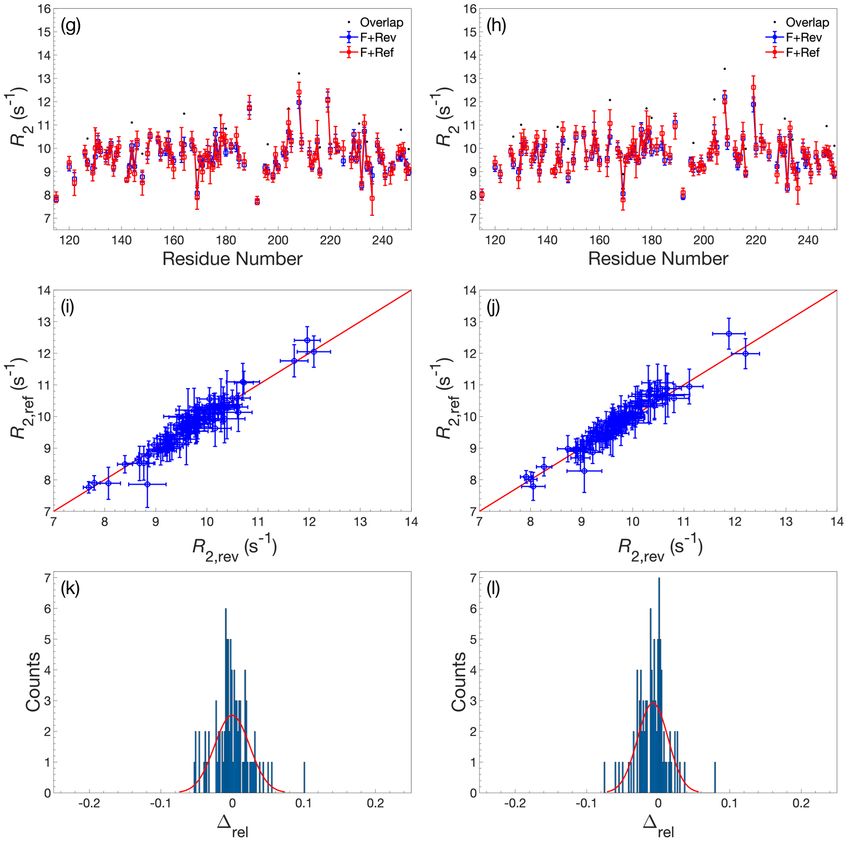
Figure A4. Comparison of R2 determined by accordion R1r using various acquisition schemes. (a–f) Comparison of R2 values determined
 using either adiabatic alignment (blue) or hard-pulse alignment (red). (g–l) Comparison of R2 values determined using either forward–reverse
505 (blue, F+Rev) accordion modes or forward–reference (red, F+Ref). (a, c, e) R2 determined by forward–reverse accordion modes, (b, d, f) R2
 determined by forward–reference accordion modes. (a, b, g, h) R2 plotted versus residue number. Black dots indicate residues showing
 significant overlap in the 1H-15N HSQC spectrum. (c, d, I, j) Covariance plot of R2 datasets. (e, f, k, l) Histogram of the relative differences
 between datasets. The red curve describes the normal distribution that best fits the data. In panels (a–d, g–j), error bars indicate ± 1 SD.

 21
You can also read