Prediction of Epidemic Trends in COVID-19 with Mann-Kendall and Recurrent - UKM
←
→
Page content transcription
If your browser does not render page correctly, please read the page content below
Sains Malaysiana 50(4)(2021): 1131-1142
http://doi.org/10.17576/jsm-2021-5004-23

 Prediction of Epidemic Trends in COVID-19 with Mann-Kendall and Recurrent
 Forecasting-Singular Spectrum Analysis
 (Ramalan Kecenderungan Wabak pada Covid-19 dengan Mann-Kendall dan Ramalan Berulang-Analisis Spektrum
 Tunggal)

 S HAZLYN M ILLEANA S HAHARUDIN*, S HUHAIDA I SMAIL, M OHD S AIFUL S AMSUDIN,
 A ZMAN A ZID, M OU L EONG TAN & M UHAMAD A FDAL A HMAD B ASRI

 ABSTRACT
Novel coronavirus also known as COVID-19 was first discovered in Wuhan, China by end of 2019. Since then, the virus
has claimed millions of lives worldwide. In 29th April 2020, there were more than 5,000 outbreak cases in Malaysia as
reported by the Ministry of Health Malaysia (MOHE). This study aims to evaluate the trend analysis of the COVID-19
outbreak using Mann-Kendall test, and predict the future cases of COVID-19 in Malaysia using Recurrent Forecasting-
Singular Spectrum Analysis (RF-SSA) model. The RF-SSA model was developed to measure and predict daily COVID-19
cases in Malaysia for the coming 10 days using previously-confirmed cases. A Singular Spectrum Analysis-based
forecasting model that discriminates noise in a time series trend is introduced. The RF-SSA model assessment is based
on the World Health Organization (WHO) official COVID-19 data to predict the daily confirmed cases after 29th April
until 9th May, 2020. The preliminary results of Mann-Kendall test showed a declining trend pattern for new cases during
Restricted Movement Order (RMO) 3 compared to RMO1, RMO2 and RMO4, with a dramatic increase in the COVID-19
outbreak during RMO1. Overall, the RF-SSA has over-forecasted the cases by 0.36%. This indicates RF-SSA’s competence
to predict the impending number of COVID-19 cases. The proposed model predicted that Malaysia would hit single digit
in daily confirmed cased of COVID-19 by early-June 2020. These findings have proven the capability of RF-SSA model in
apprehending the trend and predict the cases of COVID-19 with high accuracy. Nevertheless, enhanced RF-SSA algorithm
should to be developed for higher effectivity in capturing any extreme data changes.
Keywords: COVID-19; forecasting; Mann-Kendall test; recurrent forecasting (RF); singular spectrum analysis (SSA)

 ABSTRAK
Koronavirus baru juga dikenali sebagai COVID-19 telah dilaporkan pertama kali di Wuhan, China pada akhir 2019.
Sejak itu, virus tersebut telah meragut berjuta-juta nyawa di seluruh dunia. Pada 29 April 2020, terdapat lebih
daripada 5,000 kes wabak di Malaysia seperti yang dilaporkan oleh Kementerian Kesihatan Malaysia (KKM). Kajian
ini bertujuan untuk menilai analisis tren wabak COVID-19 menggunakan ujian Mann-Kendall dan meramalkan kes
COVID-19 yang akan datang di Malaysia menggunakan model Ramalan Berulang-Analisis Spektrum Tunggal (RF-SSA).
Model RF-SSA dibangunkan untuk mengukur dan meramalkan kes COVID-19 harian di Malaysia selama 10 hari akan
datang dengan menggunakan kes yang telah disahkan sebelumnya. Model ramalan berdasarkan Analisis Spektrum
Tunggal yang membezakan kebisingan dalam aliran siri masa diperkenalkan. Penilaian model RF-SSA berdasarkan
data rasmi COVID-19 oleh Organisasi Kesihatan Dunia (WHO) untuk meramalkan kes-kes yang diselesaikan setiap
hari selepas 29 April hingga 9 Mei 2020. Hasil awal ujian Mann-Kendall menunjukkan penurunan corak tren untuk
kes baru semasa Perintah Kawalan Pergerakan (RMO) 3 berbanding RMO1, RMO2 dan RMO4, dengan peningkatan
mendadak wabak COVID-19 semasa RMO1. Secara keseluruhan, RF-SSA telah meramalkan kes sebanyak 0.36%. Ini
menunjukkan kecekapan RF-SSA untuk meramalkan jumlah kes COVID-19 yang akan datang. Model yang dicadangkan
juga meramalkan bahawa Malaysia akan mencapai angka satu digit dalam kes COVID-19 yang disahkan setiap hari pada
awal Jun 2020. Penemuan ini telah membuktikan kemampuan model RF-SSA dalam menangkap tren dan meramalkan
kes COVID-19 dengan ketepatan tinggi. Walaupun begitu, algoritma RF-SSA harus dipertingkatkan untuk keberkesanan
yang lebih tinggi dalam menangkap perubahan data yang melampau.
Kata kunci: Analisis spektrum tunggal (SSA); COVID-19; ramalan; ramalan berulang (RF); ujian Mann-Kendall
1132

 I NTRODUCTION concluded the basic number of reproductions could be 6.47.
The World Health Organization (WHO) reported the They also expected confirmed cases within 7 days (23rd
severe acute respiratory coronavirus-2 syndrome known January - 29th January, 2020). Therefore, they predicted
as COVID-19 in late December 2019. COVID-19 sequence hitting the plateau after two weeks (as of 23rd January,
similarity scores with Bat SARS-like, SARS-CoV, and 2020). In Thompson (2020), data from 47 patients were
MERS-CoV were based on approximately 99, 96, and 50%, used to estimate continuous human-to-human transmission
respectively (Kannan et al. 2020). Malaysian National of COVID-19. The author concluded that the transmission
Security Council (NSC) (2020), showed that Malaysia is 0.4, and if the duration of the hospitalization symptom
faces the first COVID-19 outbreak on 25th January 2020. is half the data tested, the transmission is just 0.012.
The number of cases has since increased, especially in The study of Muhammad Rezal et al. (2020) provided
March 2020 and April 2020. This rise in cases of COVID-19 an approximation of the Susceptible Infected Recovered
outbreaks in Malaysia has urged several actions to be (SIR) Model for the COVID-19 outbreak in Malaysia for
taken, including the installation of an investigation system short-term COVID-19 cases. The author pointed out that
for the immediate detection of cases; rapid diagnosis; the transmission rate is 0.22%, meaning an infectious
immediate isolation of cases and rigorous tracking; and individual can transmit or spread the disease to 1 person (on
the quarantining of close contacts of those positively tested average) in four days. The transmission rate corresponding
with COVID-19 (Abdullah et al. 2020). to a potential scenario that a person would infect another
 Since then, the Crisis Preparedness Response Center person within 4 days should not be taken lightly. Therefore,
(CPRC) of the Ministry of Health Malaysia has begun a one-to-one transmission at 4-day intervals can be
to record and report cases daily. The ministry website considered very conservative.
offers regular information on new COVID-19 confirmed This paper established trend analysis and prediction
incidents, recoveries and deaths. Thus, YAB Tan Sri model to predict the new regularly reported cases of
Muhyiddin Hj Mohd Yassin, Malaysia’s Prime Minister COVID-19 in Malaysia for a few months. Mann-Kendall
made a press release, the Malaysian government agreed test was widely used to classify significant trends in
to enforce a nationwide first step Restricted Movement time series (Hamzah et al. 2017; Samsudin et al. 2017).
Order (RMO) from 18th March to 31st March. This order The identical distribution of Mann-Kendall’s Test for a
is enforced under the Control and Prevention of Infectious n independent series and data (x1,x2,…,xn) suggests the
Diseases Act 1988 and the Police Act 1967, with the aim previous acceptance of the null hypothesis H0 (non-trend).
of isolating the source of the outbreak of COVID-19. Using the Mann-Kendall ‘s Test, it is possible to evaluate
According to Malaysian National Security Council (NSC) the presence of an increasing or decreasing trend, but it is
(2020), a number of activities, including operating, are not difficult to quantify because the tool, Sen’s Slope Estimator
allowed during RMO, except for essential services. RMO developed by Sen (1968), allows to calculate the slope of
deployed in four stages: Phase I (18 March to 31 March), the regression line for each parameter at any time without
Phase II (1 April 2020 to 14 April 2020), Phase III (15 the influence of outliers (Bouza-Deaño et al. 2008). In this
April 2020 to 28 April 2020) and Phase IV (29 April 2020 research, Singular Spectrum Analysis (SSA) was used as
to 12 May 2020). RMO was made to prohibit the citizen a basis approach to forecasting model development. In
movement and mass assembly nationwide would include general, SSA provides a representation of a univariate time
all religious, sports, social and cultural activities. series that is transformed in terms of the eigenvalue values
 Several predictive and modelling researches was and the eigenvectors of the trajectory matrix. SSA is useful
conducted worldwide on COVID-19. Zhao et al. (2020) to separate time series data into trend, seasonal, and noise
suggested a statistical model for estimating the actual by decomposing its time series eigen and reconstructing it
number of COVID-19 cases not identified in the first half of into group selection. However, separating the components
January 2020. Nishiura et al. (2020) proposed an estimated in this approach depends on the selection of parameters
COVID-19 infection rate model in Wuhan, China using data which is the choice of window length, L forming the
from 565 Wuhan-evacuated Japanese people between 29th trajectory matrix and identifying the number of leading
and 31st January 2020. They conclude that prevalence is components, r based on eigenvector plot. This separation
calculated at 9.5%, and the risk of death is 0.3 to 0.6%. is very important to ensure that trend, seasonal and noise
However, the number of Japanese people evacuated from components are easily separated. Hence, in this study,
Wuhan is limited and inadequate to estimate infection different lengths of L and r selection were tested on
and death. Tang (2020) proposed a mathematical model COVID-19 data to investigate its effect on component
to estimate COVID-19 transmission likelihood. They extraction. Details of the research will be addressed in the
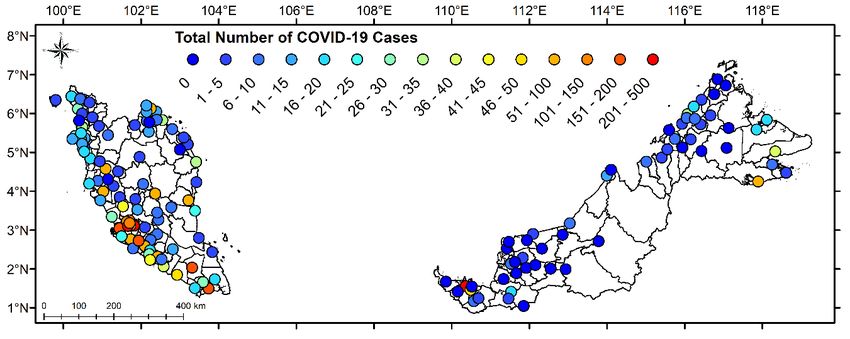
1133

next sections where the data obtained in this review will PCR) diagnosed the suspected COVID -19 cases and
be discussed in section two, accompanied by methods, confirmed as COVID-19 victim. All fully anonymised,
conclusions and discussions, and the final part will be laboratory-confirmed cases of COVID-19, in which 5,945
the conclusion. A Singular Spectrum Analysis-based cases of COVID-19 infection have been reported by the
forecasting model is introduced, discriminating noise in Ministry of Health in 16 states in Malaysia.
a time-series trend. The Recurrent Forecasting-SSA (RF- Figure 1 indicates Malaysia’s total positive
SSA) model assessment is based on the official data of the COVID-19 cases. This shows a large rise in the number
World Health Organization (WHO) COVID-19 to predict of positive cases related to the second wave of COVID-19
daily confirmed cases from 29th April to 9th May 2020. The pandemic in Malaysia. With this substantial amount,
aims are to gain a better understanding of the trend in the Malaysia’s government declared a Restriction Movement
situation and recovery phase over the duration of RMOs Order (RMO)/Movement Control Order (MCO) from 18th
and to calculate and forecast COVID-19 cases in Malaysia March to 31st March 2020. RMO was later expanded to
for the next 10 days using previously reported cases. phase four.
 Figure 2 shows Malaysia’s number of cases reported
 DATA DESCRIPTION for COVID-19 over the last 96 days. The Ministry of Health
 (MOH) has categorized by area number four COVID-19
Daily Coronavirus Disease 2019 (COVID-19) prevalence areas in Malaysia. According to the National Security
data were collected from 25th January 2020 to 29th April Council (MKN), the four zones are: green zone for non-
2020 as reported on the official website of the Ministry positive areas, yellow zone for areas with 1 to 20 positive
of Health of Malaysia. As this COVID-19 is a newly cases, orange zone for areas with 21 to 40 positive cases,
discovered virus, no previous year data is available. and red zone for areas with more than 40 positive cases
Reverse Transcription Polymerase Chain Reaction (RT- (Kannan et al. 2020).

 FIGURE 1. COVID-19 Daily confirmed cases in Malaysia from 25th January
 2020 until 29th April 2020

 FIGURE 2. State classification according to number of COVID-19 cases in Malaysia
1134
M ETHODS If the p-value is small enough, the trend is possibly
This section explains Trend Analysis specifics using due to random sampling. At the significance level of 0.05,
Mann-Kendall Test, Singular Spectrum Analysis Model, if p < 0.05, the current trend is assessed as statistically
and its components. The Mann-Kendall test was performed significant.
using COVID-19 outbreak data during Malaysia’s RMO If a linear trend exists, the true slope can be
process. The method is based on correlating observed estimated by (a) computing the slope’s least square
variables with their time series. Usually, Mann-Kendall’s estimate, or (b) linear regression methods. However,
non-parametric statistical test was used to assess the (b) can deviate greatly from the true slope if the data set
significance of a site trend (Mann 1945). Statistics of the contains gross errors or outliers. Sen (1968) developed a
Mann-Kendall, S is defined as: method called Sen’s method which is not greatly affected
by gross data errors or outliers and can be calculated when
= ∑ −1
=1 ∑ = +1 ( − )
(1) data is missing. This test is close to the Mann-Kendall
test (Kendall 1975).
where Xo are the sequential data values, n is the length of To obtain the Sen’s slope estimator, it is first
the data set, and necessary to calculate the N’ slope estimates, Q, as:
1 > 0
=
′ − (8)
( ) = { 0 = 0 (2) ′ −1
−1 < 0
where x’ i and x i are data values at times i’ and i,
Kendall (1975) has observed that, when n > 8, the respectively, and where i’ >i; N’ is the number of data pairs
statistic S is approximately normally distributed with the for which i’ >i is used. Q’s median of these N’ values is
[ ] = 0 Sen’s slope estimator. If there is only one datum for each
mean and variance given by:= 0
[ ]
period of time, then
[ ] = 0 (3)
′ =
( −1) (9)
2
( −1)(2 +5)−∑
( −1)(2 +5)−∑ ( −1)(2 +5)
( )
( ) == =1 =1
( −1)(2 +5) (4)
18 18 The results of the Mann-Kendall trend test are then
where ti is the number of ties of extent
i. The standardized interpreted. Test processing with p-values < 0.05 indicates
( −1)(2 +5)−∑ =1 ( −1)(2 +5)
( )
test statistic Z is =
computed by: 18 that there is a significant difference for that particular
test. If the Sen’s slope shows a positive value, there’s an
−1 upward trend and vice versa. For the test showing the
> 0
= { √ ( ) (5) p-value > 0.05, there is no significant difference for the
0 = 0 + 1√ ( ) ≤ 0 parameter.
SINGULAR SPECTRUM ANALYSIS (SSA) MODEL
Under the null hypothesis of no trend, the
standardized Mann-Kendall statistic Z follows a standard Singular Spectrum Analysis (SSA) is a model-free
normal distribution with mean zero and variance one. method that can be applied to all data forms, whether
A positive Z value indicates an upward trend, while a gussian or non-gussian, linear or non-linear, stationary
negative one indicates a downward trend. The p-value or non-stationary (Shaharudin et al. 2020). Daily
(probability value p) of the Mann-Kendall statistic S COVID-19 data can be decomposed into a number of
sample data can be estimated using the normal cumulative additive components via SSA that can be defined in trend,
distribution function: seasonal, and noise components (Shaharudin et al. 2019;
Suhartono et al. 2019). Possible SSA implementations
are diverse (Alexandrov et al. 2008; Chau & Wu 2010;
=1 = 1 (6)
= Pr( +1 = | +1 = 1), ≥ 0, ∑
Rodriguez-Aragon & Zhiglkavsky 2010). SSA comprises
where two complementary stages of decomposition and
| | − 2
1
Ф(| |) = 2 ∫0 reconstruction (Carvalho & Rua 2014).
2
(7)1135
STAGE 1: DECOMPOSITION to reconstruct the original series and use the reconstructed
In the decomposition stage, two steps are embedding and series to further analyze such as forecasting.
singular value decomposition (SVD). Generally, this stage Step 1: Grouping. In the grouping step, the trajectory
aims to decompose the series to obtain the Eigen time matrix is split into two groups based on the trend and noise
series data. components. The indices set {1,…,L} is partitioned into
Step I: Embedding. The first step in basic SSA algorithm m disjoint subsets I1, …, Im, corresponding to spliting the
is embedding step which refer to constructing a elementary matrices into groups. Set I = {i1,…,ip}, then the
one dimensional series i.e. univariate vector, resultant matrix XI is defined as
= { 1 , 2 , … , } to a multidimensional series contain
in a matrix, X = (X1 ,…, XK ) called the trajectory matrix as X = X 1 + ⋯ + X (13)
shown in (10). The rows and columns of X are subseries
of the original one-dimensional time series data. The The resultant matrices are computed for I = I1,…, Im and
dimension of the trajectory matrix is called the window substituted in (14). The expansion is defined as
length, L which ranges from 2 ≤ ≤ ⁄2. The columns
of the trajectory matrix, X are called lagged vectors, K = X = X 1 + ⋯ + X (14)
T - L + 1.
1 2 3 ⋯
where the trajectory matrix is represented as a total of
2 3 4 ⋯ +1 resultant matrices. The selection of the sets I = I1,…, Im is
3 4 5 … +2 known as eigentriple grouping.
X = ( 1 , … , ) =
⋮ ⋮ ⋮ ⋱ ⋮ (10) Step 2: Diagonal averaging. Final step in SSA transforms
+1 +2 ⋯ each matrix of the grouped decomposition (14) into a
( ) new series of length T.
Let Z be an L × K matrix with elements zij,1 ≤ i ≤ L, 1 ≤
Step II: Singular Value Decomposition (SVD). In the second j ≤ K. Set L^* = min (L, K), K^* = max (L, K) and N = L
step, trajectory matrix in Step I is decomposed to obtain + K - 1. Let zij^* = zij if L < K and zij* = zji . By making the
its eigen time series based on their singular values using
diagonal averaging, we transfer the matrix Z into the z1,
Singular Value Decomposition (SVD). The SVD of the
…, zT using the formula
trajectory matrix, X is represented as
1
∑ =1 , − +1
∗
1 ≤ < ∗
X = Σ (11)
1 ∗ ∗
∑ =1 , − +1 ∗ ≤ ≤ ∗ (15)
∗
where U = (u1,…,uL) is an L × L orthogonal matrix, V 1 ∗
= (v1,…,vk) is a orthogonal matrix and Σ is an L × K ∑ − +1 ∗ ∗ < ≤
{ − +1 = − ∗+1 , − +1
diagonal matrix with nonnegative real diagonal entries Σii
= σi for i = 1, …, L. The vectors ui are called left singular
Diagonal averaging in (15) applied to a
vectors, the vi are the right singular vectors and the σi
resultant matrix X Ik produced reconstructed series
are the singular values. Let S = XXT where the singular ̃ ( ) ( ) ( )
= (
̃ 1 , … , ̃ ). H e n c e , t h e i n i t i a l s e r i e s
values be arranged in descending order such that (σ1 ≥ σ2
= { 1 , 2 , … , } is decomposed into a sum of m
≥ ... ≥ σ L). Let d = max{i, such that σi > 0}. = ⁄√ ( = 1, … , ) series, = ∑
( )
.
reconstructed series, =1
̃ . The reconstructed
= ⁄√ ( = 1, … , ) , then, the SVD of the trajectory matrix
series produced by the elementary grouping will be called
X can be written as
elementary reconstructed series.
X = X1 + ⋯ + X d (12)
FORECASTING WITH SSA MODEL
where Xi = σi μi v . Note that, the matrices of Xi are called
i
T
In making the SSA forecasting, a fundamental condition
elementary matrices if Xi has rank one. The collection is that the time series satisfies a linear recurrent relation
(σi, μi, vi) is called the eigentriple of the SVD. (LRR). A time series YT = (y1, …, yT ) satisfies LRR of order
d if there exists the coefficients a1,…, ad such that:
STAGE 2: RECONSTRUCTION
There are two steps in the reconstruction stage which are + = ∑ =1 + − , 1 ≤ ≤ − , ≠ 0, < (16)
grouping and diagonal averaging. Overall, this stage aims1136
In this study, Recurrent SSA is used for forecasting help to identify the trend components. Note that the trend
purpose since it is a popular approach when predicting has complex form when the trend and noise components
data (Danilov 1997). SSA forecasting is based on were not properly distinguished. It is highly possible that
the multiplication of a weight that obtained from the a lack of separability caused the presence of the mix-up
eigenvector. between the components. This information can be used
Let us assume that ∇ is the vector of the first L as a guideline for proper grouping of trend and noise
- 1 components of the eigenvector Uj and πj is the last separation by the component. Besides, it could also reflect
component of Uj (j = 1,…, r). Denoting 2 = ∑ −1 2 we a connection between decomposition and reconstruction
define the coefficient vector as: stages.
1
= ∑ =1 ∇ (17) R ESULTS AND D ISCUSSION
1− 2
The Mann-Kendall Test was used to study the 77-day trends
The recurrent SSA forecasting algorithm can be presented
from 18th March 2020 to 12th May 2020 of COVID-19 cases
as follows.
in Malaysia. This study shows either an upward trend,
a downward trend or no (NT) trend. When a trend was
1. The time series ZN+h = {z1,…,zN+h} is defined by
detected (positive or negative), quantified levels of the
above-mentioned trend were determined using a Sen slope
̃ , = 1, … , with a p-value of 0.05. Table 1 shows clearly that during
= { −1
∑ =1 − , = + 1, … , + ℎ (18)
the RMO period, new cases of RMO3 showed a declining
trend pattern compared to RMO1, RMO2, and RMO4.
2. The numbers ZT+1,…,zN+h are the h step ahead During Phase I RMO, the outbreak of COVID-19 has
recurrent forecasts. increased dramatically across the country since 15th March
These algorithms described as follows and further 2020. On the basis of the investigation, the majority of
details can be found in Hossein et al. (2017). these additional cases relate to the Seri Petaling Cluster
(Ministry of Health Malaysia (MOH), Malaysia 2020).
SSA PARAMETER SELECTION Figure 3 shows statistically downward trends following
The trend extraction from the original time series data the implementation of RMO Phase II, RMO Phase III, and
depends on the selection of window length, L to form the RMO Phase IV.
trajectory matrix in SSA. An improper values selection As mentioned in the previous section, the Malaysian
for the parameter L yield unfinished reconstruction hence daily COVID-19 cases were predicted using the SSA
could potentially bring about misleading forecasting model. The SSA predicting algorithm known as Recurrent
results. According to Mondal et al. (2012), L should be Forecasting was used to predict future cases from 29th April
large enough but not greater than half of the number of 2020 to 9th May 2020. At the time of this experiment,
observations understudy ≤ ⁄2. However, the appropriate
2 ≤ at historical cases were used from 25th January 2020 to
selection of window length is dependent on the current 29th April 2020 and future 10 days ahead of COVID-19
problems as well as the structure of the time series data cases were predicted accordingly. Figure 6 shows the
(Alonso et al. 2009). Generally, there is no rough guide confirmed cases from 25th January 2020 to 29th April 2020
to determine the proper L in data set (Shaharudin et al. and the forecasted daily cases until 9th May 2020.
2015). In addition, the separability conditions for shorter The first stage of this study is the decomposition
time series could be restrictive due to the singular value of COVID-19 data into components facilitated by the
decomposition properties used in estimating the signal SSA model. This decomposition by SSA requires the
component in SSA. Therefore, in this study, several L, identification of the parameter pair. The choice of L is a
which are ⁄2 , ⁄5 , ⁄10 , ⁄20 were investigated on compromise between information content and statistical
COVID-19 data based on performance error which is Root confidence (Hassani 2007). The value of the appropriate
Mean Square Error (RMSE). should be able to clearly resolve the various oscillations
Another parameter that needs to be considered hidden in the original signal.
when using SSA approach is the amount of eigentriples The performance of the SSA results was determined
employed for the reconstruction r by using eigenvector by evaluating its weighted correlation, i.e. w-correlation
plot. This plot reflects the eigenvector of the SVD of the at distinct window length, The W-correlation, as explained
trajectory matrix for the time series data. Inspect the in the Methods section, calculated the separation between
one-dimensional graphs of eigenvectors where it would trend, seasonal and noise components of the reconstructed
time series. A number of L selections which were L =1137 T/2, T/5, T/10 and T/20, representing L = 48, 19, 10 and Detailed analysis showed that the RF-SSA obtained 5, respectively, for T based on 96 daily COVID-19 data a Mean Absolute Error (MAE) of 11.00 and 19.12 for cases, were selected. These scales were chosen to fit the Root Mean Square Error (RMSE). Meanwhile, Pearson time series data as well as to strike a balance in order to correlation (r) of 0.96 near 1.0 indicates a good correlation achieve a proper lag vector sequence. between confirmed and predicted cases. Finally, the Mean Figure 4 shows the w-correlation of day-to-day Forecast Error (MFE) shows that the RF-SSA algorithm COVID-19 data with different window lengths using SSA. tends to over-predict COVID-19 cases by 2.8%. Figure As can be seen from the plot, the W-correlation shows a 6 also showed that RF-SSA model predicted the daily declining pattern as the total window length declines for verified COVID-19 cased in Malaysia would hit one digit the SSA approach. The correlations between trends and by early-June 2020. other components need to be closed to zero for trend As COVID-19’s number of daily cases was small, extraction. This means that distinct window lengths have Figure 6 shows a noticeable but vulnerable decreasing a certain effect on the separability of the component. It pattern from 27th March 2020. One of the contributing also shows that SSA is directed to the lowest w-correlation factors to the slightly decreasing trend was the Movement at window length, L = T/20 indicating the strongest Control Order (MCO) declared by the Malaysian separability between the reconstructed components as it government on 18th March to 31st March 2020. The is nearest to zero. prediction plot using RF-SSA in Figure 6, showed a general Root mean square error (RMSE) is used to evaluate pattern of nonlinear rising trend in the daily confirmed the performance of L. Table 2 presents the components COVID-19 cases in Malaysia. of the reconstructed time series at L = T/20, which has The prediction and estimate of daily cases of the smallest RMSE compared to the other L. It is noted COVID-19 obtained was influenced by the case description that higher RMSE values are obtained in this study due to reported to CPRC daily, the large number of pending high model variance when the number of samples is small outcome test daily was certainly influential to a non- (Boehmke & Greenwell 2019). In summary, the analysis of consistent increase in the number of confirmed cases. daily COVID-19 case data appears to suggest that L = T/20 Several of the largest clusters found by the Ministry of is suitable on the basis of a short time series of outbreak Health Malaysia, such as Seri Petaling Tabligh Cluster, data. Wedding Reception in Bandar Baru Bangi, Seri Petaling Figure 5 shows the components of the reconstructed Sub-Cluster in Rembau, Italy Cluster in Kuching, time series plot based on two eigentriple (ET) from the Sarawak and Church Fellowship Cluster in Sarawak, trend of RF-SSA for daily COVID-19 cases in Malaysia. support the prediction case increase. Reconstructed series is a new set of data formed from Although more data are needed to have detailed original data, clear from noise. It is a very important part prediction, to date, virus spread has decreased, and of SSA to ensure that the forecasting results obtained are the number of daily deaths has decreased steadily. The more precise and accurate (Hassani & Zhigljavsky 2009). number of reported cases, however, has yet to hit one The trend component of time series data is used to observe digit. Limitation in this research is discussed and should the occurrence of the trend and pattern of cases as randomly be emphasized when using the RF-SSA model, particularly tabulated as per day cases, as shown in Figure 5. The pandemic data in Malaysia. First, RF-SSA model works best trend in Figure 5(a) and Figure 5(b) is precisely generated when data shows a stable or consistent pattern over time by the leading eigentriple, coinciding with the first with a minimum outlier. It will help to obtain accurate and reconstructed component in Figure 5. In the meantime, accurate results for future predictive cases. Next, the the trend in Figure 5(b) is generated precisely by the two sudden increase in data will result in a low performance leading eigentriples, coinciding with the first and second of the forecasting results using this predictive RF-SSA reconstructed components in Figure 5. The straight and model. After that, the RF-SSA model is mainly used to dashed lines in the plot apply, respectively, to the original project future values using historical time series data for time series COVID-19 data and the reconstructed series short-term forecasting. Lastly, the recurrent approach is a based on SSA’s extracted trend components. The plot of better contender than the vector approach for forecasting the reconstructed time series components produced by both SSA data in short and medium time series. However, under leading eigentriple follows the original COVID-19 data, such scenarios, users should also evaluate the performance although there is noise component omission specifically of the SSA forecasting approach on their data for a complete for L = 5 in Malaysia for daily COVID-19 cases. picture.
1138

 FIGURE 3. Comparison of Sen’s slope between New Cases during 4 RMOs

 FIGURE 4. Effect of w-correlation based on SSA using
 COVID-19 data at different window lengths
1139

 (a)(a) (b)
 (b)

 FIGURE 5. Plot of daily COVID-19 cases of reconstructed components
 from extracted trends using SSA at (a) L = 5, ET 1 (b) L = 5, ET 2

 FIGURE 6. Confirmed cases versus predicted RF-SSA of COVID-19 in Malaysia

 TABLE 1. Summary of Mann-Kendall test value for new cases in Malaysia during RMO

TEST RMO Kendall’s tau p-value Sen’s slope Trend
 RMO1 0.2652 0.2073 2.5000 NT
 RMO2 -0.1768 0.4108 -3.1667 NT
CASES
 RMO3 -0.4725 0.0215 -3.5000 ↓
 RMO4 -0.2747 0.1889 -2.8889 NT
1140

 TABLE 2. The performance of comparison prediction model based on SSA for several

 Window length, L RMSE
 T ⁄ 2 = 48 29.51
 T ⁄ 5 = 19 29.67
 T ⁄ 10 = 10 23.97
 T ⁄ 20 = 5 19.12

 C ONCLUSION ACKNOWLEDGEMENTS
Currently, confirmed cases reported on a daily basis This research has been carried out under Fundamental
show a declining and plateauing trend. As the number Research Grants Scheme 2019-0132-103-02 (FRGS/1/2019/
of COVID-19 cases recovered increased, this led to a STG06/UPSI/02/4) provided by the Ministry of Education,
decrease in active cases during Phase IV of the RMO. This Malaysia.
contributed to the flattening of the curve and the nation
is now entering recovery. This statement supported the REFERENCES
outcome of the Mann-Kendall test of this study, which
 Abdullah, S., Mansor, A.A., Napi, N.N.L.M., Mansor, W.N.W.,
showed downward trends in all cases and new cases in Ahmed, A.N., Ismail, M. & Ramly, Z.T.A. 2020. Air
the states. In addition, this paper studies the applicability quality status during 2020 Malaysia Movement Control
of the RF-SSA model to the prediction of COVID-19 cases Order (RMO) due to 2019 novel coronavirus (2019-nCoV)
in Malaysia. The application of this model is particularly pandemic. Science of The Total Environment 729: 139022.
advantageous for the health authorities in terms of Alexandrov, T., Golyandina, N. & Spirov, A. 2008. Singular
flattening the curve by preparing a timely and effective spectrum analysis of gene expression profiles of early
strategy. In addition, this model allows health authorities drosophila embryo: Exponential-in-distance patterns.
to better understand the pattern of the outbreak. It was Research Letters in Signal Processing 2008: Article ID.
found that the pattern follows the RF-SSA model that can 825758.
 Alonso, F.J., Salgado, D.R., Cuadrado, J. & Pintado, P. 2009.
be used to predict the growth pattern of outbreak cases in
 Automatic smoothing of raw kinematics signals using SSA
Malaysia. Using this model, the selection of the parameter
 and cluster analysis. Euromech Solid Mechanics Conference
is the choice of the length of the window, L and the total Lisbon. pp. 1-9.
number of eigentriples employed for reconstruction, r. Boehmke, B. & Greenwell, B 2019. Hands-On Machine Learning
These results show that the parameter L = 5 (T / 20) was with R. Broken Sound. Parkway NW: Taylor & Francis. pp.
suitable for use in short time series outbreak data and 1-15.
that it is important to obtain an appropriate number of Bouza-Deaño, R., Ternero-Rodríguez, M. & Fernández-Espinosa,
eigentriples which will have an effect on the forecasting A.J. 2008. Trend study and assessment of surface water
result. Overall, the results showed that the RF-SSA quality in the Ebro River (Spain). Journal of Hydrology
model was able to predict this pandemic with reasonable 361(3-4): 227-239.
accuracy as the model over-forecasted by 0.36% with high Carvalho, M.D. & Rua, A. 2014. Real-Time Nowcasting the US
 Output GAP: Singular Spectrum Analysis at Work. Portugal:
correlation values between confirmed and predicted cases.
 Banco De Portugal.
However, the RF-SSA model is not capable of capturing
 Chau, K.W. & Wu, C.L. 2010. Hybrid model coupled with
the sudden drop in COVID-19 cases, likely due to the RMO, singular spectrum analysis for daily rainfall prediction.
which was extended to 12th May 2020. In order to improve Journal of Hydroinformatics 12(4): 458-473.
the accuracy of the model, more information is needed to Danilov, D. 1997. The Caterpillar method for time series
better predict COVID-19 cases over a long period of time. forecasting. In Principal Components of Time Series: The
In the meantime, case definition and data collection must Caterpillar Method. Russian: University of St. Petersburg.
be maintained in real time in order to improve the RF-SSA Gilbert, R.O. 1987. Statistical Methods for Environmental
for further study. It is suggested that the RF-SSA model be Pollution Monitoring. New York: John Wiley & Sons. pp.
enhanced so that the model can capture sudden and rapid 23-52.
changes in the data set.
1141

Hamzah, F.M., Saimi, F.M. & Jaafar, O. 2017. Identifying Mann-Kendall in analyzing water quality data trend at Perlis
 the monotonic trend in climate change parameter River, Malaysia. International Journal on Advanced Science,
 in Kluang and Senai, Johor, Malaysia. Sains Malaysiana Engineering and Information Technology 7(1): 78-85.
 46(10): 1735-1741. Sen, P.K. 1968. Estimates of the regression coefficient based on
Hassani, H. 2007. Singular spectrum analysis: Methodology Kendall’s tau. Journal of the American Statistical Association
 and comparison. Journal of Data Science 5: 239-257. 63(324): 1379-1389.
Hassani, H. & Zhigljavsky, A. 2009. Singular spectrum Shaharudin, S.M., Ahmad, N., Mohamed, N.S. & Aziz, N.
 analysis: Methodology and application to economics data. 2020. Performance analysis and validation of modified
 Journal of Systems Science and Complexity 22(3): 372- singular spectrum analysis based on simulation torrential
 394. rainfall data. International Journal on Advanced Science
Hossein, H., Mahdi, K. & Masoud, Y. 2017. An improved SSA Engineering Information Technology 10(4): 1450-1456.
 forecasting result based on a filtered recurrent forecasting Shaharudin, S.M., Ahmad, N. & Zainuddin, N.H. 2019.
 algorithm. Statistics/Theory of Signals 355(9): 1026-1036. Modified singular spectrum analysis in identifying rainfall
Kannan, S., Ali, P.S.S., Sheeza, A. & Hemalatha, K. 2020. trend over Peninsular Malaysia. Indonesian Journal of
 COVID-19 (Novel Coronavirus 2019)-recent trends. Electrical Engineering and Computer Science 15(1): 283-
 European Review for Medical and Pharmacological Sciences 293.
 24(4): 2006-2011. Shaharudin, S.M., Ahmad, N. & Yusof, F. 2015. Effect of
Kendall, M.G. 1975. Rank Correlation Measures. London: window length with singular spectrum analysis in extracting
 Charles Griffin. pp. 11-36. the trend signal of rainfall data. AIP Proceedings 1643(1):
Malaysian National Security Council (NSC). 2020. 321-326.
 Movement Control Order (RMO). https://www.mkn. Suhartono, Ashari, D.E., Prastyo, D.D., Kuswanto, H. & Lee,
 g o v. m y / w e b / m s / C O V I D - 1 9 / . A c c e s s e d o n 1 3 M.H. 2019. Deep neural network for forecasting inflow
 May 2020. and outflow in Indonesia. Sains Malaysiana 48(8): 1787-
Mann, H.B. 1945. Nonparametric tests against trend. Journal 1798.
 of the Econometric Society 13(3): 245-259. Tang, B., Wang, X., Li, Q., Bragazzi, N.L., Tang, S., Xiao,
Malaysia Ministry of Health Malaysia (MOH). 2020. Press Y. & Wu, J. 2020. Estimation of the transmission risk
 Statement Updates on The Coronavirus Disease 2019 of the 2019-nCoV and its implication for public health
 (COVID-19) Situation in Malaysia. https://www.moh.gov. interventions. Journal of Clinical Medicine 9(2): 462-465.
 my/index.php/pages/view/2019-ncov-wuhan-kenyataan- Thompson, R.N. 2020. Novel coronavirus outbreak in Wuhan,
 akhbar Accessed on 13 May 2020. China, 2020: Intense surveillance is vital for preventing
Ministry of Health Malaysia. 2019. Coronavirus Website. http:/ sustained transmission in new locations. Journal of Clinical
 covid19.moh.gov.my/. Medicine 9(2): 498-505.
Mondal, R.A., Kundu, S. & Mukhopadhyay, A. 2012. Rainfall Zhao, S., Musa, S.S., Lin, Q., Ran, J., Yang, G., Wang, W., Lou,
 trend analysis by Mann-Kendall test: A case study of North- Y., Yang, L., Gao, D., He, D. & Wang, M.H. 2020. Estimating
 Eastern part of Cuttack district, Orissa. International Journal the unreported number of novel coronavirus (2019-nCoV)
 of Geology 2: 70-78. cases in China in the first half of January 2020: A data-driven
Muhammad Rezal Kamel Ariffin, Kathiresan Gopal, modelling analysis of the early outbreak. Journal of Clinical
 Isthrinayagy Krishnarajah, Iszuanie Syafidza Che Ilias, Medicine 9(2): 388-394.
 Mohd Bakri Adam, Noraishah Mohammad Sham, Jayanthi
 Arasan, Nur Haizum Abd Rahman & Nur Sumirah Mohd Shazlyn Milleana Shaharudin* & Muhamad Afdal Ahmad Basri
 Dom. 2020. Malaysian COVID-19 Outbreak Data Analysis Department of Mathematics
 and Prediction. Institute for Mathematical Research. http:// Faculty of Science and Mathematics
 einspem.upm.edu.my/covid19maths/file/Report_001%20 Universiti Pendidikan Sultan Idris
 v13.pdf. 35900 Tanjung Malim, Perak Darul Ridzuan
Nishiura, H., Kobayashi, T., Yang, Y., Hayashi, K., Miyama, T., Malaysia
 Kinoshita, R., Linton, N.M., Jung, S.M., Yuan, B., Suzuki, A.
 & Akhmetzhanov, A. 2020. The rate of under ascertainment of Shuhaida Ismail
 novel coronavirus (2019-nCoV) infection: Estimation using Data Analytics, Sciences & Modelling (DASM)
 Japanese passengers data on evacuation flights. Journal of Department of Mathematics and Statistics
 Clinical Medicine 9(2): 1-3. Faculty of Applied Sciences and Technology
Rodriguez-Aragon, L.J. & Zhiglkavsky, A. 2010. Singular Universiti Tun Hussein Onn Malaysia
 spectrum analysis for image processing. Statistics and Its 86400 Batu Pahat, Johor Darul Takzim
 Interface 3(3): 419-426. Malaysia
Samsudin, M.S., Khalit, S.I., Juahir, H., Nasir, M., Fahmi, M.,
 Kamarudin, M.K.A. & Lananan, F. 2017. Application of
1142

Mohd Saiful Samsudin Mou Leong Tan
Faculty Business and Entrepreneurship GeoInformatic Unit
Universiti Malaysia Kelantan Geography Section
Kampus Kota School of Humanities
Karung Berkunci 36 Pangkalan Chepa Universiti Sains Malaysia
16100 Kota Bharu, Kelantan Darul Naim 11800 Pulau Pinang
Malaysia Malaysia

Azman Azid *Corresponding author; email: shazlyn@fsmt.upsi.edu.my
Faculty of Bioresources and Food Industry
Universiti Sultan Zainal Abidin Received: 18 June 2020
Besut Campus Accepted: 8 September 2020
22200 Besut, Terengganu Darul Iman
Malaysia
You can also read