Probabilistic forecasts for water consumption in Sydney, Australia from stochastic weather scenarios and a panel data consumption model - UNSWorks
←
→
Page content transcription
If your browser does not render page correctly, please read the page content below
Probabilistic forecasts for water consumption in Sydney,
Australia from stochastic weather scenarios and a panel data
                     consumption model.
     Adrian Barker1∗         Andrew Pitman1     Jason Evans1                  Frank Spaninks2
                                  Luther Uthayakumaran2
1
    ARC Centre of Excellence for Climate Extremes and Climate Change Research Centre, UNSW,
                                        Sydney, Australia
     2
       Sydney Water, Level 14, 1 Smith Street, Parramatta, New South Wales, 2150, Australia

                                            27th June 2019

                                              Abstract
            Medium-term (1-10 year) probabilistic forecasts of urban water consumption can
        be useful in providing a range of possible outcomes for input into the budget and in-
        frastructure planning of a water utility. A stochastic weather generator is developed in
        this study to generate multiple weather scenarios spanning the financial years 2014/15
        to 2024/25 using a daily time step. These weather scenarios are then used as inputs
        to an existing panel data water consumption model. The resulting water demand
        forecasts form a probabilistic forecast of water consumption with an average range of
        7.3%. In addition, the weather scenarios are used to examine the weather sensitivity
        of forecast consumption. We demonstrate the importance of accurate simulation of
        interannual variability, intersite correlation and intervariable correlation of the sim-
        ulated weather variables in obtaining a realistic range of probabilistic consumption
        forecasts.

1       Introduction
The impact of population growth, economic development and changing weather and cli-
mate on water supply and demand presents an on-going challenge for water security in
cities (Wheater and Gober (2015); Gain et al (2016); Hoekstra et al (2018)). As water
demand increases, and as supply begins to be affected by regional patterns of climate
change, the need for better management of water resources also increases (Padula et al
(2013)). While changes in population is commonly considered the most important driver
of long-term water demand (Polebitski and Palmer (2010)), age and household size are
also important (Schleich and Hillenbrand (2009)) and water usage price and economic
growth also affect future demand (Tortajada and Joshi (2013); Romano et al (2016)).
    Changes in regional climate, and in climate variability, will affect future water demand.
Changes in average temperature and precipitation (Griffin and Chang (1991); Gato et al
(2007)), changes in seasonality, and changes in extremes such as heatwaves or drought
severity and length would have a major impact on water consumption (Meehl and Tebaldi
    ∗
    This work was supported by the Australian Research Council via the Centre of Excellence for Climate
Extremes (CE170100023) and partially funded by Sydney Water Corporation.

                                                   1
(2004); Manouseli et al (2018)). The relationship between climate and water demand has
been extensively studied and, not surprisingly, higher temperatures and lower rainfall lead
to increased water demand (Balling and Gober (2007); Praskievicz and Chang (2009);
Chang et al (2014)).
Forecasting of water demand is difficult because of the challenge in forecasting regional
and local scale changes in weather and climate. On very short time scales, up to a week,
weather prediction is increasingly skilful but it is not useful for infrastructure planning. On
timescales exceeding those of major modes of variability, for example more than a decade,
climate models are useful tools, particularly if downscaled for a specific region of interest
(e.g. Evans et al (2014)); while these timescales are useful for infrastructure planning they
are less useful for water pricing. Donkor et al (2014) classified approaches to modelling
water demand based on timescales of short term (less than 1 year), medium-term (1-10
years) and long-term (more than 10 years). In this paper, we focus on medium-term
forecasts because they contribute to pricing water and writing water utility budgets (see,
for example, IPART (2017)).
In developing water demand models for medium term forecasting, panel data models
are commonly used (see Arbues et al (2003); Worthington and Hoffman (2008); House-
Peters and Chang (2011); Donkor et al (2014)). Panel data consists of multiple obser-
vations of the same cross section of a population at different points in time (Wooldridge
(2010)). In water demand panel data models, the population consists of the consumers
and the observations are typically monthly, quarterly or annual. A panel data model is
normally used as a deterministic model (Haque et al (2014)) that produces a single fore-
cast at each forecast horizon for each set of explanatory variables, but typical explanatory
variables (population, weather, etc) may be stochastic in nature. A single forecast may
not adequately reflect the range of reasonable forecasts that would be obtained from al-
ternative realisations of these stochastic explanatory variables. By generating multiple
realisations of the stochastic explanatory variables, a probabilistic forecast of water con-
sumption can be generated (Khatri and Vairavamoorthy (2009); Almutaz et al (2012);
Haque et al (2014)). In addition to providing multiple realisations linked to population,
providing a large number of weather scenarios, consistent with historical observations,
provides additional value. The process of stochastic weather generation has been applied
in many areas including agriculture, ecology and hydrology (see Wilks and Wilby (1999);
Srikanthan and McMahon (2001); and Ailliot et al (2015)).
In an important contribution to water demand forecasting in Australia, Haque et al
(2014) used Monte Carlo simulations to forecast future water demand in the Blue Moun-
tains region (approximately 100 km west of Sydney). They generated multiple realisa-
tions of temperature and precipitation weather variables from a single weather station,
Katoomba, and other explanatory variables using a multivariate normal distribution. The
observed data used by Haque et al (2014) covered 1997-2011, during which four levels
of water restrictions were imposed due to a large-scale drought. A different forecast was
calculated for each level of water restriction, which enabled forecasts of possible future
water demand associated with climate change. One limitation of the Haque et al (2014)
study was that their approach ignored the on-going impact that water restrictions had
on consumption, after water restrictions were lifted. For example, Abrams et al (2012)
noted that households continue to maintain the water use levels established during drought
restrictions once the restrictions were lifted.
In this paper, we use a panel data model for Sydney, Australia. This model is based
on the approach developed by Abrams et al (2012) in their study of the price elasticity of
water demand in Sydney and was fitted using only data after the last water restrictions
2Table 1: List of residential dwelling types and the forecast total number of metered
dwellings in the Sydney Water region for the financial years 2014/15 and 2024/25. These
forecasts were made in November 2014.
Dwelling Type 2014/15 2024/25
Single Dwellings 1,051,698 1,153,229
Strata Units 431,072 560,656
Townhouse Units 102,962 131,408
Flats 114,283 114,283
Dual Occupancies 26,720 26,720
for the Sydney Region were lifted in June 2009. This model uses five explanatory weather
variables from twelve weather stations, one of which is the Katoomba weather station
used by Haque et al (2014). We then use our own stochastic weather generator to generate
multi-site realisations of the necessary weather variables and hold other model explanatory
variables fixed. In contrast to Haque et al (2014) our methods do not assume the weather
variables follow a multivariate normal distribution. We illustrate the importance of the
interannual variability, intersite correlation and intervariable correlation of the simulated
weather variables in obtaining a realistic range of probabilistic consumption forecasts.
In Section 2, the urban water consumption model used by this paper is briefly described
and we explain the methods used by the stochastic weather generator, including the tests
used to verify that the observed and simulated weather data have similar statistical prop-
erties. The results, together with an analysis of the model sensitivity to perturbations of
the weather scenarios, are presented in Section 3, followed by discussion and conclusions
in Section 4. The analysis presented in this paper is limited to metered residential and
non-residential demand, which represents about 90% of total demand.
2 Methodology
2.1 Sydney Water Consumption Model
The Sydney Water Consumption Model (SWCM) is a dynamic panel data model of urban
water consumption. A dynamic panel data model is one which includes past response
variables as explanatory variables (Wooldridge (2010)). Water consumption is divided
into residential and non-residential consumption. Residential consumption is categorised
by dwelling type (Table 1).
The SWCM model equation for a residential property is
ln Ci,t = α ln Ci,t−1 + βxi,t + ui,t (1)
where α, β are model parameters, Ci,t is the consumption at property i during quarter t,
xi,t is the vector of other explanatory variables and ui,t is the error term. Other explanatory
variables include: weather, water price and season.
Residential properties are grouped into 61 segments based on factors such as dwelling
type (Table 1), compliance with the Building Sustainability Index (BASIX) regulation,
participation in water efficiency programs and lot size. A panel data model of the form
described above is estimated for each one of the 61 segments. Consumption is forecast for
each residential property in the subset included in the model by applying the model for
the segment the property belongs to and a property-specific intercept. Forecast demands
3Table 2: List of weather variables used by the SWCM.
Abbreviation Description
PRE Average daily precipitation (mm)
GT2MM Number of days when precipitation exceeds 2mm
TMAX Average daily maximum temperature (◦ C)
GT30C Number of days when maximum temperature exceeds 30◦ C
EVAP Average daily pan evaporation
for the individual properties are then averaged by segment to obtain the forecast average
demand for each segment. These are multiplied by the forecast number of dwellings
for each segment to obtain total residential consumption. Dwelling forecasts are based on
forecasts by the New South Wales Department of Planning and the Environment, adjusted
to Sydney Waters area of operations.
The non-residential sector includes all property types not included in the residential
models. Non-residential properties were hierarchically segmented on the basis of consump-
tion levels, participation in water conservation programs and property types. The first
segment consists of the six highest water users (Top 6). The second consists of all prop-
erties that participated in Every Drop Counts (EDC), Sydney Waters water conservation
program for the non-residential sector. Finally, remaining properties were grouped into
six segments based on their property type classification. The resulting eight segments are:
Top 6 customers, EDC participants, industrial, commercial, government and institutional,
agricultural, non-residential strata units and standpipes.
A separate demand forecasting model was developed for each customer in the Top
6 segments based on historical average consumption with allowances for planned water
conservation activities. To forecast demand for the other segments average demand is as-
sumed constant at 2011/12 levels, the last full year for which data was available at the time
the non-residential models were built. To correct the observed demand in 2011/12 for the
impacts of above or below average weather conditions, a combined seasonal-decomposition
and time series regression model of average demand was estimated for each segment.
Forecast non-residential property numbers are based on average historical growth rates.
An important feature of the non-residential sector is that property growth in the last 15 to
20 years is very heavily concentrated in the segment of non-residential units (e.g. business
parks) and therefore forecast property growth is heavily skewed towards non-residential
units. The average consumption of this segment is much lower than the average demand of
the other segments. As a result, even though average demand in each segment is assumed
constant for forecasting purposes, overall average demand by non-residential properties is
forecast to decrease over time.
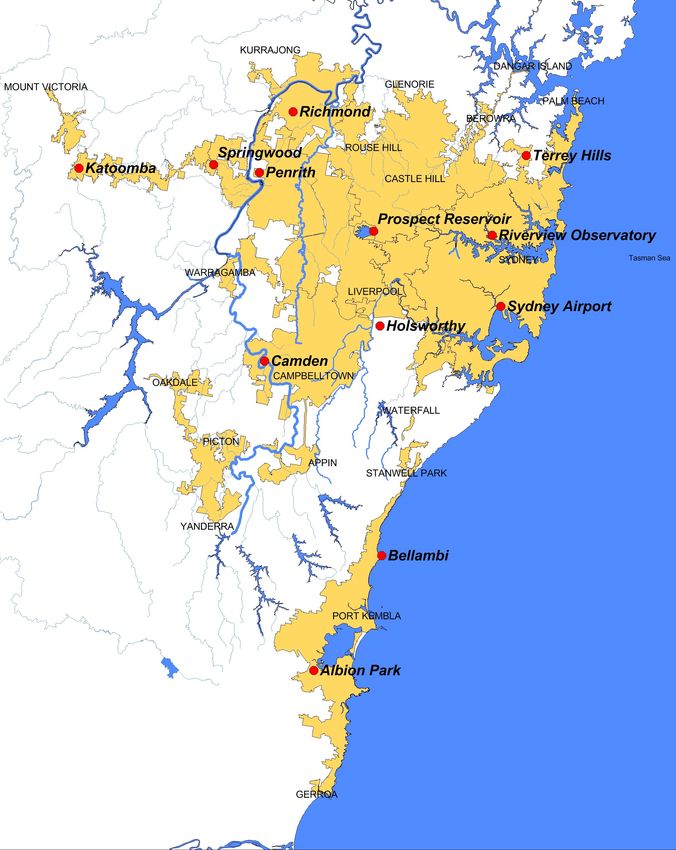
The weather variables used by the SWCM are listed in Table 2. The weather stations
used to provide weather variable data are listed in Table 3 and shown on a map in Figure
1. Weather variables are aggregated to quarterly variables when calculating residential
consumption and to monthly variables when calculating non-residential consumption. For
each of the weather variables, long-term averages are calculated over the 30-year period
1980-2010. Generally, weather variables are included in the SWCM as the difference
between the current value and the average during the period used to fit the models.
The model was fitted using data from 2010/11 to 2013/14. The last water restrictions
for the Sydney Region were lifted in June 2009 and while data exists prior to 2009, the
imposition of water restrictions changed water use habits in the Sydney Region (Abrams
4Table 3: Weather data provided by weather stations for the SWCM. Figure 1 shows the
geographical location of these stations. The acronyms are defined in Table 2.
Station Name Station Id PRE GT2MM TMAX GT30C EVAP
Albion Park 68241 Y Y Y Y N
Bellambi 68228 Y Y Y Y N
Camden 68192 Y Y Y Y N
Holsworthy 66161/67117 Y Y Y Y N
Katoomba 63039 Y Y Y Y N
Penrith 67113 Y Y Y Y N
Prospect 67019 Y Y Y Y Y
Richmond 67105/67021 Y Y Y Y Y
Riverview 66131 Y N Y N Y
Springwood 63077 Y Y Y Y N
Sydney Airport 66037 Y Y Y Y Y
Terrey Hills 66059 Y Y Y Y N
Figure 1: Area serviced with water by Sydney Water (orange) and location of the weather
stations (red) used by the SWCM, (see also Table 3).
5et al (2012)) and are not suitable for model fitting.
To begin, we evaluate SWCM forecasts with actual consumption for the financial years
2011/12 to 2015/16 to examine how the forecasts change with actual weather. Following
Equation (1), forecasts of the next quarters consumption require information about the
previous quarters consumption, ln Ci,t−1 . When calculating consumption forecasts, we
need to use forecast consumption rather than actual consumption for ln Ci,t−1 . Since this
can obscure sensitivities to weather, and given that we have actual consumption data up
to 2015/16, we use actual consumption as data for the ln Ci,t−1 explanatory variable.
Average annual single dwelling consumption is shown in Figure 2. Single dwelling
consumption is used rather than total consumption, as consumption at single dwellings
tends to be more sensitive to the weather than consumption at other property types.
Average consumption is used rather than total consumption to remove the impact of
population changes. Whilst the forecast consumption is generally very close to the actual
consumption, the forecast consumption tends to be higher than actual consumption when
actual consumption is low and tends to be lower than actual consumption when actual
consumption is high (Figure 2a). In addition, the forecast error tends to be positive
when maximum temperatures are low and negative when maximum temperatures are
high (Figure 2b). In summary, and with the caveat that this is based on only five financial
years of data, forecasts by the SWCM do match the observed consumption well in general,
while tending to underestimate the impact of weather on water consumption.
2.2 Stochastic weather generation
Weather scenarios for the SWCM need to contain monthly and quarterly sequences of
precipitation, number of days greater than 2mm, maximum temperature, number days
greater than 30◦ C and evaporation at the weather stations listed in Table 3. Initially, daily
sequences of precipitation, maximum temperature and evaporation are generated, from
which monthly and quarterly sequences of number of days greater than 2mm and number
of days greater than 30◦ C are calculated. Daily sequences of precipitation, maximum
temperature and evaporation are also aggregated into monthly and quarterly sequences.
Following Richardson (1981), precipitation is our primary variable; we then condition
maximum temperature on precipitation and finally condition evaporation on precipitation
and maximum temperature.
The precipitation and maximum temperature data used to fit the stochastic weather
models was the Australian Water Availability Project (AWAP) gridded data set (Jones
et al (2009)). AWAP provides precipitation and temperature data on a 0.05◦ × 0.05◦ (ap-
proximately 5km) grid across Australia for 1910-2016. The gridded AWAP data contains
no missing values but does have some loss of precision relative to the Bureau of Meteorol-
ogy (BOM) station data (Contractor et al (2015)), however this is mitigated in the Sydney
Region due to high weather station density. We used AWAP data from the nearest grid
point to the BOM weather stations in Table 3 over the period 1960-2015. Earlier AWAP
data were not used due to the relative scarcity of stations in the Sydney Region prior to
1960 (Jones et al (2009)). The evaporation data used to fit the stochastic weather mod-
els was obtained from BOM at each weather station over the period 2001-2010 for daily
data and 2005-2014 for yearly data. Daily evaporation data for which the quality was not
confirmed or which was accumulated over more than one day was not used.
6240
Actual Forecast
230
Consumption Forecast (KL)
220
210
200
11/12 12/13 13/14 14/15 15/16
Financial Year
(a)
25
3
Forecast Error
2
Consumption Forecast Error (KL)
24
1
Maximum Temperature
0
23
−2 −1
22
−3 −4
21
11/12 12/13 13/14 14/15 15/16
Financial Year
(b)
Figure 2: Average annual single dwelling consumption for financial years 2011/12 to
2015/16: (a) actual consumption and the forecast consumption (b) forecast error and
average of mean annual maximum temperatures across the weather stations listed in Ta-
ble 3.
7Table 4: Annual statistics for precipitation (mm) from AWAP (1960-2015) and weather
scenarios.
AWAP (1960-2015) Weather Scenarios
Site Mean SD Min Max Mean SD Min Max
Albion Park 1,206 347 574 1,996 1,223 306 340 2,336
Bellambi 1,159 321 550 2,044 1,167 282 411 2,088
Camden 735 205 381 1,329 742 187 218 1,455
Holsworthy 939 239 536 1,614 933 239 255 1,784
Katoomba 1,237 295 687 2,024 1,196 269 407 2,105
Penrith 826 211 457 1,409 818 198 245 1,525
Prospect 890 235 484 1,510 878 219 251 1,633
Richmond 832 211 455 1,386 825 197 254 1,505
Riverview 1,106 279 580 1,824 1,102 265 329 2,102
Springwood 977 249 541 1,681 969 236 267 1,751
Sydney Airport 1,110 274 557 1,930 1,108 270 359 2,108
Terrey Hills 1,226 295 717 1,967 1,222 284 320 2,391
2.3 Stochastic weather generation: the precipitation model
The daily precipitation model is a variation of the commonly used combination of occur-
rence and intensity models (Katz (1977)). In Katz (1977), occurrence is a binary variable
which indicates whether the day is wet or dry, i.e. whether precipitation exceeds some
small threshold, and intensity is the amount of precipitation which occurs on a wet day.
Technical details of the precipitation model are provided in Appendix A.
One hundred precipitation weather scenarios each spanning the range 2010 - 2025 were
generated for each weather station (Table 3). Annual statistics from the AWAP data and
the weather scenarios for PRE and GT2MM weather variables are provided in Tables 4
and 5. The standard deviation of the weather scenario value of PRE weather variable
is about 7% less than the standard deviation of the AWAP value. All other weather
scenario statistics for PRE and GT2MM weather variables are consistent with the AWAP
statistics. Note that all weather scenario minimums/maximums are less/greater than the
corresponding AWAP minimums/maximums. This is to be expected since the weather
scenarios statistics are calculated from a total of 16*100 =1600 years of data, whereas the
AWAP statistics are calculated from a total of 56 years of data.
Figure 3 contains histograms and Q-Q plots of the simulated and observed daily max-
imum temperature and daily log precipitation on wet days from the Prospect and Sydney
Airport weather stations. Figure 3 confirms that the simulated and observed data have
very similar distributions. For the daily log precipitation, the differences at low precipita-
tion is due to the fact that the observed data is recorded as a multiple of 0.1mm whereas
the simulated data is continuous down to 0.05mm. Figure 4 shows the range in the yearly
averages of each of the simulated weather variables from the Prospect and Sydney Air-
port weather stations (2010-2025) with the observed yearly averages over 2010-2015. The
yearly average of the observed weather variable lies within the range of the yearly averages
of the simulated weather variable.
8120
120
5
100
100
4
3
80
80
Frequency
Frequency
Simulation
2
60
60
1
40
40
0
20
20
−1
−2
0
0
−2 0 1 2 3 4 5 −2 0 1 2 3 4 5 −2 0 1 2 3 4 5
(a) Log precipitation on days > 0.15mm (Prospect)
120
120
5
100
100
4
3
80
80
Frequency
Frequency
Simulation
2
60
60
1
40
40
0
20
20
−1
−2
0
0
−2 0 1 2 3 4 5 −2 0 1 2 3 4 5 −2 0 1 2 3 4 5
(b) Log precipitation on days > 0.15mm (Sydney Airport)
300
50
100 150 200 250 300
250
40
200
Frequency
Frequency
Simulation
150
30
100
20
50
50
10
0
0
10 20 30 40 50 10 20 30 40 50 10 20 30 40 50
(c) Maximum temperature (Prospect)
50
300
300
40
Frequency
Frequency
Simulation
200
200
30
50 100
50 100
20
10
0
0
10 20 30 40 50 10 20 30 40 50 10 20 30 40 50
(d) Maximum temperature (Sydney Airport)
Figure 3: Histograms and Q-Q plots of daily maximum temperature and daily log precipi-
tation on days with precipitation > 0.15mm at Prospect and Sydney Airport from weather
scenario 1 and AWAP for the period 2010-2015. The use of the threshold, 0.15mm, is to
avoid a distortion of the histograms at low precipitation levels due to the discrete nature
of AWAP precipitation values.
9Prospect Sydney Airport
2000
1500
1500
PRE
PRE
1000
1000
500
500
2010 2013 2016 2019 2022 2025 2010 2013 2016 2019 2022 2025
(a) (b)
140
120
Prospect Sydney Airport
120
100
100
GT2MM
GT2MM
80
80
60
60
40
40
2010 2013 2016 2019 2022 2025 2010 2013 2016 2019 2022 2025
(c) 25.0
(d)
Prospect Sydney Airport
24.5
25
24.0
23.5
TMAX
TMAX
24
23.0
22.5
23
22.0
22
21.5
2010 2013 2016 2019 2022 2025 2010 2013 2016 2019 2022 2025
(e) (f)
60
Prospect Sydney Airport
80
50
70
40
60
GT30C
GT30C
50
30
40
20
30
20
2010 2013 2016 2019 2022 2025 2010 2013 2016 2019 2022 2025
(g) (h)
6.0
4.0
Prospect Sydney Airport
3.8
3.6
5.5
3.4
EVAP
EVAP
3.2
5.0
3.0
2.8
4.5
2.6
2010 2013 2016 2019 2022 2025 2010 2013 2016 2019 2022 2025
(i) (j)
Figure 4: Range of yearly weather scenarios (filled region) and yearly AWAP/BoM values
(black) at Prospect (blue) and Sydney Airport (red) for (a), (b) Precipitation (PRE), (c),
(d) Number of days when precipitation greater than 2mm (GT2MM), (e), (f) Maximum
temperature (TMAX), (g), (h) Number of days when maximum temperature greater than
30◦ C (GT30C) and (i), (j) Evaporation (EVAP). AWAP/BoM values are calculated for
calendar years, simulation values are calculated for financial years.
10Table 5: Annual statistics for number of days when precipitation was greater than 2mm
from AWAP (1960-2015) and weather scenarios.
AWAP (1960-2015) Weather Scenarios
Site Mean SD Min Max Mean SD Min Max
Albion Park 81 15 53 113 81 15 36 127
Bellambi 81 14 54 111 81 14 39 124
Camden 62 13 34 85 62 13 24 109
Holsworthy 73 14 47 105 73 14 32 118
Katoomba 94 16 62 126 94 15 50 150
Penrith 67 13 41 93 67 13 28 114
Prospect 69 13 43 97 69 13 30 113
Richmond 68 13 42 96 68 13 31 110
Riverview 81 14 51 110 80 14 31 136
Springwood 75 14 47 102 75 14 30 135
Sydney Airport 82 15 52 115 82 15 35 129
Terrey Hills 87 15 56 119 87 14 37 136
2.4 Stochastic weather generation: the maximum temperature model
To model TMAX we use a Generalized Additive Model of Location, Scale and Shape
(GAMLSS, see Stasinopoulos et al (2017)). GAMLSS models are an extension of Gen-
eralized Additive Models (GAM, see Wood (2017)) which, in turn, are an extension of
Generalized Linear Models (GLM, see McCullagh and Nelder (1989); Dobson (2001)).
For examples of their use in stochastic weather generation, see Katz and Parlange (1995)
or Furrer and Katz (2007). Technical details of the TMAX model are provided in Appendix
B.
One hundred TMAX weather scenarios each spanning the range 2010 - 2025 were
generated for each of the 12 weather stations in Table 3. Annual statistics from the AWAP
data and the weather scenarios for TMAX and GT30C weather variables are presented in
Tables 6 and 7 respectively. The mean weather scenario value for TMAX is approx. 0.5◦ C
higher than the mean AWAP value and the mean weather scenario value for the GT30C
weather variable is approx. 5 days more than the mean AWAP value. The standard
deviations of the weather scenario TMAX and GT30C weather variables is slightly less
than the AWAP standard deviations. The reason for these differences is the presence of
a positive trend in the AWAP and weather scenario maximum temperatures. The middle
of weather scenario year range, 2017, is 30 years later than the middle of the AWAP year
range, 1987. This is consistent with the higher means for the weather scenario TMAX and
GT30C weather variables. The length of weather scenario year range, 16 years, is 40 years
shorter than the length of the AWAP year range, 56 years. This is consistent with the
lower standard deviations for the weather scenario TMAX and GT30C weather variables.
2.5 Stochastic weather generation: the evaporation model
To model daily evaporation, we use a GAMLSS model. Technical details of the precipita-
tion model are provided in Appendix C.
One hundred evaporation weather scenarios, each spanning the range 2010 - 2025 were
generated for each weather station (Table 3) with evaporation data. Annual statistics
from the BoM data and the weather scenarios for the EVAP weather variable (Table 8)
11Table 6: Annual statistics for maximum temperature from AWAP (1960-2015) and weather
scenarios.
AWAP (1960-2015) Weather Scenarios
Site Mean SD Min Max Mean SD Min Max
Albion Park 21.98 0.48 21.09 23.14 22.28 0.44 20.87 23.92
Bellambi 22.00 0.48 21.12 23.09 22.36 0.43 21.03 24.00
Camden 23.53 0.57 22.52 24.70 24.01 0.49 22.38 25.75
Holsworthy 22.60 0.53 21.67 23.70 23.10 0.46 21.60 24.79
Katoomba 17.23 0.70 16.06 18.58 17.90 0.60 15.88 20.16
Penrith 23.89 0.62 22.85 25.14 24.41 0.53 22.68 26.40
Prospect 23.17 0.56 22.20 24.34 23.63 0.49 22.02 25.46
Richmond 24.02 0.61 23.01 25.27 24.54 0.52 22.97 26.55
Riverview 22.73 0.52 21.86 23.83 23.27 0.45 21.80 24.81
Springwood 22.82 0.64 21.75 24.10 23.38 0.55 21.53 25.39
Sydney Airport 22.43 0.51 21.57 23.50 22.96 0.45 21.59 24.57
Terrey Hills 22.54 0.52 21.70 23.66 23.04 0.45 21.69 24.67
Table 7: Annual statistics for number of days when maximum temperature was greater
than 30◦ C from AWAP (1960-2015) and weather scenarios.
AWAP (1960-2015) Weather Scenarios
Site Mean SD Min Max Mean SD Min Max
Albion Park 18 8 3 35 20 5 6 39
Bellambi 18 7 6 37 21 5 6 38
Camden 47 12 17 69 53 9 25 87
Holsworthy 31 9 11 54 36 7 14 62
Katoomba 9 6 0 30 11 4 1 26
Penrith 55 13 22 80 62 10 32 113
Prospect 41 11 14 64 46 8 21 81
Richmond 55 13 25 79 62 10 32 117
Riverview 28 9 8 49 34 7 16 58
Springwood 44 13 13 70 51 9 26 91
Sydney Airport 26 9 7 44 30 6 12 54
Terrey Hills 27 9 7 45 31 7 14 55
12Table 8: Annual statistics for pan evaporation from BoM (2005-2014) and weather sce-
narios.
BoM (2005-2014) Weather Scenarios
Site Mean SD Min Max Mean SD Min Max
Prospect 3.29 0.20 2.90 3.52 3.22 0.20 2.61 3.87
Richmond 3.46 0.28 3.10 3.83 3.44 0.23 2.80 4.24
Riverview 3.89 0.19 3.65 4.14 3.89 0.18 3.36 4.53
Sydney Airport 5.14 0.21 4.92 5.55 5.18 0.21 4.46 5.81
Table 9: Average intersite correlation of annual weather variables.
Data Source PRE GT2MM TMAX GT30C EVAP
AWAP (1960-2015) 0.892 0.887 0.979 0.889 -
BoM (2005-2014) - - - - 0.629
Weather Scenarios 0.890 0.892 0.938 0.753 0.564
shows that the mean and standard deviation of the EVAP weather variable from the BoM
data and the weather scenarios are reasonably close for each site.
2.6 Stochastic weather generation: intersite and intervariable correla-
tion
The weather scenario statistical properties of each weather variable at each site is largely
consistent the statistical properties of the historical data. However, it is also necessary to
verify that weather scenario intersite and intervariable correlations are consistent with the
historical data. In the historical data, the intersite correlation of TMAX is very high (when
it is a hot day at one site, it is very likely to be hot at all nearby sites). Precipitation is
similar although the intersite correlation of precipitation is typically less than for TMAX.
In the historical data there is also a correlation between the weather variables at the same
site. For example TMAX on a wet day is likely to be lower than TMAX on a dry day.
The average intersite correlation of annual totals for each weather variable for both the
weather scenarios and the historical data is listed in Table 9. For each weather variable
the weather scenario average intersite correlation is slightly less than the historical average
intersite correlation.
The average intervariable correlation of annual totals of weather variables for both the
weather scenarios and the historical data is listed in Table 10. The weather scenario and
historical average intervariable correlation values are reasonable for most pairs of weather
variables. The biggest discrepancy is for the intervariable correlation of EVAP and PRE.
This may be due to the smaller number of sites which provide evaporation data and the
shorter period for which it is provided in comparison with precipitation and maximum
temperature data.
Note that the intersite correlation, intervariable correlation, interannual variation, etc
of AWAP data is likely to differ to at least some extent from station observations. Thus,
even if the weather scenarios do have the same statistical properties as the AWAP data,
they are still likely to be an imperfect representation of the real world.
In this section, we have presented a methodology for the generation of weather sce-
narios, which have similar statistical properties to the observations. Each of the weather
13Table 10: Average intervariable correlation of annual weather variables.
AWAP, BoM PRE GT2MM TMAX GT30C EVAP
PRE 1.000 0.804 -0.509 -0.413 -0.244
GT2MM 0.804 1.000 -0.579 -0.487 -0.603
TMAX -0.509 -0.579 1.000 0.800 0.781
GT30C -0.413 -0.487 0.800 1.000 0.629
EVAP -0.244 -0.603 0.781 0.629 1.000
Weather Scenarios PRE GT2MM TMAX GT30C EVAP
PRE 1.000 0.848 -0.519 -0.402 -0.476
GT2MM 0.848 1.000 -0.624 -0.480 -0.587
TMAX -0.519 -0.624 1.000 0.708 0.754
GT30C -0.402 -0.480 0.708 1.000 0.564
EVAP -0.476 -0.587 0.754 0.564 1.000
scenarios contains values for the five weather variables needed by the SWCM. In the fol-
lowing section, we run the SWCM for each of the weather scenarios and examine the
resulting consumption forecasts.
3 Results
3.1 Scenario consumption forecasts
The SWCM was run on each of the 100 weather scenarios and total metered consumption
forecast calculated for the financial years 2014/15 to 2024/25. Consumption forecasts
for the financial years 2010/11 to 2013/14 are set to actual consumption. The total
consumption for the financial years 2014/15 to 2024/25 is shown in Figure 5. This shows
consumption increases over the time period examined from median of 456GL in 2014/15
to 508GL in 2024/25 caused largely by population increases. Figure 5 also shows that
the weather-induced spread of the distribution each financial year is similar but the range
does vary from 6.0% to 8.8% (see Table 11). The total consumption from each weather
scenario in the 2018/19 financial year is shown in Figure 6. Descriptive statistics of the
consumption forecasts are presented in Table 11.
Figure 6 highlights the magnitude of variation between the weather scenarios in one
financial year (2018/19). The consumption forecast varies from 461GL to 497GL (7.4%).
We define the range of consumption forecasts for a given financial year to be the percentage
Range = 100% ∗ (Maximum − Minimum) /Median. (2)
The average range of total consumption forecasts for each financial year is 7.3%. In general,
years for which there are high consumption forecasts are hotter and dryer than years for
which there are low consumption forecasts. More specifically, years for which there are
high consumption forecasts tend to have high TMAX and EVAP in the hotter quarters
Q2 (October, November, December) and Q3 (January, February, March). The weather
in the colder quarters Q1 (July, August, September) and Q4 (April, May, June) has less
effect on consumption forecasts.
The forecast range as defined in (2) is a useful measure of dispersion for water utilities
as it summarises the difference between best and worst case scenarios, but it is not very
14530
520
510
Total Consumption Forecast (GL)
500
490
480
470
460
450
440
430
14/15 15/16 16/17 17/18 18/19 19/20 20/21 21/22 22/23 23/24 24/25
Financial Year
Figure 5: Box plot of total consumption forecasts from 100 weather scenarios for financial
years 2014/15 to 2024/25. For each year, the median forecast is represented by a red line,
the blue box covers the 25th to 75th percentile, the black whiskers cover all data within 1.5
times the interquartile range of the 25th and 75th percentiles and the red crosses represent
outliers.
500
Max = 497
495
490
Total Consumption Forecast (GL)
485
480 Med = 479
475
470
465
Min = 461
460
455
450
0 10 20 30 40 50 60 70 80 90 100
Scenario No.
Figure 6: Bar chart of total consumption forecasts from 100 weather scenarios for the
2018/19 financial year. The levels of the minimum, median and maximum forecasts are
highlighted by the dashed blue lines.
15Table 11: The minimum, median, maximum and range of consumption forecasts (GL) from
100 weather scenarios for the financial years 2014/15 to 2024/25. The range is calculated
from (maximum - minimum)/median as a percentage.
Minimum Median Maximum Range
2014/15 440 456 476 8.1%
2015/16 448 461 475 6.0%
2016/17 453 470 486 7.0%
2017/18 458 475 491 7.0%
2018/19 461 479 497 7.4%
2019/20 469 484 504 7.2%
2020/21 474 488 516 8.6%
2021/22 480 494 512 6.5%
2022/23 482 501 526 8.8%
2023/24 489 505 526 7.3%
2024/25 489 508 522 6.5%
Mean 468 484 503 7.3%
precise. The precision of the forecast range can be examined through the well-known
properties of order statistics (see David and Nagaraja (2003)). If we arrange the elements
of the sample {Xi }ni=1 , in order as X(1|n) , . . . , X(n|n) , then we call X(j|n) the j th order
statistic. Define
W(n) = X(n|n) − X(1|n) (3)
to be the difference between the maximum and minimum of {Xi }ni=1 . If {Xi }ni=1 is an
independent, identically distributed sample drawn from a symmetric distribution F , then
the mean and variance of W(n) is given by
E [Wn ] = 2µ(n|n) (4)
V [Wn ] = 2 σ(n,n|n) − σ(1,n|n) (5)
where µ(n|n) is the expected value of X(n|n) and σ(i,j|n) is the covariance of X(i|n) and
X(j|n) (David and Nagaraja (2003)). Using the formulae for µ(n|n) and σ(i,j|n) in Parrish
(1992a) and Parrish (1992b), we evaluated the following numerical values for (4) and (5)
where n = 100 and F is the standard normal distribution.
E [W100 ] = 5.0152 (6)
V [W100 ] = 0.3662 (7)
Assuming that the consumption forecasts are normally distributed and that the me-
dian is known, we calculate the value of the standard error of the forecast range to be
between 0.8% and 1.0% for each financial year. The consumption forecasts are not nor-
mally distributed, there is a slight positive skewness. Nevertheless, a standard error of
say, 0.9%, suggests that a difference of 2.8% between the minimum range estimate 6.0%
in 2015/16 and the maximum range estimate of 8.8% in 2022/23 is not unreasonable and
an indication of the precision to be expected in the forecast range.
163.2 Sensitivity of the forecast consumption mean to the weather variable
changes
The sensitivity of water consumption to changes in the weather is of interest to water
authorities (in Phoenix, Arizona (Balling and Gober (2007)), in Seoul, Korea (Praskievicz
and Chang (2009)) and Portland, Oregon (Breyer and Chang (2014)). Each of these
studies was derived from observed water consumption and needed to balance the non-
stationarity of consumer behaviour with the need for sufficient data from which to draw
inferences. The use of weather scenarios, and the associated consumption forecasts, instead
of observational data in this analysis helps to mitigate those issues.
The sensitivity of the forecast consumption mean to changes in the weather variables
is estimated through a linear regression over all the weather scenarios for each financial
year. Plots of total consumption against each of the weather variables for 2018/19 are
shown in Figure 7 together with the linear regression. Each of the other financial years
exhibit similar characteristics. The precipitation variables PRE and GT2 have a strong
negative correlation with forecast total consumption, whilst the temperature and evapo-
ration variables, TMAX, GT30 and EVAP have a strong positive correlation with forecast
total consumption.
To illustrate the sensitivity of consumption to changes in weather variables we find from
the linear regressions in Figure 7 that a 10GL increase in forecast consumption for the
2018/19 financial year would occur with either a 420mm decrease in annual precipitation
or a 21 day decrease in the number of days with greater than 2mm precipitation or a 0.8◦ C
increase in maximum temperature or a 12 day increase in the number of days with greater
than 30◦ C maximum temperature or a 0.3mm increase in evaporation. These sensitivity
estimates are illustrative and while a formal framework could be developed to quantify
the sensitivity, these provide a guide to the relative impact of each weather variable on
consumption.
3.3 Sensitivity of the forecast consumption range to weather variable
changes
To examine the sensitivity of forecast consumption range to interannual variability, we
perturb the statistical properties of the weather scenarios. For each weather variable, we
use the standard deviation of annual totals as the measure of interannual variability (see
Tables 4, 5, 6, 7, 8). Perturbing the standard deviation of the PRE weather variable causes
perturbations to both the mean and standard deviation of GT2MM weather variable.
An increase in the standard deviation of PRE, decreases the mean and increases the
standard deviation of GT2MM, for all weather stations. Similarly, perturbing the standard
deviation of the TMAX weather variable causes perturbations to both the mean and
standard deviation of the GT30C weather variable. An increase in the standard deviation
of TMAX, increases the mean and increases the standard deviation of GT30C, for all
weather stations.
The size of the perturbations to PRE, TMAX and EVAP standard deviations is de-
noted by KSD for each weather variable. In each case, the perturbation factor KSD
represents multiplicative change. The standard deviation perturbed is the standard devi-
ation of the annual totals for each weather variable. Perturbation of the weather scenario
standard deviations affects the range of total consumption forecasts, but has little effect
on the median consumption forecasts, (Table 12). In each case, increasing the standard
deviation of the weather variable increases the range of total consumption forecasts.
Next we examine the effect of changes to the intersite correlations on the range of
17460 465 470 475 480 485 490 495
460 465 470 475 480 485 490 495
Consumption (GL)
Consumption (GL)
600 800 1000 1200 1400 50 60 70 80 90 100
Precipitation (mm) No. days greater than 2mm
(a) (b)
460 465 470 475 480 485 490 495
460 465 470 475 480 485 490 495
Consumption (GL)
Consumption (GL)
22.0 22.5 23.0 23.5 24.0 25 30 35 40 45 50 55
Temperature (C) No. days greater than 30C
(c) (d)
460 465 470 475 480 485 490 495
Consumption (GL)
3.6 3.8 4.0 4.2
Evaporation (mm)
(e)
Figure 7: Linear regression of total consumption to each of the weather variables for the
financial year 2018/19.
18Table 12: Range and median of total consumption forecasts from weather scenarios with
perturbed standard deviation, KSD .
KSD
Range 0.6 0.8 1.0 1.2 1.5
Precipitation 6.5% 6.9% 7.3% 7.7% 8.5%
Temperature 6.6% 6.9% 7.3% 7.7% 8.4%
Evaporation 6.5% 6.9% 7.3% 7.7% 8.3%
All Weather Variables 5.1% 6.1% 7.3% 8.6% 10.6%
KSD
Median (GL) 0.6 0.8 1.0 1.2 1.5
Precipitation 483.8 483.8 483.8 483.9 484.0
Temperature 483.7 483.8 483.8 483.9 483.9
Evaporation 483.8 483.8 483.8 483.9 483.9
All Weather Variables 483.7 483.7 483.8 483.9 484.0
Table 13: Effect of changes to the intersite correlation on the range of consumption fore-
casts. Scenarios: (a) Original set of scenarios, (b-d) Set of scenarios with moderately
reduced intersite correlation for all weather variables (e) Set of scenarios with precipita-
tion intersite correlations set to zero, (f) Set of scenarios with all intersite correlations set
to zero.
Average Intersite Correlation
Scenarios PRE GT2MM TMAX GT30C EVAP Range
(a) 0.890 0.892 0.938 0.753 0.564 7.3%
(b) 0.852 0.788 0.896 0.730 0.544 7.1%
(c) 0.806 0.684 0.855 0.701 0.525 6.9%
(d) 0.730 0.580 0.815 0.671 0.492 6.4%
(e) -0.001 0.002 0.589 0.490 0.268 4.1%
(f) -0.001 0.002 0.028 0.017 0.039 2.8%
consumption forecasts. We do not consider changes to the intervariable correlations. In-
tuitively, higher absolute values for the intersite and intervariable correlations should result
in higher consumption forecast ranges.
Due to the nature of the simulation software it is not straightforward to make changes
to individual intersite or intervariable correlations whilst leaving the other correlations
unchanged. Instead, we produce a few different sets of scenarios with changes to the
intersite correlations and compare range of consumption forecasts. The sensitivity of the
consumption forecast range to the intersite correlation of weather variables is demonstated
in the results in Table 13. If the intersite correlation between the all the weather variables
is reduced to zero, then the forecast consumption range is reduced from 7.3% to 2.8%. Note
that a reduction in the simulation intersite correlations tends to cause a minor reduction
in the simulation interannual variability and intervariable correlations.
194 Conclusion
A stochastic weather generator was developed to generate multiple weather scenarios for
use as inputs into an urban water consumption model for the Sydney region. Each weather
scenario contains five weather variables, which are functions of precipitation maximum
temperature and pan evaporation from 12 weather stations. The forecasts generated from
these scenarios form a probabilistic forecast of water consumption. The average range
of total consumption forecasts was 7.3%. These probabilistic forecasts account only for
changes in the weather and not for changes in customer behaviour, technology, price, etc.
The availability of multiple weather scenarios provides opportunities to examine the
sensitivity of water consumption to changes in the weather variables, which are not always
possible using observed data. The sensitivity of the model forecast mean and range to
changes in the input weather variables was examined. Increasing the interannual variability
of the weather variables by a factor of 1.5 was found to increase the average range of total
consumption forecasts to 10.6%.
Probabilistic forecasts of water consumption provide useful information for water utili-
ties. We therefore recommend that incorporating probabilistic methods in water consump-
tion prediction is examined as it is relatively straightforward to do, and offers benefits
including information on the possible range of water consumption.
The range of water consumption forecasts is sensitive to interannual variability and in-
tersite correlation of the simulated weather variables. We therefore recommend that these
be carefully considered in forecasting, and that the statistical relationships are properly
incorporated when designing or choosing a stochastic weather generator.
Finally, we have shown that using weather variables which indicate dispersion such as
number of days when precipitation exceeds 2mm (GT2MM) and the number of days when
maximum temperature exceeds 30◦ C (GT30C) are useful predictors of water consumption.
This points to value in carefully examining how more extreme values in weather variables
affects water consumption forecasts, particularly given climate projections that point to
changes in these sorts of extremes in the future.
A Technical details of the precipitation stochastic weather
generator
Stochastic weather generators of precipitation are commonly constructed as the combina-
tion of an occurence model to determine whether a day is ”wet” or ”dry” and a intensity
model to determine the amount of precipitation on a ”wet” day, (see for example Katz
(1977)). Typically, a two-state first order Markov chain is used for the occurrence model,
and an exponential, gamma or Weibull distribution is used for the intensity model. For
this paper, the need to model accurately the number of days with greater than 2mm pre-
cipitation (GT2MM), led to the choice of a three-state first order Markov chain for the
occurrence model, with state thresholds at 0mm and 2mm.
An individual daily occurrence model is fitted for each site and each month (144
models). The fitted model consists of an 3×3 transition probability matrix. The transition
probability from occurrence state i to occurrence state j is the conditional probability
P {Od = j|Od−1 = i} , (8)
where Od is the occurrence state on day d. The occurrence state on day d is 0 if the
precipitation on day d is zero, is 1 if the daily precipitation is between 0mm and 2mm and
2 if the daily precipitation is greater than 2mm.
20As with the daily occurrence model, an intensity distribution was estimated for each
site and each month, (144 distributions). A choice was made from the same set of dis-
tributions used in Suhaila and Jemain (2007), i.e. the exponential, gamma, Weibull and
their associated mixture distributions. In each case maximum likelihood estimation was
used. Two different measures for goodness of fit were used to compare the distributions.
The first goodness of fit measure is the integral of the absolute value of difference between
the fitted quantile function and the empirical quantile function,
Z 1
Z1 = b fit (p) − Q
Q b emp (p) dp (9)
0
where Q
b fit (p) is the fitted quantile function and Q b emp (p) is the empirical quantile function.
The second goodness of fit measure is the integral of the absolute value of difference
between the logs of the fitted quantile function and the empirical quantile function,
Z 1
Z2 = ln Q b fit (p) − ln Qb emp (p) dp. (10)
0
The Z1 goodness of fit measure tends to assess the fit with more emphasis on high
quantiles, whereas Z2 more evenly assesses the fit across the entire distribution. For Z1 ,
the mixed Weibull distribution was the best fit for 92 of the site/month pairs, the mixed
gamma for 10 and the Weibull for 42. For Z2 , the mixed Weibull distribution was the best
fit for 131 of the site/month pairs and the mixed gamma for 13. When the mixed Weibull
distribution was not the best fit it was second best on 56 occasions and third best on 9.
These results are largely in agreement with those reported in Suhaila and Jemain (2007).
Thus, rather than use different distributions for different site/month pairs it was decided
to use the mixed Weibull distribution to model daily intensity for all site/month pairs.
The density function for a mixed Weibull distribution is given by
α1 α2
α1 x α2 x
f (x; ω, α1 , β1 , α2 , β2 ) = ω exp − + (1 − ω) exp − (11)
β1 β1 β2 β2
where ω ∈ [0, 1] is the mixture parameter, α1 , α2 > 0 are the shape parameters and
β1 , β2 > 0 are the scale parameters.
A common problem in stochastic weather generation is the presence of a negative bias
in interannual variability (Gregory et al (1993); Wilks (1999); Kysely and Dubrovsky
(2005)). The use of higher-order, multi-state Markov chains has been proposed as a
method to reduce the negative bias in interannual variability (Gregory et al (1993)), how-
ever the consequent increase in the number of model parameters can result in model-fitting
problems for small data sets. For this paper, we use an alternative method, where low fre-
quency models (yearly) for the same weather variable are coupled with the high frequency
(daily) models (Wang and Nathan (2007)).
The low frequency occurrence model chosen is an autoregressive (AR) model (Brockwell
and Davis (1991)),
GT2MMy,s = µs + φs GT2MMy−1,s + ey,s (12)
where GT2MMy,s is the number of days with precipitation greater than 2mm in year y at
2
site s, {ey,s } is a sequence of iid Gaussian random variables with distribution N 0, σe,s
and µs , φs are model parameters. The observed distribution of the yearly GT2MM for
each site is reasonably symmetrical with a lighter tail than the Gaussian distribution. The
minimum and maximum value of the GT2MM weather variable recorded in AWAP data
(1960-2015) for any of the 12 weather stations listed in Table 3 is 34 and 126 respectively.
21Table 14: Parameters of the yearly occurrence model.
Site µs φs
Albion Park 80.4 0.074
Bellambi 81.2 0.101
Camden 61.9 0.025
Holsworthy 72.3 0.065
Katoomba 94.0 0.173
Penrith 66.9 0.063
Prospect 68.9 0.107
Richmond 68.1 0.147
Riverview 80.4 0.023
Springwood 74.9 0.071
Sydney Airport 81.5 -0.008
Terrey Hills 86.9 0.089
Therefore, the boundary problems where GT2MM is close to 0 or close to 365, which
may occur when using this method to model in either very arid or very wet locations
are not relevant when modelling in the Sydney Region. The parameters of the yearly
occurrence model are listed in Table 14. The φs parameter values are . Earlier versions of
the stochastic used an AR(1) model on the GT0MM weather variable, where values of φs
were in the range [0.143,0.438]. The correlation between the innovation sequences, {ey,s },
of each site is estimated through simulation.
B Technical details of the maximum temperature stochastic
weather generator
The model for daily maximum temperatures is a GAMLSS model which assumes that the
daily maximum temperature has a skewed normal distribution (SN2, p184, Rigby et al
(2014)). The density function of a skewed normal distribution is given by
1 2
exp − (νz) I (x < µ) +
2ν 2
f (x; µ, σ, ν) = √ (13)
2πσ (1 + ν 2 ) 1 z 2
exp − I (x ≥ µ)
2 ν
where z = (x − µ) /σ and σ, ν > 0.
The model equations of the daily maximum temperature GAMLSS model are
µ ∼ year + ftmax (tmaxd−1 ) + ftmax (tmaxd−2 ) + lightd + heavyd (14)
2
ln (σ) ∼ ftmax (tmaxd−1 ) + ftmax (tmaxd−1 ) (15)
ln (ν) ∼ constant (16)
where tmaxd is the maximum temperature on day d, lightd equals one if the precipitation
on day d was greater than 0mm and zero otherwise, heavyd equals one if the precipitation
on day d was greater than 2mm and zero otherwise and
xL if x ≤ xL
ftmax (x) = x if xL < x < xH (17)
xH if x ≥ xH
22Table 15: Parameters of the yearly maximum temperature model.
Site βs βYEAR,s βSPRE,s βGT2MM,s
Albion Park 3.2 0.010 -0.004 -0.017
Bellambi -0.6 0.012 -0.002 -0.018
Camden -7.5 0.016 -0.008 -0.028
Holsworthy -9.2 0.017 0.012 -0.025
Katoomba -24.2 0.022 -0.031 -0.017
Penrith -9.1 0.018 -0.023 -0.020
Prospect -5.7 0.016 -0.005 -0.025
Richmond -8.5 0.017 -0.023 -0.020
Riverview -12.0 0.018 -0.017 -0.025
Springwood -12.4 0.019 -0.018 -0.019
Sydney Airport -11.3 0.018 -0.036 -0.028
Terrey Hills -8.5 0.016 -0.004 -0.020
where xL is the 0.05th quantile of {tmaxd } and xH is the 0.75th quantile of {tmaxd }. The
use of the function ftmax rather than a similarly shaped spline smoothing function on
tmaxd−1 and tmaxd−2 , as is more common, was simply to reduce the execution time of
daily maximum temperature simulations. A daily maximum temperature GAMLSS model
was estimated for each site and each month (144 models).
As was the case with stochastic precipitation generation, simulations generated from
the daily maximum temperature GAMLSS model also have a negative bias in interannual
variability. We address this by generating a sequence of yearly maximum temperature
averages and scaling the daily maximum temperature sequences accordingly. For yearly
maximum temperature averages we use a linear model with a model equation given by
p
TMAXy,s = βs + βYEAR,s YEAR + βSPRE,s PREy,s + βGT2MM,s GT2MMy,s (18)
where TMAXy,s is the average maximum temperature for site s during year y, PREy,s is
the total precipitation for site s during year y and GT2MMy,s is the number of days when
precipitation was greater than 2mm for site s during year y. The parameters of the yearly
maximum temperature model are listed in Table 15. The parameter values of βYEAR,s
indicate an increase in average maximum temperatures of approximately 1◦ C − 2◦ C per
century. The negative values of parameters βSPRE,s and βGT2MM,s indicate that years with
more wet days tend to have lower average maximum temperatures.
C Technical details of the evaporation stochastic weather
generator
The daily evaporation GAMLSS model assumes that the daily evaporation has a gen-
eralized gamma distribution (GG, p238, Rigby et al (2014)). The density function of a
generalized gamma distribution is given by
|ν| θθ z θ exp (−θz)
f (x; µ, σ, ν) = (19)
Γ (θ) x
for x > 0, where µ > 0, σ > 0 and −∞ < ν < ∞ and where z = (x/µ)ν and θ = 1/ σ 2 ν 2 .
23Table 16: Parameters of the yearly evaporation model.
Site γs γTMAX,s γGT0MM,s
Prospect 0.07 0.181 -0.0066
Richmond -4.54 0.353 -0.0038
Riverview 0.18 0.180 -0.0025
Sydney Airport -3.62 0.371 0.0015
The model equations of the daily evaporation GAMLSS model are
ln (µ) ∼ tmaxd + lightd + heavyd + cos (πζd /365) + sin (πζd /365) +
cos (2πζd /365) + sin (2πζd /365) (20)
ln (σ) ∼ tmaxd + lightd + heavyd + cos (πζd /365) + sin (πζd /365) +
cos (2πζd /365) + sin (2πζd /365) (21)
ν ∼ lightd + heavyd + cos (πζd /365) + sin (πζd /365) +
cos (2πζd /365) + sin (2πζd /365) (22)
where tmaxd is the maximum temperature on day d, lightd equals one if the precipitation
on day d was greater than 0mm and zero otherwise, heavyd equals one if the precipitation
on day d was greater than 2mm and zero otherwise and ζd is the number between 1
and 365 representing the day of the year of the day d. The explanatory variable tmaxd
was omitted from the model for ν as it caused convergence problems. A single daily
evaporation GAMLSS model was estimated for each site for which we have evaporation
data (4 models).
As was the case with stochastic precipitation and maximum temperature generation,
simulations generated from the daily evaporation GAMLSS model also have a negative
bias in interannual variability. We address this bias in evaporation interannual variability
by generating a sequence of yearly evaporation averages and scaling the daily evaporation
sequences accordingly. For yearly evaporation averages we use a linear model with a model
equation given by
EVAPy,s = γs + γTMAX,s TMAXy,s + γGT0MM,s GT0MMy,s (23)
where EVAPy,s is the average evaporation for site s during year y, TMAXy,s is the average
maximum temperature for site s during year y, GT0MMy,s is the number of days when
precipitation was greater than 0mm for site s during year y. The parameters of the yearly
evaporation model are listed in Table 16. The positive values of γTMAX,s parameters
indicate that years with higher maximum temperatures tend to have higher evaporation.
Except for Richmond, the γGT0MM,s parameters are not significant.
24References
Abrams B, Kumaradevan S, Spaninks F, Sarafidis V (2012) An econometric assessment
of pricing Sydney’s residential water use. The Economic Record 88:89–105
Ailliot P, Allard D, Monbet V, Naveau P (2015) Stochastic weather generators: an
overview of weather type models. Journal of the French Statistical Society 156:101–
113
Almutaz I, Ajbar A, Khalid Y, Ali E (2012) A probabilistic forecast of water demand for
a tourist and desalination dependent city: case of Mecca, Saudi Arabia. Desalination
294:53–59
Arbues F, Garcia-Valinas MA, Martinez-Espineira R (2003) Estimation of residential water
demand: a state-of-the-art review. Journal of Socio-Economics 32:81–102
Balling RC, Gober P (2007) Climate variability and residential water use in the city of
Phoenix, Arizona. Journal of Applied Meteorology and Climatology 46:1130–1137
Breyer B, Chang H (2014) Urban water consumption and weather variation in the Port-
land, Oregon metropolitan area. Urban Climate 9:1–18
Brockwell PJ, Davis RA (1991) Time series: theory and methods, 2nd edn. Springer
Chang H, Praskievicz S, Parandvash H (2014) Sensitivity of urban water consumption
to weather and climate variability at multiple temporal scales: the case of Portland,
Oregon. International Journal of Geospatial and Environmental Research 1
Contractor S, Alexander LV, Donat MG, Herold N (2015) How well do gridded datasets
of observed daily precipitation compare over Australia. Advances in Meteorology
2015:325718, DOI http://dx.doi.org/10.1155/2015/325718
David HA, Nagaraja HN (2003) Order Statistics, 3rd edn. Wiley
Dobson AJ (2001) An introduction to generalized linear models, 2nd edn. Chapman and
Hall
Donkor EA, Mazzuchi TA, Soyer R, Roberson JA (2014) Urban water demand forecasting:
Review of methods and models. Journal of Water Resources Planning and Management
140:146–159
Evans JP, Ji F, Lee C, Smith P, Argueso D, Fita L (2014) Design of a regional climate
modelling projection ensemble experiment - NARCliM. Geoscientific Model Develop-
ment 7:621–629
Furrer EM, Katz RW (2007) Generalized linear modeling approach to stochastic weather
generators. Climate Research 34:129–144
Gain AK, Giupponi C, Wada Y (2016) Measuring global water security towards sustainable
development goals. Environmental Research Letters 11, DOI 124015
Gato S, Jayasuriya N, Roberts P (2007) Forecasting residential water demand: Case study.
Journal of Water Resources Planning and Management 133:309–319
25You can also read