Treatment Technology of Microbial Landscape Aquatic Plants for Water Pollution
←
→
Page content transcription
If your browser does not render page correctly, please read the page content below
Hindawi
Advances in Materials Science and Engineering
Volume 2021, Article ID 4409913, 12 pages
https://doi.org/10.1155/2021/4409913

Research Article
Treatment Technology of Microbial Landscape Aquatic
Plants for Water Pollution

 Ming Hu1 and Lei Li 2

 1
 College of Environment and Life Science, Weinan Normal University, Weinan 714000, Shaanxi, China
 2
 College of Tourism, Xinyang Normal University, Xinyang 464000, Henan, China

 Correspondence should be addressed to Lei Li; stanley9065@126.com

 Received 22 May 2021; Revised 24 June 2021; Accepted 7 July 2021; Published 20 July 2021

 Academic Editor: Wei Liu

 Copyright © 2021 Ming Hu and Lei Li. This is an open access article distributed under the Creative Commons Attribution License,
 which permits unrestricted use, distribution, and reproduction in any medium, provided the original work is properly cited.
 With the rapid development of industrial and agricultural production, the rapid growth of population, and the acceleration of
 urbanization, the problem of water pollution is becoming more and more serious. Water shortages and pollution disrupt the
 balance of ecosystems and seriously limit people’s health and rapid economic development. Nowadays, the method of repairing
 sewage bodies using microbial landscape aquatic plants is attracting more and more attention, and it is a big challenge to maintain
 the sustainable development of human beings and nature. This paper uses floating rafts to combine microorganisms and landscape
 aquatic plants to conduct sewage treatment experiments. According to microorganisms, landscape aquatic plants absorb nutrients
 in the water body, examine the changes in water quality during the restoration of microorganisms’ landscape aquatic plants, and
 establish the growth of microorganisms’ landscape aquatic plants. The relationship with changes in water quality aims to provide a
 theoretical basis for the treatment of slow-flowing water bodies such as lakes, reservoirs, large artificial ponds, and rivers. In this
 paper, the experiments are divided into four groups (A (experimental sewage + microbial inoculant), B (experimental sew-
 age + plant), C (experimental sewage + microbial inoculant + plant), and D (experimental sewage)). It can be divided into the total
 nitrogen content, total phosphorus content, and COD value data, and chromaticity detection of each group of the test is
 continuously monitored weekly to comprehensively detect and observe the repair effect on contaminated water bodies. The
 experiment proved that the water quality of the three treatment groups was significantly clearer than that of the blank control
 group, and its clarity: microorganism + plant > microorganism > plant > blank control group. This shows that the combination of
 microorganisms and landscape aquatic plants can effectively reduce the various pollutants contained in sewage and reduce the
 color of sewage. Treating sewage using plant technology that combines microorganisms is feasible and promising.

1. Introduction microorganisms play an important role in maintaining a
 stable balance and material cycle of ecosystems. The active
Water is an important resource for human survival, and it is growth of microorganisms promotes the decomposition of
closely related to people’s lives. With the continuous de- various pollutants in the water area, optimizes the water
velopment of the society and the increase of industrial environment, and leads to the growth of plants. The two
production, a large number of pollutants discharged have synergies in treating water pollution have good prospects for
caused serious damage to drinking water resources, and improving available nutrients.
people’s drinking water safety has great hidden dangers. The use of microbial landscape aquatic plant treatment
According to monitoring, the groundwater in most domestic technology abroad to treat water pollution is much faster
cities is currently polluted by point and nonpoint sources to than in China, and the development and renewal of water
varying degrees, and the degree of pollution is getting worse. pollution treatment technology are rapid. Water pollution
For this reason, it has always been a research focus to find a prevention methods have been significantly improved and
drinking water treatment process with stable effluent and developed. In the near future, the use of microbial landscape
strong applicability. As a major decomposer of ecosystems, aquatic plants is expected to be an important breakthrough.
2 Advances in Materials Science and Engineering

Broussard and Devkota found that the turbidity of the ef- uses fast digestion spectrophotometry to detect the content
fluent of the process was stabilized below 0.1 NTU through of major pollutants in sewage and further test other metrics
the coagulation/ultrafiltration process treatment of a in sewage. It analyzes the quality of the sewage under the test,
micropolluted water source, and it was not affected by the screens aquatic plants in the microbial landscape, and
turbidity of the raw water, and it had strong impact load provides rationale and reference indicators.
resistance [1]. Beale et al. have conducted experiments to
study the combined process of suspension production bi-
ological treatment and ultrafiltration to treat artificially
 2. Treatment Technology of Microbial
simulated micropolluted source water. The experiment Landscape Aquatic Plants for Water Pollution
shows that when the hydraulic retention time is 2–4 h, the
 2.1. Support Vector Machine Algorithm to Predict the Degree of
average removal rate of ammonia nitrogen by the combined
 Water Pollution Control
process can reach more than 85% [2]. Zheng and Rong
conducted indoor simulation experiments using four 2.1.1. Support Vector Regression Algorithm. (1) Linear
aquatic plants, targeting water bodies with severe eutro- Support Vector Regression Machine. Suppose that the sample
phication. The results show that the four submerged plants N
 dataset is denoted as ϕ: Rn ⟶ H xk , yk k�1 , where N is the
have a good reducing effect on total nitrogen and total n
 number of samples, the input data xk ∈ R is n dimensional,
phosphorus, and the COD content tends to decrease overall and the output data yk ∈ Rn corresponds to the input data
[3]. xk . Suppose that the linear regression function is
 The use of microbial landscape aquatic plant treatment
techniques to treat water pollution began in Western f(x) � wT x + b, (1)
countries. Compared to Western countries, our country’s
water pollution treatment technology started late, and its where w ∈ Rn , b ∈ R, and w are normal vectors. The loss
development is relatively slow. With the continued devel- function is used as follows:
opment of science and technology and the gradual increase 0, if|y − f(x)| ≤ ε,
in people’s awareness of environmental protection, the use |y − f(x)|ε � (2)
 |y − f(x)| − ε, otherwise.
of microbial landscape aquatic plants can improve the
progress of water pollution research. Stepanov et al. com- Among them, ε is the preset tolerable loss function, and
pared direct ultrafiltration and coagulation-ultrafiltration the distance between the two dotted lines is 2/‖w‖. The
processes on the treatment of micropolluted water con- optimization goal of the algorithm is to maximize the dis-
taining high ammonia nitrogen. It is found that the direct tance, that is, minimize the reciprocal of the logarithmic
filtration of ultrafiltration membranes has a poor removal distance [7, 8]. Finally, the process of finding the most
rate of ammonia nitrogen, with a removal rate of only about suitable regression function is transformed into
7%. This is because the ultrafiltration membrane is only a
 1
pure physical filtration process, and it is difficult to remove min ‖w‖2 . (3)
the soluble ammonia nitrogen in the water [4]. Sokolova 2
et al. used plant floating beds for water environment The penalty parameter C and the relaxation factor
management. Experiments were conducted for three groups ξ i and ξ ∗i are introduced, and the optimization problem
of controls, and different plants were used for control corresponding to the regression estimation is transformed
treatment, respectively, showing that the three plants have into
good degradation effects on total nitrogen, total phosphorus, N
and COD [5]. Astsaturov et al. used 6 different aquatic plants 1
 min P � min ‖w‖2 + C ξ i + ξ ∗i . (4)
to treat polluted waters. Studies have shown that six plants w,b 2 i�1
have a better phosphorus-removing effect than nitrogen-
removing, with no apparent reduction in COD content [6]. The constraints that should be met are
 This study adopts microbial landscape aquatic plant ⎧
 ⎪
 ⎪
 ⎪ yi − wT xi − b ≤ ε + ξ i , i � 1, . . . , N
treatment technology, takes the sewage from the suburban ⎨ T
sewage ditch as the target, uses floating raft fixation tech- ⎪ w xi + b − yi ≤ ε + ξ i , i � 1, . . . , N (5)
 ⎪
 ⎪
nology to organically combine microorganisms and land- ⎩
 ξ i , ξ ∗i ≥ 0, i � 1, . . . , N
scape aquatic plants to carry out the indoor simulation test of
sewage treatment, and uses water exchange to simulate the Lagrangian dual functions are usually introduced to
actual suburban sewage; the discharge of new pollutants into solve the above convex quadratic programming problem.
the ditch has been continuously monitored for two weeks. The Lagrangian dual function is constructed as follows:
The test achieved good results. At the same time, this article

 N N N
 1
 L w, b, ξ i , ξ ∗i , a, a∗ , η, η∗ � ‖w‖2 + C ξ i + ξ ∗i − ai ε + ξ i − yi + wT xi + b − C ηi ξ i + η∗i ξ ∗i . (6)
 2 i�1 i�1 i�1
Advances in Materials Science and Engineering 3

 �� �
 The Lagrangian multiplier is introduced, which turns the − ��x − x′ ���2
problem into a solution: ⎝
 K x′ , x � exp⎛ ⎠,
 ⎞ (14)
 ∗ ∗ ∗
 σ2
 max min L w, b, ξ, ξ , a, a , η, η . (7)
 a,a∗ ,η,η∗ w,b,ξ,ξ ∗
 where σ is a parameter that characterizes the width of the
 Taking the Lagrangian dual function to differentiate core.
w, b, ξ, and ξ ∗ and equal to zero, this dual problem can be
transformed into a convex quadratic programming problem:
 2.1.2. Entropy Method for Weight. With m evaluation ob-
 1 N jects and n evaluation indicators, the original data matrix
 max JD a, a � − a − a∗ ak − a∗k xTi xk
 ∗
 X � (xij )m×n can be formed:
 ∗
 a,a 2 k,i�1
 (8) x11 x12 · · · x1n
 N N ⎡⎢⎢⎢ ⎤⎥⎥
 − ε ai + a∗i + y i ai − a∗i . ⎢⎢⎢ x21 x22 · · · x2n ⎥⎥⎥⎥
 X � ⎢⎢⎢⎢⎢ ⎥⎥⎥. (15)
 ⋮ xij ⋮ ⎥⎥⎥⎥⎦
 i�1 i�1 ⎢⎢⎢ ⋮
 ⎣
 The conditions are xn1 xn2 · · · xnn
 N
 ai − a∗i � 0, ai a∗i ∈ [0, c]. (9) In the formula, xij is the evaluation value of the i
 i�1 evaluation object on the j index.
 (1) Standardized Processing of Raw Data. In the evalu-
 The final target-fitting regression function is expressed as ation index system of the new smart city, due to the different
 N meanings of different indicators and different quantification
 f(x) � ai − a∗i xTi x + b. (10) units, it is impossible to directly carry out weighting cal-
 i�1 culations, and a standardized matrix Y � (x′ij )m×n can be
 Through deduction, it can be seen that the number of obtained:
support vectors in SVM is limited. It is the input sample xi xij − min xij
corresponding to those ai which is not zero. Only the input x′ij � , i � 1, 2, . . . , m, (16)
vector that meets this condition can contribute to the SVM max xij − min xij
model. This is the sparsity of the SVM solution [9, 10].
 where xij′ represents the normalized value of the i evaluation
 (2) Nonlinear Support Vector Regression Machine.
 object on the j evaluation index and xij represents the
Polynomial kernel functions are highly generalized and
 original data value of the i evaluation object on the i eval-
belong to global kernel functions, but the price paid is in-
 uation index.
adequate in adapting to nonlinear problems. The nonlinear
 (2) Calculate Indicator Weight. Transform the stan-
SVM problem can be described as solving the following
 dardized value of each evaluation index in the standardized
problem:
 matrix Y � (xij′ )m×n to calculate the contribution Zij of the j
 1 N index and the i evaluation object:
 max JD a, a∗ � − a − a∗i ak − a∗k K xi , xk
 ∗
 a,a 2 k,j�1 i xij ′
 Zij � m . (17)
 N N i�1 x′ij
 − ε ai + a∗i + yi ai − a∗i .
 i�1 i�1
 Calculate the information entropy of each indicator:
 (11) 1 m
 ej � − Z ln Zij . (18)
 The conditions are ln m i�1 ij
 N Among them, when defining Zij � 0, Zij ln Zij � 0.
 ai − a∗i � 0, ai a∗i ∈ [0, c]. (12) Calculate information entropy redundancy:
 i�1
 dj � 1 − ej . (19)
 The final target-fitting regression function is expressed as
 N Calculate the weight of the indicator:
 f(x) � ai − a∗i K xi , x + b. (13)
 i�1
 dj 1 − ej
 ω� � , j � 1, 2, . . . , n. (20)
 nj�1 dj n − nj�1 ej
 When there is a lack of prior knowledge in the relevant
fields of sample data, the radial basis kernel function is
generally selected as the kernel function, which can better
balance the fitting effect and generalization ability than other 2.2. Water Pollution Treatment Technology. As an important
kernel functions [11, 12]. The expression of the radial basis element of production and life, water resources are directly
kernel function is as follows: related to the sustainable development of mankind. The
4 Advances in Materials Science and Engineering

water body has a certain purification ability. Through a series mud from the mud. Isolation has a more obvious effect on
of physical, chemical, and biological reactions, the con- improving the quality of water bodies [22, 23]. Masking
centration of pollutants in the water body is reduced, and the separation technology is relatively easy to operate, does not
toxic and harmful substances are decomposed or reduced. require complicated process equipment, and has less po-
When the degree of pollution is greater than the self-pu- tential harm to the surrounding environment. However,
rification energy of the water body, the ecological envi- adding material originally based on rivers and lakes reduces
ronment of it is damaged, and it is necessary to use the effective water capacity of rivers and lakes. Structures
appropriate technical means for sewage treatment [13–15]. that cover and isolate shallow river bottom mud can change
 the topography of the riverbed. Riverbed mud is an integral
 part of the entire aquatic ecosystem and is part of the aquatic
2.2.1. Water Diversion and Pollution Flushing Technology. environment. It is quarantined by the coverage of other
Water conversion flushing technology uses engineering sources. Abandoning sediment purification capacity de-
techniques to transfer large amounts of clean water to stroys the normal ecological circulation system of the entire
polluted waters and dilute pollutants. Introduced clean body of water, increases the amount of engineering, and
water generally has a high dissolved oxygen content, which requires enormous financial support. Therefore, it is not
allows the body of water to flow, reduces the concentration suitable for uneconomical areas or waters with shallow rivers
of pollutants, and increases the oxygen content of the body and small lakes. Its technical limits are better suited for the
of water to improve its self-purification capacity [16, 17]. No treatment and repair of deep-sea sediments.
complicated operation techniques or equipment systems are
required, and sewage can be treated quickly. It is commonly
used for emergency treatment of small contaminated water.
However, while flushing the body of water, sedimented 2.2.4. Artificial Oxygen Enhancement Technology. By using
pollutants are reintroduced into the body of water, causing the original natural conditions of the river or existing
two secondary pollutions, affecting the water bodies of the building facilities, on the basis of the pollution and hypoxia
downstream basins and causing specific pollution in the of the water body, artificial means are used to increase the
downstream water bodies. On this basis, due to the intro- amount of dissolved oxygen in the water body, accelerate the
duction of a large amount of new water into the water body, metabolism of animals, plants, and microorganisms in the
the original river water level rise is very likely to cause the water body, and strengthen the improvement of the puri-
river to divert, and the project cost is huge, which further fication ability of the water body, thus achieving the purpose
shows that this method cannot solve the fundamental of improving water quality [24, 25]. Through mechanical
problem [18, 19]. means, adding aeration and oxygenation equipment and
 improving the purification ability of the polluted water body
 and the surrounding ecological circle greatly increase the
2.2.2. Sediment Dredging Technology. Use the relevant dissolved oxygen content of the water body and have a good
mechanical equipment to discharge the mud at the bottom effect on the reduction of total nitrogen, total phosphorus,
of the river, and reduce the harmful substances and pre- and COD content. The effect is also conducive to the
cipitated pollutants in the water through the mud removal loosening of the river bottom silt to become tighter and to
method. Since the rock-containing substances are generally prevent the pollutants in the bottom sludge from entering
deposited on the surface of the river bottom mud, the mud the upper water body. However, this technology has certain
removal by this method can also effectively reduce the mud limitations, and the larger energy consumption is not
and the total rock content and further expand the water suitable for the pollution control of more water bodies.
capacity of rivers and lakes [20, 21]. It can effectively reduce
pollution of rivers and lakes and improve the water quality of
rivers and lakes and the surrounding environment. How-
ever, this technology has many limitations. It is necessary to 2.2.5. Mechanical Algae Removal Technology. This tech-
consider the depth and area of excavation. Large-scale nology uses various mechanical methods to control water
specialized equipment should be equipped during con- pollution caused by the explosive growth of algae. Generally,
struction. Narrow rivers cannot be built and require a lot of the technical methods used include artificial arching, ul-
financial support. Reducing endogenous pollution and trasonic method, air flotation technology, and mixed
controlling pollution in rivers and lakes cannot achieve good method. This technology method is generally used for the
results, especially in the treatment of eutrophic lakes, es- excessive growth of algae. For rivers and lakes that cause
pecially when external pollution is not effectively managed. eutrophication, the mechanical methods, processes, and
 equipment vary greatly [26]. It can directly change the
 growth of algae caused by nutritional temples and effectively
2.2.3. Masking Isolation Technology. By using sand, clay, and avoid secondary pollution. However, the operation cost is
high-aggregate physical materials to cover the bottom mud, expensive and can only be applied to the treatment of small
it prevents the organic matter and heavy metal pollutants in polluted water bodies. It has obvious limitations and serves
the bottom mud of the river from entering the upper water as an emergency removal. Algae technology cannot fun-
body due to the flow of river water and the accumulation of damentally solve the eutrophication of water bodies caused
bottom mud, effectively removing the water and polluting by algae outbreaks.
Advances in Materials Science and Engineering 5

3. Experimental Design of Treatment Table 1: Test plant species and growth characteristics.
 Technology of Microbial Landscape Plant Family name Ecological habits
 Aquatic Plants Eichhornia crassipes Yujihuaceae Perennial floating leaf type
 Cyperus alternifolius Sphagaceae Perennial emergent
3.1. Test Subject. In order to avoid the difference in the test Phragmites communis Gramineae Perennial emergent
water samples between the groups, the test water sample Scirpus validus vahl Sphagaceae Perennial emergent
selected in this paper is the sewage from the suburban sewage
ditch in a district. Through the investigation of the landscape
 3.3. Establish a Model Evaluation Index System. A metric is a
aquatic plant resources, it is better to adapt and purify. The
 specific metric that is determined according to several metric
principle of high operability, good landscape effect, and high
 goals and can reflect some of the basic characteristics of the
reuse value comprehensively considers the cost issue, adjusts
 valuation target. Indicators are concrete, measurable, and
measures to local conditions, conducts screening tests on the
 target observation points. By actually observing the object,
growth characteristics and pollution tolerance of aquatic
 you can draw clear conclusions. In general, a metric system
plants, and checks the domestic and foreign research on the
 contains three levels of metric that are related to gradual
use of aquatic plants to control water pollution. Literature
 decomposition and improvement. Among them, the 1st level
data and analysis select the following 4 common landscape
 and 2nd level metrics are relatively abstract and cannot be
aquatic plants for this test plant, and the types and growth
 used as a direct basis for assessment. Third-level metrics
characteristics of the 4 test plants are shown in Table 1. First,
 need to be concrete, measurable, and behavior-oriented and
each plant was used as a group and a blank control group to
 can be used as a direct basis for teaching assessment.
conduct a comparative experiment. The total nitrogen con-
tent, total phosphorus content, and COD value data of each
group were continuously monitored for two weeks. At the 3.4. Statistical Processing. Statistical analysis was performed
same time, this article again divides the experiment into 4 with SPSS 13.0 statistical software. The significance test of
groups (A (experimental sewage + microbial inoculants), B the difference was performed by one-way analysis of vari-
(experimental sewage + plants), C (experimental sew- ance. The difference between the two groups was tested by
age + microbial inoculants + plants), and D (experimental LSD-t. The results of total nitrogen, total phosphorus, and
sewage)) for comparison experiments. Continuously monitor COD in sewage were performed by the group t-test. P < 0.05
the total nitrogen content, total phosphorus content, COD is considered to be significant and statistically significant.
value data, and color detection of each group for two weeks,
and comprehensively detect and observe its repair effect on 4. Treatment Technology of Microbial
polluted water bodies. Landscape Aquatic Plants
 4.1. Results of Treatment of Sewage by Experimental Plants
3.2. Experimental Method 4.1.1. Change Trend of Total Nitrogen Content of Each Group
 in the Experiment. Through the continuous monitoring of
3.2.1. Plant Pretreatment. Before the phytoremediation test,
 the total nitrogen content of each group of test water bodies
the test plant must be pretreated. Divide the four plants into
 for a period of one month, the results are shown in Table 2.
plants, and rinse the root soil with tap water. Based on
 It can be seen from Figure 1 that compared with the
ensuring the integrity of the root system, the plant should be
 blank control group, the four plants all have different degrees
skillfully pruned to reduce dead branches and leaves to
 of degradation effects on the total nitrogen in the sewage:
ensure the healthy growth of the plant. The treated plants
 among them, the water hyacinth group has the best deg-
were cultivated in plastic buckets with sewage, depending on
 radation effect on the total nitrogen in the sewage, which is
the species. The duration was 3 days, and we chose vibrant
 obviously ahead of that in the other groups; after two weeks
plants for the phytoremediation test.
 of the test, the total nitrogen content decreased from
 12.2 mg/L at the beginning of the test to 6.78 mg/L, and the
 degradation rate was 44.43%; the reed group had a better
3.2.2. Test Various Indicators. The test was conducted in a degradation effect on the total nitrogen in the sewage. The
room that could be exposed to sunlight. The test time is from content was reduced to 7.62 mg/L, and the degradation rate
November 15th to November 30th, 2020. Room temperature was 37.54%; then, the water onion group had a poor deg-
is maintained at 25–30°C for 2 weeks. On the first day of the radation effect on the total nitrogen in the sewage, the total
test, 100 L of fresh sewage was added to each test group in nitrogen content was reduced to 8.37 mg/L, and the deg-
order to simulate that new pollutants were discharged into radation rate was 31.39%; the last was drought. The umbrella
the actual sewage ditch everyday. After that, each test group grass group reduced the total nitrogen content in the sewage,
changes 10 L of water daily. Total nitrogen, total phosphorus, the total nitrogen content was reduced to 8.73 mg/L, and the
COD levels, and chromaticity are tested every two days. The degradation rate was 28.44%. The analysis of variance
sampling time is 8:00 am, and the water is changed after showed that the four treatment groups with added plants
sampling (if there is no sampling test on the water exchange had significant differences in the removal effect of total
day, the water exchange time is 8:00 am). nitrogen in sewage from the blank control group (P < 0.05).
6 Advances in Materials Science and Engineering

 Changes of total nitrogen content in wastewater treated
 13
 12.2 11.89
 12 11.84 11.87 11.81 11.6
 11.32
 11.81 11.41 11.13
 11.32 10.94 10.92
 11 10.73
 11.65 11.21 10.85
 10.76 10.01
 11.02
 10
 Value

 9.84 9.24
 10.33 8.98
 9 8.73
 9.45 8.93
 8.62
 8.62 8.37
 8
 8.17 8.24
 7.87
 7 7.62
 7.24
 6.78
 6
 0 2 4 6 8 10 12 14
 Days
 EC group SVV group
 CA group Control group
 PC group
 Figure 1: Changes of total nitrogen content in wastewater treated by plants.

Table 2: Data table of changes in total nitrogen content of Table 3: The change data table of the total content of each plant
wastewater treated by plants. treated sewage.
 EC CA PC SVV Control EC CA PC SVV Control
Day Day
 group group group group group group group group group group
0 12.20 12.20 12.20 12.20 12.20 0 1.72 1.72 1.72 1.72 1.72
2 11.65 11.89 11.84 11.87 11.81 2 1.65 1.68 1.63 1.67 1.72
4 11.02 11.41 11.32 11.21 11.81 4 1.59 1.64 1.53 1.62 1.70
6 10.33 10.94 10.85 10.76 11.60 6 1.52 1.58 1.40 1.56 1.67
8 8.17 10.01 9.45 9.84 11.32 8 1.42 1.52 1.31 1.45 1.71
10 7.87 9.24 8.62 8.93 11.13 10 1.30 1.49 1.17 1.34 1.78
12 7.24 8.98 8.24 8.62 10.92 12 1.18 1.42 1.09 1.23 1.86
14 6.78 8.73 7.62 8.37 10.73 14 1.01 1.35 0.92 1.29 1.95

Therefore, the addition of plants effectively promoted the 1.29 mg/L, and the decomposition rate was 25.00%. The last
reduction of total nitrogen in sewage. was a drought. The umbrella glass group reduced the total
 phosphorus content in the sewage, the total phosphorus
 content was reduced to 1.35 mg/L, and the degradation rate
4.1.2. The Change Trend of the Total Phosphorus Content of was 21.51%. Analysis of variance showed that the four
Each Group in the Experiment. Through continuous mon- treatment groups with the addition of plants had a signif-
itoring of the total phosphorus content of each group of test icant difference in the effect of removing total phosphorus in
water bodies for two weeks, the results are shown in Table 3. sewage from the blank control group (P < 0.05). Therefore,
 Figure 2 shows that all four plants have different levels of the addition of plants effectively helped reduce the total
degradation effect on total phosphorus in sewage compared phosphorus content of the sewage.
to the blank control group. Among them, the reed group has
the most decomposing effect on total phosphorus in sewage.
Sewage is significantly more advanced than the other groups. 4.1.3. Test the COD Value Change Trend of Each Group.
Two weeks after the test, the total phosphorus content de- Through continuous monitoring of the COD value of each
creased from 1.72 mg/L at the start of the test to 0.92 mg/L, group of test water bodies for two weeks, the results are
with a degradation rate of 46.51%. Second, the water hya- shown in Table 4.
cinth group showed a better degradation effect on total It can be seen from Figure 3 that compared with the
phosphorus in sewage. The content was reduced to 1.01 mg/ blank control group, the four plants all have different degrees
L, and the degradation rate was 41.28%. After that, the onion of degradation effects on COD in sewage: among them, the
group had a low decomposition effect on total phosphorus in water hyacinth group has the best degradation effect on
the sewage, the total phosphorus content decreased to COD in sewage, which is significantly ahead of the other
Advances in Materials Science and Engineering 7

 Changes in the total content of wastewater treated
 2
 1.86
 1.78 1.95
 1.8 1.72 1.7 1.71
 1.72 1.67
 1.68
 1.67 1.64
 1.6 1.65 1.62 1.58
 1.63 1.52
 1.59 1.56 1.49
 1.45 1.42
 1.53 1.52
 Value

 1.4 1.35
 1.42 1.34
 1.4 1.23
 1.31 1.3 1.29
 1.2
 1.18
 1.17 1.01
 1 1.09

 0.92
 0.8
 0 2 4 6 8 10 12 14
 Days
 EC group SVV group
 CA group Control group
 PC group
 Figure 2: Changes in the total content of wastewater treated by plants.

 Table 4: Data table of changes in COD content of sewage treated by plants.
Day EC group CA group PC group SVV group Control group
0 196 196 196 196 196
2 189 194 191 194 200
4 181 188 185 188 195
6 172 183 179 181 190
8 157 179 164 176 188
10 144 174 162 170 186
12 140 170 156 166 185
14 137 168 151 163 183

 Changes in COD content of wastewater treated
 250

 196
 196 194 200 188 195
 200 196 194 188 183 190 188 186 185 183
 179 176 174
 196 196 191 185 181 170 170 168
 189 181 179 164 166 163
 162 156
 172 151
 150 157 144 140 137
 Value

 100

 50

 0
 0 2 4 6 8 10 12 14
 Days
 EC group SVV group
 CA group Control group
 PC group
 Figure 3: Changes in COD content of wastewater treated by plants.
8 Advances in Materials Science and Engineering

 Table 5: Microbial-plant combined treatment wastewater total nitrogen content change data table.
Day A B C D
0 12.20 12.20 12.20 12.20
2 11.54 11.76 11.41 11.81
4 10.13 10.95 9.63 11.81
6 9.06 10.48 8.21 11.60
8 7.72 9.08 6.57 11.32
10 6.34 8.25 5.16 11.13
12 5.12 7.87 3.52 10.92
14 4.29 7.25 2.73 10.73

groups. After two weeks of the test, the COD value was treatment of sewage with microorganisms and plants has a
reduced from 196 mg/L at the beginning of the test to significantly better effect on reducing the total phosphorus
137 mg/L, and the degradation rate was 30.10%; secondly, content in sewage than using microorganisms and plants
the reed group had a better degradation effect on COD in alone, and the effect of microorganisms in reducing the total
sewage, and the COD value was reduced to 151 mg/L. The phosphorus content in sewage is better than that of plants.
degradation rate is 22.96%; then, the water onion group has a
poor degradation effect on the COD in the sewage, the COD
value is reduced to 163 mg/L, and the degradation rate is 4.2.3. The COD Value Change Trend of Each Group in the
16.84%; the last is the dry umbrella grass group on the COD Microbial Plant Joint Test. Through two weeks of contin-
value in the sewage. The COD value is reduced to 168 mg/L, uous monitoring of the COD value of each group of test
and the degradation rate is 19.39%. The analysis of variance water bodies in the microbial-plant joint test, the results are
showed that the removal effect of the four treatment groups shown in Table 7.
with plants on the removal of COD in sewage was signifi- It can be seen from Figure 6 that compared with the blank
cantly different from that of the blank control group control group, the degradation effect of each treatment test
(P < 0.05). Therefore, the addition of plants effectively group is significantly different. The COD degradation effect:
promoted the reduction of COD in sewage. microorganism + plant > microorganism > plant > blank con-
 trol group, and the final degradation rate is 85.95%, 78.64%,
 and 30.43%, respectively; the combined treatment of sewage
4.2. Results of Microbial-Plant Combined Treatment of Sewage with microorganisms and plants has a significantly better
4.2.1. Variation Trend of Total Nitrogen Content in Each effect on reducing the COD value of sewage than using
Group of Microbial-Plant Joint test. Through two weeks of microorganisms and plants alone, and the effect of micro-
continuous monitoring of the total nitrogen content of each organisms on reducing the COD value of sewage is better than
group of test water bodies in the microbial-plant joint test, that of plants.
the results are shown in Table 5.
 It can be seen from Figure 4 that compared with the blank 4.2.4. The Color Change of Each Group of Samples in the
control group, the degradation effect of each treatment test Microbial-Plant Joint Test. Since sewage contains a lot of
group is significantly different. The total nitrogen degradation pollutants such as organic substances, inorganic substances,
effect: microorganism + plant > microorganism > plant > blank and algae that cause sewage turbidity, it is possible to judge
control group, and the final degradation rates are 77.67%, the turbidity of the water area by detecting the turbidity of
64.85%, and 40.61%, respectively; the combined treatment of the water area. Water bodies become more turbid, less
sewage with microorganisms and plants has a significantly transparent, and vice versa. The clearer the water, the more
better effect on reducing the total nitrogen content in sewage transparent it is. Figure 7 shows the results of monitoring the
than using microorganisms and plants alone, and the effect of chromaticity of the test water of each group in the joint
microorganisms in reducing the total nitrogen content in microbial and plant test for two consecutive weeks.
sewage is better than that of plants. It can be seen from Figure 7 that the water quality of the
 three treatment test groups is clear than the blank control
4.2.2. Variation Trend of Total Phosphorus Content in Each group, and its clarity is: microorganism + plant >
Group of Microbial-Plant Joint Test. Through continuous microorganism > plant > blank control group. In the blank
monitoring of the total phosphorus content of each group of control, the chromaticity of the sewage slightly decreased,
test water bodies in the microbial-plant joint test for two which was the result of natural precipitation. In the other
weeks, the results are shown in Table 6. treatment groups, the chromaticity of the sewage was re-
 It can be seen from Figure 5 that compared with the blank duced. Compared with the blank control, the chromaticity of
control group, the degradation effect of each treatment test the plant group was significantly reduced. Therefore, the
group is significantly different. The total phosphorus degra- addition of plants effectively improved the turbidity of the
dation effect: microorganism + plant > microorganism > sewage; the microbial chromaticity test results were compared
plant > blank control group, the final degradation rates are with those of the blank control. The chromaticity is obviously
71.97%, 61.56%, and 39.23%, respectively; the combined reduced; therefore, the addition of microorganisms is also
Advances in Materials Science and Engineering 9

 Nitrogen content in wastewater treated by microbes and plants
 14
 12.2 11.81 11.81 11.6 11.32
 12 11.76 11.13 10.92
 11.54 10.73
 10.95 10.48
 10 11.41 10.13 9.08
 9.63 8.25 7.87
 9.06
 Value

 8 7.25
 8.21 7.72
 6 6.34
 6.57
 5.16 5.12
 4 4.29
 3.52
 2 2.73
 0 2 4 6 8 10 12 14
 Days
 A C
 B D
 Figure 4: Changes of total nitrogen content in wastewater treated by microbes and plants.

 Table 6: Microbial-plant combined treatment wastewater total phosphorus content change data table.
Day A B C D
0 1.72 1.72 1.72 1.72
2 1.58 1.69 1.51 1.72
4 1.36 1.63 1.27 1.70
6 1.15 1.56 1.03 1.67
8 0.98 1.46 0.86 1.71
10 0.85 1.34 0.62 1.78
12 0.74 1.22 0.53 1.86
14 0.66 1.05 0.48 1.95

 Phosphorus content in wastewater treated by microbes and plants
 2.5

 1.95
 2 1.86
 1.72 1.72 1.78
 1.7 1.67 1.71
 1.69 1.58 1.46
 1.63 1.34
 1.5 1.56
 1.36 1.22
 Value

 1.51 1.15 1.05
 0.98
 1 1.27 0.85
 1.03 0.74
 0.66
 0.86
 0.5
 0.62
 0.53 0.48

 0
 0 2 4 6 8 10 12 14
 Days
 A C
 B D
 Figure 5: Changes of total phosphorus content in wastewater treated by the microbe plant.
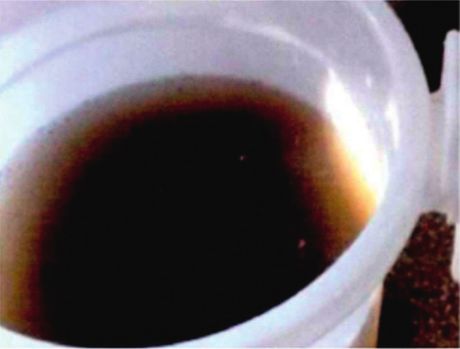
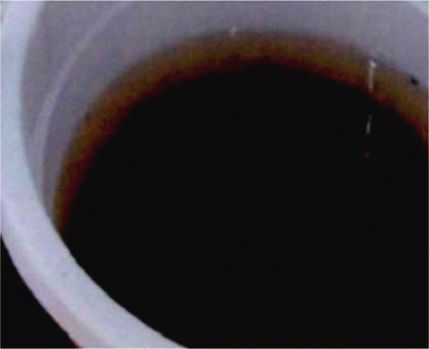
10 Advances in Materials Science and Engineering

 Table 7: The COD value change data table of the combined treatment of microorganisms and plants.
Day A B C D
0 196 196 196 196
2 175 188 168 200
4 152 180 139 195
6 120 171 118 190
8 98 156 88 188
10 77 143 69 186
12 58 139 46 185
14 42 136 28 183

 COD value of wastewater treated by microbes and plants

 14 28 183
 42 136
 12 46 185
 58 139
 10 69 186
 77 143
 8 88 188
 156
 Days

 98
 6 118 190
 120 171
 4 139 195
 152 180
 2 168 200
 175 188
 0 196 196
 196
 196
 0 50 100 150 200 250
 Value
 D B
 C A
 Figure 6: Changes of the COD value of wastewater treated by microbe plants.

 (a) (b) (c) (d)

Figure 7: Intuitive chart of changes in water quality of each group (https://image.baidu.com/). (a) Microorganisms + plants. (b) Mi-
croorganisms. (c) Plants. (d) Control group.

conducive to improving the turbidity of sewage; the com- degradation effect of total nitrogen, total phosphorus, and
bination of microorganisms and plants repairs the sewage to COD in sewage, the effect of combined microorganisms and
further improve the chromaticity of the sewage. plants to repair sewage is obviously better than that of using
 microorganisms and phytoremediation alone, and the effect
5. Conclusions of microbial repair of sewage is better than phytor-
 emediation of sewage. For the improvement of sewage
On the basis of a more comprehensive analysis of the chroma, the two groups of microorganisms combined with
pollution of the sewage ditch in the suburbs, a simulation plants have the best effect, followed by the microbiome, and
test of microorganism-landscape aquatic plants for sewage finally the two groups with added plants. By observing the
treatment was selected to provide a certain theoretical basis bottom and inner wall of the sewage treatment system, the
for actual sewage treatment on site. In view of the two groups of microbiome and microbiome combined plant
Advances in Materials Science and Engineering 11

group, a large number of substances precipitate and attach, [2] D. J. Beale, K. A. Kouremenos, and E. A. Palombo, “Microbial
which effectively improves the chroma of sewage and makes metabolomics,” Exploring the Bioactive Landscape of the Gut
the test water sample clearer. Microbiota to Identify Metabolites Underpinning Human
 In this study, combining the selected microorganisms Health, 2016.
with landscape aquatic plants for sewage treatment research, [3] Zheng and H. Rong, “Effects of soil salinity on microbial
 biomass nitrogen of landscape soil,” Journal of Landscape
the effect of degrading pollutants is good, and the sewage
 Research, vol. 55, no. 573, pp. 56–59, 2016.
water quality is obviously improved, but there are still many [4] Y. M. Stepanov, O. M. Vlasova, and I. A. Klenina, “Assess-
problems that need to be studied in depth. The room ment of microbial landscape and colon cytoprotection indices
temperature is stable and maintained at a temperature where in patients with chronic constipations,” Gastroenterology,
microorganisms can actively reproduce and metabolize. It is vol. 54, no. 1, pp. 51–55, 2020.
impossible to fully analyze the degradation effects of mi- [5] V. I. Sokolova, D. A. Sychev, E. I. Vasilieva et al., “Analysis of
croorganisms and plants under different climatic conditions. the microbial landscape of infection site and the effectiveness
At the same time, the growth of plants is limited by the of antibiotic and immunotherapy in patients with diabetic
climate. The indoor simulation with the small test scale and foot,” Antibiotiki i khimioterapii͡a � Antibiotics and chemo-
low time span cannot meet the requirements. The actual terapy [sic]/Ministerstvo meditsinskoı̆ i mikrobiologicheskoı̆
sewage treatment construction needs to be on site. In the promyshlennosti SSSR, vol. 65, no. 5-6, pp. 25–29, 2020.
indoor simulation test, microorganisms combined with [6] H. Y. Astsaturov, O. O. Syzon, and Y. V. Andrashko, “Skin
 microbial landscape and immune-endocrine parameters in
landscape aquatic plants for sewage treatment have the best
 patients with psoriasis by using narrowband UVB photo-
effect. No in-depth research has been carried out on the therapy,” Wiadomoci lekarskie (Warsaw, Poland, vol. 73,
mechanism of water purification. In future research projects, no. 1, pp. 7–11, 1960.
attention should be paid to the interaction between mi- [7] C. Lin and C.-G. Fu, “Study on crack decrease property of
croorganisms and plants. The mechanism of water purifi- high-performance concrete under corrosive environment in
cation is studied and analyzed. subsea metro tunnel,” Science of Advanced Materials, vol. 11,
 Planting plants in waters not only beautifies the water no. 4, pp. 458–465, 2019.
environment but also purifies the water quality. The subject [8] Z. M. Kulieva, A. I. Gasanov, and L. I. Rustamova, “Microbial
of this paper’s research is sewage from around sewage landscape of the intestine in outpatients with acute enteric
ditches. Sewage is treated by microorganisms in combina- infections,” Kazanskii Meditsinskii Zhurnal, vol. 99, no. 3,
tion with landscape aquatic plants. By measuring changes in pp. 401–404, 2018.
 [9] X. Liu, Y. Sang, S. Ding et al., “Experimental study on the
nutrients in water areas, nutrient removal in a combination
 mechanics characteristics of CFRP strengthening of highway
of microorganisms and landscape aquatic plants has been
 tunnels at different damage states,” Geofluids, vol. 2020, no. 7,
studied, the nitrogen and phosphorus content of plants and pp. 1–11, 2020.
the distribution of microorganisms outside the root zone of [10] W. A. Hammac, D. E. Stott, D. L. Karlen et al., “Crop, tillage,
plants have been studied, and how to remove nitrogen and and landscape effects on near-surface soil quality indices in
phosphorus in water can be studied. The results show that Indiana,” Soil Science Society of America Journal, vol. 80, no. 6,
the use of microorganisms and plants alone to treat sewage pp. 1638–1652, 2016.
effectively reduces total nitrogen, total phosphorus, and [11] W. H. Wang, Y. Wang, L. Q. Sun et al., “Research and ap-
COD levels in sewage. The combination of these two effects plication status of ecological floating bed in eutrophic land-
effectively reduces sewage pollutants and reduces scape water restoration,” The Science of the Total Environment,
chromaticity. vol. 704, no. Feb.20, pp. 135434.1–135434.17, 2020.
 [12] K. E. Kaiser, B. L. Mcglynn, and J. E. Dore, “Landscape
 analysis of soil methane flux across complex terrain,” Bio-
Data Availability geosciences, vol. 15, no. 10, pp. 3143–3167, 2018.
 [13] K. Arbind and Seema, “Monitoring of fluoride contamination
No data were used to support the findings of this study. and correlation with physicochemical parameters of surface
 soil and groundwater near tea-garden of thakurganj block of
Conflicts of Interest kishanganj, Bihar, India,” American Journal of Environmental
 Engineering, vol. 6, no. 2, pp. 38–51, 2016.
The authors declare that they have no conflicts of interest. [14] X. Xu, D. Cao, Z. Wang et al., “Study on ultrasonic treatment
 for municipal sludge,” Ultrasonics Sonochemistry, vol. 57,
 pp. 29–37, 2019.
Acknowledgments [15] I. Kabenge, A. Katimbo, N. Kiggundu et al., “Bioremediation
 technology potential for management of soil and water pol-
This work was supported by the project of National New lution from anticipated rapid industrialization and planned
Agricultural Science Construction. oil and gas sector in Uganda: a review,” Journal of Envi-
 ronmental Protection, vol. 8, no. 11, pp. 1393–1423, 2017.
References [16] R. Purnamawati and R. A. Taufikurahman, “The physiological
 responses of water hyacinth (Eichhornia crassipes (mart).
 [1] J. L. Broussard and S. Devkota, “The changing microbial Solms) and water lettuce (Pistia stratiotes L.) as trivalent
 landscape of Western society: diet, dwellings and discor- chromium bioaccumulator,” 3BIO Journal of Biological Sci-
 dance,” Molecular Metabolism, vol. 5, no. 9, pp. 737–742, ence Technology and Management, vol. 2, no. 1, pp. 2655–
 2016. 8777, 2020.
12 Advances in Materials Science and Engineering

[17] S. K. M. Sa’At, N. Q. Zaman, M. S. Yusoff et al., “The selection
 of palm oil mill effluent for phytoremediation treatment
 system using Cyperus alternifolius,” International Journal of
 Environmental Engineering, vol. 10, no. 2, pp. 106–117, 2019.
[18] M. P. Carey, S. A. Sethi, S. J. Larsen et al., “A primer on
 potential impacts, management priorities, and future direc-
 tions for Elodea spp. in high latitude systems: learning from
 the Alaskan experience,” Hydrobiologia, vol. 777, no. 1,
 pp. 1–19, 2016.
[19] A. K. Ghorai and A. K. Chakraborty, “Sustainable in-situ jute
 retting technology in low volume water using native microbial
 culture to improve fibre quality and retting waste manage-
 ment,” International Journal of Current Microbiology and
 Applied Sciences, vol. 9, no. 11, pp. 1080–1099, 2020.
[20] V. Ferri, C. Battisti, and C. Soccini, “Bats in a mediterranean
 mountainous landscape: does wind farm repowering induce
 changes at assemblage and species level?” Environmental
 Management, vol. 57, no. 6, pp. 1240–1246, 2016.
[21] R. P. Singh, S. Tiwari, M. Singh et al., “Important diseases of
 greenhouse crops and their integrated management: a re-
 view,” Journal of Entomology and Zoology Studies, vol. 8, no. 1,
 pp. 962–970, 2020.
[22] F. Ali, “Functional and structural roles of wiry and sturdy
 rooted emerged macrophytes root functional traits in the
 abatement of nutrients and metals,” Journal of Environmental
 Management, vol. 249, no. 2019, pp. 1–13, 2019.
[23] S. Hemavathi and R. Manjula, “Reduction of wave energy due
 to monotypic coastal vegetation using response surface
 methodology (RSM),” Nature Environment and Pollution
 Technology, vol. 19, no. 5, pp. 1965–1971, 2020.
[24] G. M. Chorak and R. A. Thum, “Identification of resistant clones
 of Eurasian ( Myriophyllum spicatum ) and hybrid ( M. spicatum
 X M. sibricum ) watermilfoil to an operational rate of fluridone,”
 Invasive Plant Science and Management, vol. 13, no. 4, pp. 1–20,
 2020.
[25] J. Pinthong, V. Kanokkantapong, J. Plengsakul et al., “Inte-
 gration of aquaculture, aquatic plant and plant cultivation
 systems,” Journal of Advanced Agricultural Technologies,
 vol. 6, no. 3, pp. 226–230, 2019.
[26] D. A. Jay, A. B. Borde, and H. L. Diefenderfer, “Tidal-fluvial
 and estuarine processes in the lower columbia river: II. Water
 level models, floodplain wetland inundation, and system
 zones,” Estuaries and Coasts, vol. 39, no. 5, pp. 1299–1324,
 2016.
You can also read