The WACC for Drinking Water Companies in the Netherlands - ACM PREPARED FOR PREPARED BY - Rapport The Brattle Group
←
→
Page content transcription
If your browser does not render page correctly, please read the page content below
The WACC for Drinking Water
Companies in the
Netherlands

PREPARED FOR

ACM
                       BOSTON          WASHINGTON   MADRID

PREPARED BY            NEW YORK        TORONTO      ROME

Dan Harris             SAN FRANCISCO   LONDON       SYDNEY

Lucrezio Figurelli
Flora Triolo
Massimiliano Cologgi

9 July 2019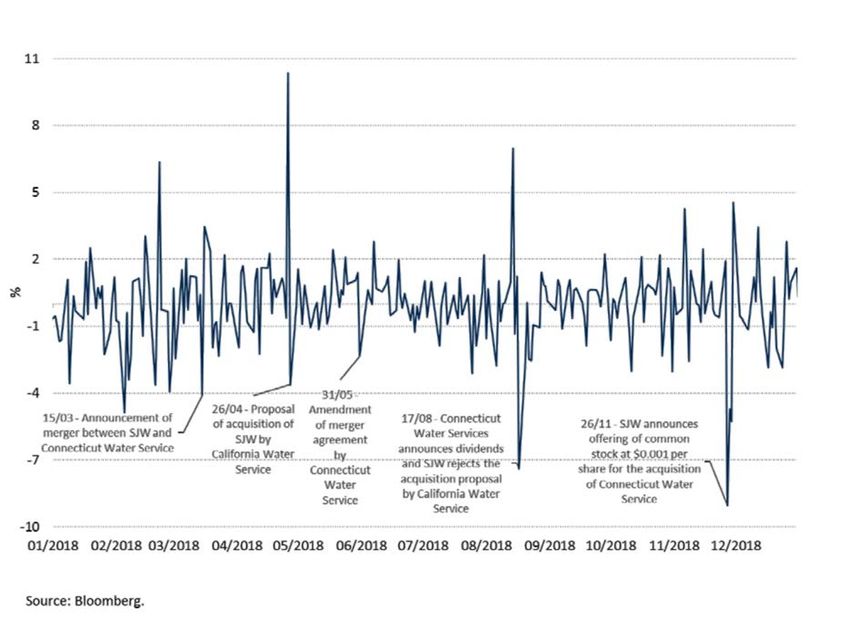
Notice
–––––
    •    This report was prepared for ACM, in accordance with The Brattle Group’s engagement terms, and
         is intended to be read and used as a whole and not in parts.
    •    The report reflects the analyses and opinions of the authors and does not necessarily reflect those of
         The Brattle Group’s clients or other consultants.
    •    There are no third party beneficiaries with respect to this report, and The Brattle Group does not
         accept any liability to any third party in respect of the contents of this report or any actions taken or
         decisions made as a consequence of the information set forth herein.

Copyright © 2019 The Brattle Group, Ltd.

                                                                    BOSTON                   WASHINGTON              MADRID

                                                                    NEW YORK                 TORONTO                 ROME

                                                                    SAN FRANCISCO            LONDON                  SYDNEY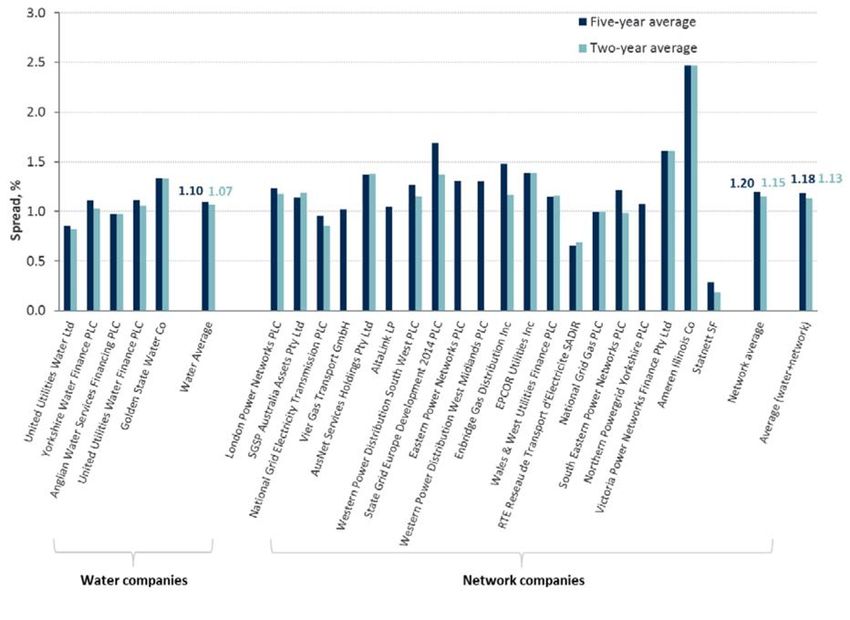
Table of Contents
–––––
I.        Introduction and Summary............................................................................................ 1
II.       The Risk-Free Rate ......................................................................................................... 3
III.      The Equity Risk Premium.............................................................................................. 4
IV.       Selection of Peers and Screening Tests ......................................................................... 7
                     Potential Peers.................................................................................................... 7
                 Liquidity Tests ......................................................................................................... 8
                 Regulated Revenues .............................................................................................. 12
                     M&A Activity................................................................................................... 13
                 Credit Rating .........................................................................................................
                                                                                      BOSTON                           WASHINGTON        14       MADRID
                 The Final Sample of Peers .................................................................................... 16
                                                                                          NEW YORK                        TORONTO                 ROME
V.        Asset Beta ...................................................................................................................... 17
                                                                                          SAN FRANCISCO                   LONDON                  SYDNEY
      V.A. Peer Group Equity Betas ........................................................................................... 18
            Peers Group Asset Betas ............................................................................................ 20
      V.C. Asset Beta for Dutch Water Distribution................................................................. 21
VI.       Gearing .......................................................................................................................... 24
VII. Cost of Debt .................................................................................................................. 26
      VII.A.         Spread on the Generic Industry Bonds ........................................................... 26
      VII.B.         Spread on the Comparable Bonds ................................................................... 27
         VII.B.1. Generic Utility ................................................................................................. 27
         VII.B.2. Firms engaged in similar activities to drinking water distribution ............... 28
      VII.C.         Conclusions on Debt Spreads .......................................................................... 29
VIII. WACC ........................................................................................................................... 32
Appendix A. M&A Activity of Peer Companies ............................................................... 33
Appendix B.             Bonds Issued by Firms Engaged in Similar Activities ................................. 38

                                                                                                                               brattle.com | i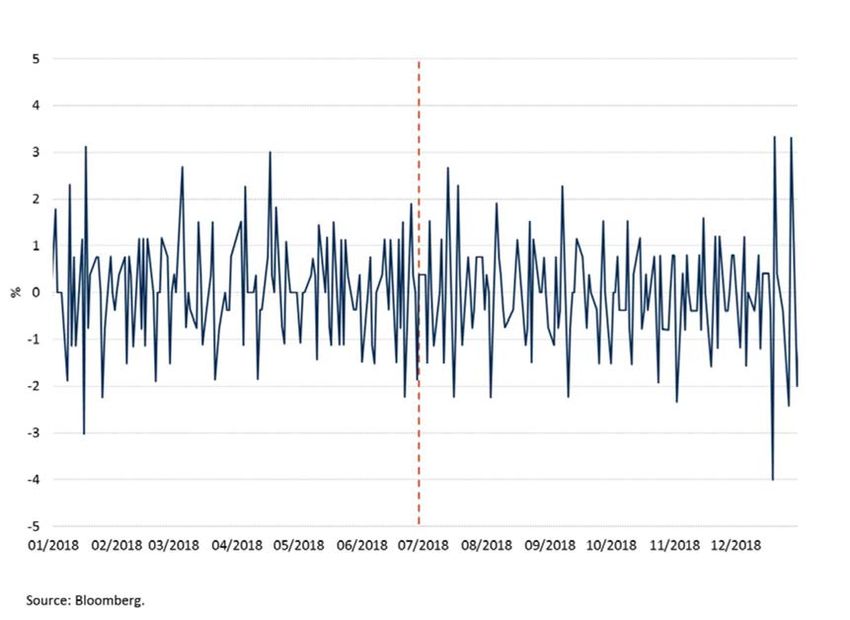
I. Introduction and Summary
–––––
The Dutch Authority for Consumers and Markets (ACM) has commissioned The Brattle Group
(Brattle) to calculate the current Weighted Average Cost of Capital (WACC) for drinking water
distribution companies in the Netherlands. 1 In common with our previous reports, the ACM
has instructed us to calculate the WACC using ACM’s general methodology and the relevant
prescriptions of the applicable legislation. 2 In preparing this report we use data up to and
including April 2019, being the most recent data available at the time of our analysis.

ACM’s methodology specifies the application of the Capital Asset Pricing Model (CAPM) to
calculate the cost of equity. In line with ACM’s methodology, we calculate the risk-free rate
based on the five-year and two-year average yield on 10-year Dutch government bonds. Yields
were on average 0.60% over the past five years, and 0.50% over the past two years. Taking the
average between the two results in risk-free rate of 0.55%. This compares to a risk-free rate of
0.83% in our July 2017 report.

We calculate the Equity Risk Premium (ERP) using long-term historical data on the excess
return of shares over long-term bonds, using data from European markets. Specifically, the
methodology requires that the projected ERP should be based on the average of the arithmetic
and geometric realized ERP for the Eurozone, using the market capitalization of each country's
stock market as weights. The methodology also requires considering whether adjustments to
the final ERP need to be made based on considerations of the historical average ERP, and ERP
estimates based on dividend-growth models. Based on the available data, the methodology
yields an ERP of 4.95%.

The Dutch water firms for which we are estimating the WACC are not publicly traded.
Therefore we have selected a ‘peer group’ of publicly traded water distribution firms, as well as
regulated energy network firms that have similar systematic risk to a regulated water

1   ACM also commissioned Brattle to estimate the WACC for drinking water distribution companies
    in the Netherlands in 2013, 2015 and 2017. See, respectively, Dan Harris and Renato Pizzolla, “The
    WACC for Dutch Drink Water Companies”, 28 June 2013 (“Brattle 2013 Report”); Dan Harris,
    Richard Caldwell, and Ying-Chin Chou, “The WACC for Dutch Drink Water Companies”, 3 July
    2015 (“Brattle 2015 Report”); and Dan Harris, Lucia Bazzucchi, and Flora Triolo, “Update to WACC
    Parameters for Drinking Water”, 28 July 2017 (“Brattle 2017 Report”).
2   The ‘Drinkwaterbesluit’ and the ‘Drinkwaterregeling’.

                                                                                     brattle.com | 1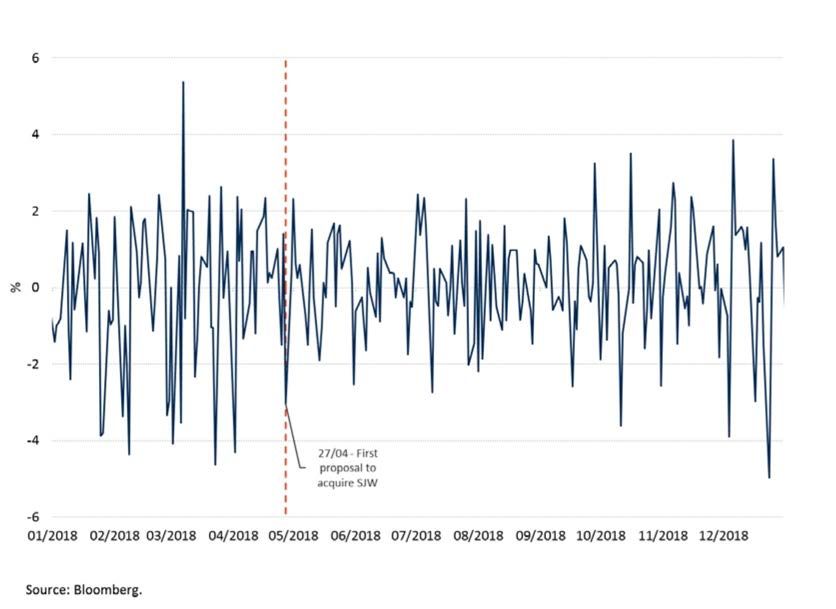
distribution firm. We use the peer group of companies to estimate the beta and gearing for
water distribution. We have tested that the shares of the peer group firms are sufficiently liquid
to provide a reliable beta estimate. The methodology specifies a three-year daily sampling
period for the betas. We estimate that the asset beta for water distribution in the Netherlands
is 0.38. This compares to an asset beta of 0.42 in the July 2017 report.

Based on the gearing and credit ratings of the peer group, we conclude that a 30% gearing level
is a reasonable target for a Dutch water distribution firm and consistent with an A credit rating.

The methodology specifies that the allowed cost of debt should be based on the average cost of
debt for generic A-rated industrial bonds, and the cost of debt for a group of bonds issued by
firms engaged in similar activities to drinking water distribution companies that have a rating
at or close to A – so-called ‘comparable bonds’. We understand that ‘similar activities’ in this
context includes, in addition to water distribution companies, transport and/or distribution of
gas and electricity. We identified a group of comparable bonds that fit these criteria. We
estimate a pre-tax cost of debt of 1.61%, including 15 basis points for the cost of issuing debt.
This compares to a pre-tax cost of debt of 1.93% in the July 2017 report.

Table 1 summarizes the WACC for drinking water distribution and the inputs to the WACC
calculation. Applying the methodology results in an after-tax cost of equity of 3.24% and a
nominal WACC of 2.75%, both pre-tax and post-tax. 3

                              Table 1: Summary of WACC Calculation

                   Gearing (D/A)      [1]   Section VI                                    30.00%
                   Gearing (D/E)      [2]   [1]/(1-[1])                                   42.86%
                        Tax rate      [3]   Assumed                                        0.00%
                    Risk free rate    [4]   Section II                                     0.55%
                       Asset beta     [5]   Section V                                        0.38
                      Equity beta     [6]   [5]x(1+(1-[3])x[2])                              0.54
            Equity Risk Premium       [7]   Section III                                    4.95%
          After-tax cost of equity    [8]   [4]+[6]x[7]                                    3.24%
                  Debt premium        [9]   Section VII                                    0.91%
               Non-interest fees     [10]   Assumed                                        0.15%
             Pre-tax cost of debt    [11]   [4]+[9]+[10]                                   1.61%
        Nominal after-tax WACC       [12]   ((1-[1])x[8])+([1]x(1-[3])x[11])               2.75%
         Nominal pre-tax WACC        [13]   [12]/(1-[3])                                   2.75%

3   Because the Dutch drinking water firms do not pay a corporate tax we apply an effective tax rate of
    0%.

                                                                                      brattle.com | 2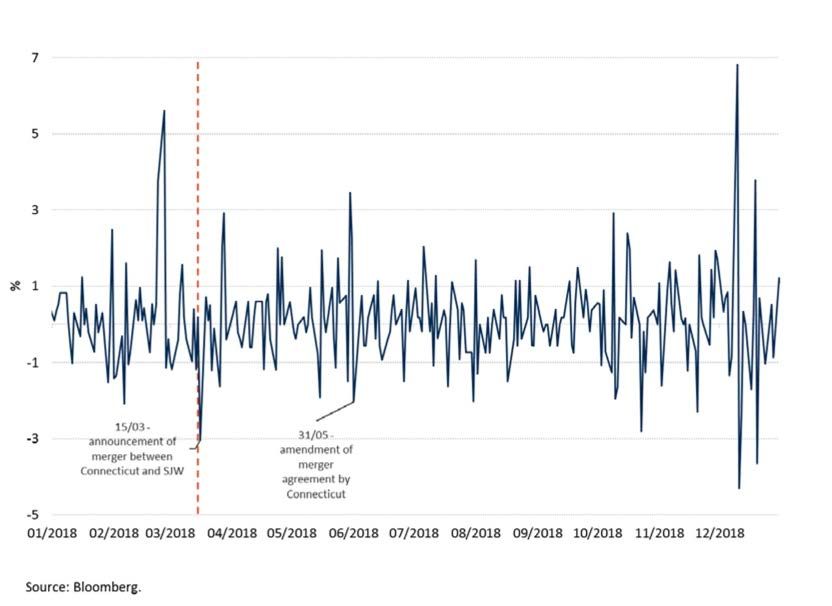
II. The Risk-Free Rate
–––––
The methodology specifies that to calculate the risk-free rate, we must calculate the average
yield on 10-year Dutch government bonds over the last five years, and the average over the last
two years. The risk-free rate is then the average between the two-year and five-year average.

Figure 6 below illustrates the yields on 10-year Dutch government bonds over the past five
years. Yields were generally low over the entire period, exceeding one percentage point only
in late 2014 and in mid-2015, and declined to absolute lows in mid-2016. Yields then stabilized
around 0.5% in 2017 until mid-2018, before further declining at the end of the year.

The two-year average yield is 0.50%, and the five-year average is higher at 0.60%. The average
of these two numbers gives a risk-free rate of 0.55%. 4

                      Figure 1: Yield on Dutch Government 10 Year Bonds

4   We note that the yield on Dutch government bonds turned negative in 10 days between July and
    September 2016. As sensitivity, we calculate that applying a lower bound of zero to the yield of
    government bonds increases the risk-free rate by only 0.0001%.

                                                                                    brattle.com | 3
III. The Equity Risk Premium
–––––
ACM’s methodology specifies that the ERP should be based on a historical time-series of the
excess return of stocks over long-term bonds for the Eurozone economies. Specifically, ACM
has determined to use the simple average of the long-term arithmetic and geometric ERP for
the Eurozone as the anchor for the ERP estimate. The ERP for individual countries in the
Eurozone should be weighted using the current capitalization of each country's stock market. 5
The methodology reflects an estimate of the ERP in the very long run, and notably excludes
countries outside of the Eurozone. This is reasonable, because a Dutch investor is more likely
to be diversified over the same currency zone, rather than to incur additional currency risks by
diversifying within Europe but outside of the Eurozone.

Table 2, below, illustrates the realised ERP derived from one of the most widely used sources
for long-run excess returns, being the data published by Dimson, Marsh and Staunton (DMS)
for individual European countries taken from the February 2019 DMS report. 6 This report
contains ERP estimates using data up to and including 2018. Table 2 shows the simple and
weighted averages of the ERP for the Eurozone countries for which DMS have data. We find
that the simple average between the arithmetic and geometric ERP for the period 1900 to 2018
inclusive was 5.49% for the Eurozone. Using each country's stock market capitalization to
weight the averages across the Eurozone, we derive an ERP of 4.95%.7 This value compares to
a weighted average for the Eurozone of 4.98% in 2015. 8

5   Weighting based on the current market-capitalization reflects the idea that a typical investor would
    invest a larger share of his portfolio in countries with more investment opportunities.
6   Credit Suisse Global Investment Returns Sourcebook, Table 9.
7   Note that the in calculating the Eurozone averages, at the request of ACM, we include Austria, for
    which DMS reports a value of the arithmetic mean of 21.1%. Excluding Austria would reduce the
    value weighted Eurozone average of the arithmetic mean from 6.46% to 6.19%, and the average
    between the value weighted arithmetic and geometric means from 4.95% to 4.82%.
8   See Brattle 2015 Report, p. 29.

                                                                                       brattle.com | 4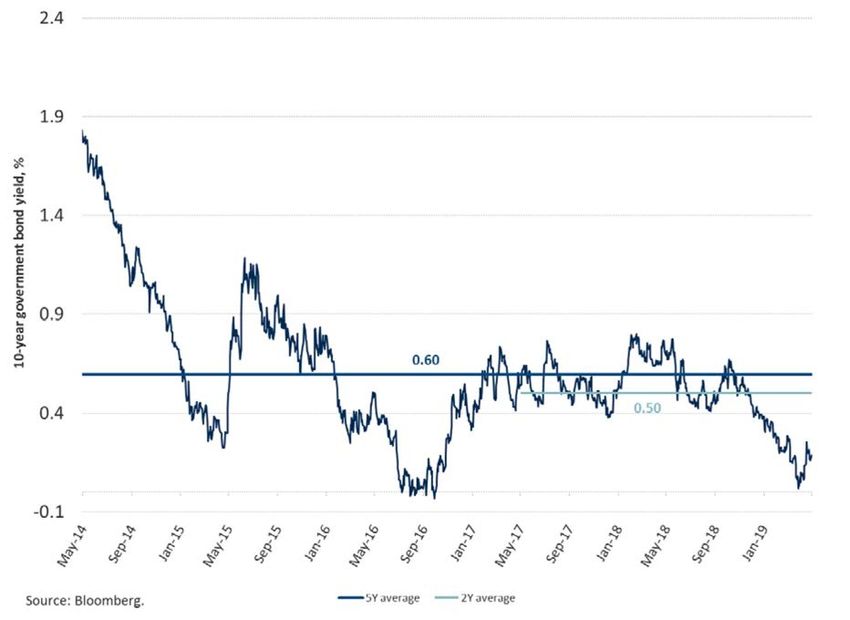
Table 2: Historic Equity Risk Premium Relative to Bonds (1900 – 2018)
                                                                                       Risk premiums related to bonds, 1900 - 2018
                                                                                                                                     Country Market
                                                    Eurozone       Geometric mean          Arithmetic mean               Average
                                                                                                                                         Cap (2018)
                                                                                  %                       %                    %           USD mln
                                                                                 [A]                     [B]     Average [A], [B]               [C]

Austria                                       [1]       1                      2.70                   21.10                11.90           122,356
Belgium                                       [2]       1                      2.10                    4.10                 3.10           340,001
Denmark                                       [3]                              3.30                    4.90                 4.10           388,059
Finland                                       [4]       1                      5.10                    8.60                 6.85           240,126
France                                        [5]       1                      3.00                    5.30                 4.15         2,195,157
Germany                                       [6]       1                      4.80                    8.20                 6.50         1,953,108
Ireland                                       [7]       1                      2.50                    4.50                 3.50            98,110
Italy                                         [8]       1                      3.10                    6.40                 4.75           578,041
Norway                                        [9]                              2.50                    5.40                 3.95           287,789
The Netherlands                              [10]       1                      3.20                    5.50                 4.35           479,091
Portugal                                     [11]       1                      5.10                    9.20                 7.15            61,906
Spain                                        [12]       1                      1.60                    3.60                 2.60           646,757
Sweden                                       [13]                              3.00                    5.20                 4.10           685,034
Switzerland                                  [14]                              2.10                    3.60                 2.85         1,468,465
United Kingdom                               [15]                              3.50                    4.90                 4.20         3,075,777

Average Eurozone                             [16]                              3.32                    7.65                 5.49
Value-weighted average Eurozone              [17]                              3.45                    6.46                 4.95

Notes and sources:
[A][1]-[15], [B][1]-[15]: Credit Suisse Global Investment Returns Sourcebook 2019, Table 9.
[16]: Average [1], [2], [4], [5], [6], [7], [8], [10], [11], [12].
[17]: Average [1], [2], [4], [5], [6], [7], [8], [10], [11], [12], weighted by [C].

ACM’s methodology considers whether an adjustment to an ERP estimate based on historical
data is warranted, based on evidence from models such as the dividend growth model (DGM)
that are based on dividend forecasts. In Figure 2, below, we compare the DMS estimates of the
arithmetic and geometric means of the historical ERP for the Eurozone to the forward looking
estimates of the ERP based on Bloomberg’s and KPMG’s DGMs. 9

9    KPMG provides a DGM-based estimate of the ERP for Europe based on the implied equity returns
     of European indices. See “Equity Market Risk Premium - Research Summary”, KPMG, 31 December
     2018.

                                                                                                                               brattle.com | 5
Figure 2: Eurozone Equity Risk Premiums by Year

                      12%

                      10%
Market Risk Premium

                      8%

                      6%

                      4%

                                                                                                               Bloomberg, Eurozone average
                                                                                                               DMS, arithmetic mean, Eurozone average
                      2%
                                                                                                               DMS, geometric mean, Eurozone average
                                                                                                               KPMG (US and Europe)
                      0%
                        2010          2011             2012            2013            2014            2015             2016            2017            2018
            Source: Bloomberg, various DMS reports, KPMG Netherlands and Brattle calculations. Markets included in the KPMG estimate are ASX, FTSE, Stoxx 600
            and S&P 500.

As shown in Figure 2, both historical DMS estimates and DGM estimates have been relatively
stable over the last five years. Low returns in recent years, however, have negatively affected
the arithmetic and geometric means for the Eurozone. For example, the arithmetic mean of the
historical ERP decreased from 6.61% in 2017 to 6.46% in 2018, while the geometric mean
decreased from 3.61% in 2017 to 3.45% in 2018. Overall, the average between the arithmetic
and geometric means decreased from 5.11% in 2017 to 4.95% in 2018. Similarly KPMG’s
estimate of the ERP remained unchanged between 2017 and 2018 at 5.5%. On the other hand,
Bloomberg DGM estimate of the ERP increased from 9.8% in 2017 to 10.6% in 2018.

Based on the available evidence, ACM has asked us to apply the weighted average DMS ERP
for the Eurozone equal to 4.95% in the WACC calculation.

                                                                                                                                           brattle.com | 6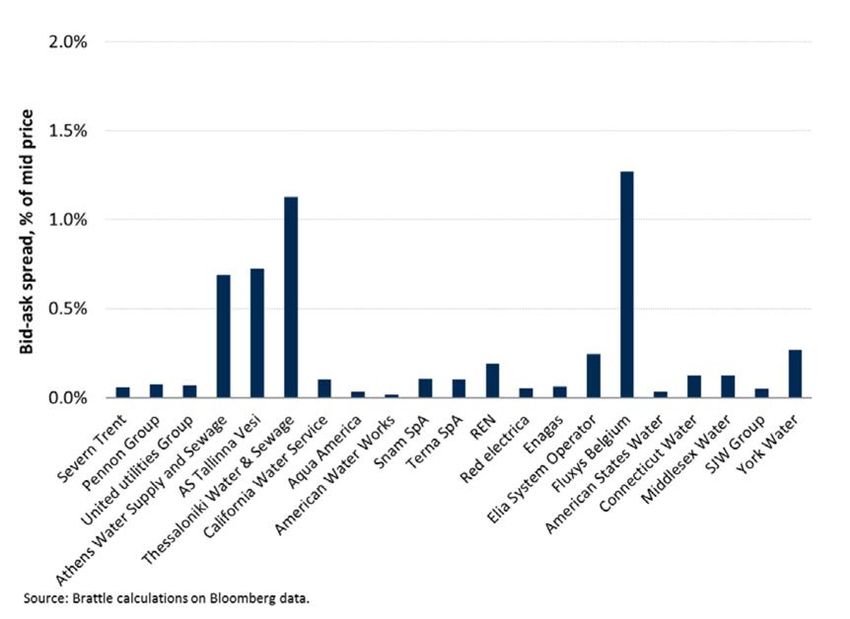
IV. Selection of Peers and Screening Tests
–––––
                 Potential Peers
The Dutch water distribution firms are not listed on a stock exchange. Therefore, to estimate
the beta parameter, we need to find publicly traded firms with similar systematic risk to the
Dutch water distribution firms. We can then estimate a beta value from these firms, which we
call ‘comparables’ or ‘peers’.

In determining the number of peers, there is a trade-off. On the one hand, adding more peers
to the group reduces the statistical error in the estimate of the beta. On the other hand, as more
peers are added, there is a risk that they may have a different systematic risk than the regulated
drinking water firms, which makes the beta estimate less accurate. In statistical terms, once we
have 6-7 peers in the group the reduction in the error from adding another firm is relatively
small.

In this report we begin with the 14 companies selected as peers in 2017, and check whether
they still meet our criteria for inclusion. 10 To this initial list we add the companies initially
selected as potential peers but ultimately excluded in 2017, as these companies may now meet
the criteria for inclusion. 11 Finally, we include five additional water distribution companies
operating in the US. 12 Table 3 provides a list of the potential peers considered.

In the following sections, we describe how we test the potential peers for:

         •   Liquidity. We further divide this test into sub-tests for:
             •   Trading Frequency
             •   Maximum Bid-Ask Spread
             •   Minimum Revenues
         •   Minimum revenues from Regulated Activities

10   See Brattle 2017 Report, Table 5.
11   We only exclude the Dee Valley Group, as the company has been acquired by Severn Trent and is
     no longer listed.
12   Our potential group also includes companies operating in the US, because there are not enough
     European peers that meet our inclusion criteria to reach a sufficient number of peers.

                                                                                     brattle.com | 7
• No major Merger and Acquisition (M&A) activity over the estimation period
• Minimum credit rating
Table 3: Firms Selected as Potential Peers
Potential peers Country Considered in 2017 Selected in 2017
European Water Companies
Severn Trent PLC [1] United Kingdom
Pennon Group PLC [2] United Kingdom
United Utilities Group PLC [3] United Kingdom
Athens Water Supply & Sewerage [4] Greece
Tallinna Vesi [5] Estonia
Thessaloniki Water and Sewage Company SA [6] Greece
Eaux de Royan SA [7] France
Societe des Eaux de Douai SA [8] France
US Water Companies
California Water Service Group [9] United States
Aqua America [10] United States
American Water Works Co Inc [11] United States
American States Water Co [12] United States
Connecticut Water SVC Inc [13] United States
Middlesex Water Co [14] United States
SJW Group [15] United States
York Water Co [16] United States
European Network Companies
Snam [17] Italy
Terna Rete Elettrica Nazionale [18] Italy
REN - Redes Energeticas Nacionais [19] Portugal
Red Electrica [20] Spain
Enagas [21] Spain
Elia System Operator [22] Belgium
Fluxys Belgium [23] Belgium
Liquidity Tests
Illiquid stocks tend to underestimate the true industry beta. 13 Hence, for each of the potential
peers in the initial sample, we test to see if the firms’ shares are sufficiently liquid.
We apply three ‘screens’ or criteria related to liquidity. First, we test that each firm’s shares
trade frequently, the idea being that more frequent trading will give a more reliable beta
estimate. We define a share as being sufficiently traded if it trades on more than 90% of days
13 To understand why this is true, for example, consider a firm with a true beta of 1.0, so that the firm’s
true value moves exactly in line with the market. Now suppose that the firm’s shares are traded only
every other day. In this case, the firm’s actual share price will only react to news the day after the
market reacts. This will give the impression that the firm’s value is not well correlated with the
market, and the beta will appear to be less than one. Using weekly returns to calculate beta mitigates
this problem, since it is more likely that the firm’s shares will be traded in the week. However, using
weekly returns have other disadvantages, such as providing 80% less data points over any given
period.
brattle.com | 8in which the relevant market index trades. 14 We use as the relevant time period the three-year
period, 1 May 2016 through 30 April 2019, which is the estimation window used for the beta.
As illustrated in Table 4, Eaux de Royan and Eaux de Douai fail this test.
Table 4: Liquidity Test Results
Peer passes
% of days
trading
company
frequency
traded
test
European Water Companies
Severn Trent PLC UK [1] 100.00%
Pennon Group PLC UK [2] 100.00%
United Utilities Group PLC UK [3] 100.00%
Athens Water Supply & Sewerage GR [4] 97.27%
Tallinna Vesi EE [5] 98.18%
Thessaloniki Water and Sewerage Company SA GR [6] 96.49%
Eaux de Royan SA FR [7] 49.02%
Societe des Eaux de Douai SA FR [8] 12.35%
US Water Companies
California Water Service Group US [9] 100.00%
Aqua America US [10] 100.00%
American Water Works Co Inc US [11] 100.00%
American States Water Co US [12] 100.00%
Connecticut Water SVC Inc US [13] 100.00%
Middlesex Water Co US [14] 100.00%
SJW Group US [15] 100.00%
York Water Co US [16] 100.00%
Notes and sources:
Based on data from Bloomberg.
Average data from 1 May 2016 to 30 April 2019.
14 Specifically we use the Euro Stoxx index for companies listed in countries in the Eurozone (Athens
Water Supply & Sewerage, AS Tallinna Vesi, Thessaloniki Water & Sewage, Eaux de Royan, Ste des
Eaux de Douai, Snam, Terna, Red Electrica, Redes Energeticas Nacionais, Enagas, Elia System
Operator and Fluxys), the FTSE All-Share index for companies listed in the UK (Severn Trent,
Pennon Group, United Utilities Group), the S&P 500 index for companies listed in the US (Aqua
America, California Water Service Group, American Water Works, American States Water,
Connecticut Water, SJW Group, York Water and Middlesex Water).
brattle.com | 9Table 5: Liquidity Test Results (continued)
Peer passes
% of days
trading
company
frequency
traded
test
European Network Companies
Snam IT [17] 99.09%
Terna Rete Elettrica Nazionale IT [18] 99.09%
REN - Redes Energeticas Nacionais PT [19] 99.74%
Red Electrica ES [20] 99.74%
Enagas ES [21] 99.74%
Elia System Operator BE [22] 99.09%
Fluxys Belgium BE [23] 99.74%
Notes and sources:
Based on data from Bloomberg.
Average data from 1 May 2016 to 30 April 2019.
Second, we check the average bid-ask spread for the shares of potential peers. A low bid-ask
spread indicates a liquidly traded stock, and hence a more reliable beta. We calculate the
average bid-ask spread as a percentage of the stock price over the 1 May 2016 through 30 April,
2019 period. 15 As illustrated in Figure 3, the bid ask spread was generally below 0.25% for most
companies. Fluxys Belgium and Thessaloniki Water and Sewage had spreads above 1% on
average. Athens Water Supply and Sewage and AS Tallina Vesi had average spreads between
0.5% and 1%.
We conclude that a 1% cut-off for the bid-ask spread is reasonable to eliminate illiquid stocks
in the sample. A 1% cut-off leads to the exclusion of Fluxys Belgium and Thessaloniki Water
and Sewage. 16
15 More specifically, we calculate the daily value of the bid-ask spread as the difference between bid
price and ask price at closing divided by the ‘mid –price’, being the average between the bid price
and the ask price. We then calculate the simple average of the daily bid ask spreads over the relevant
period.
16 We acknowledge a trade-off in using a lower cut-off point, which would potentially lead to exclude
companies otherwise considered as sufficiently liquid. A cut-off of 0.5% would only lead to the
exclusion of Athens Water Supply and Sewage, because AS Tallina Vesi does not pass the revenue
test.
brattle.com | 10Figure 3 Bid-Ask spread
Third, we check that the peer companies have annual revenues exceeding €100 million in each
of the last three years. This is because companies with low revenue may also be relatively
illiquid. This is a criterion which we applied in previous reports for the ACM. Table 3 shows
that Eaux de Royan, Eaux de Douai, Tallinna Vesi, York Water and Thessaloniki Water all had
revenues less than €100 million. We exclude these five companies from the peers on this basis.
brattle.com | 11Table 6: Annual Revenues
Total Revenues
2012 2013 2014 2015 2016 2017 2018
European and US Water Companies
Severn Trent PLC [1] 2,245 2,184 2,255 2,473 2,213 1,973 n/a
Pennon Group PLC [2] 1,491 1,520 1,672 1,865 1,651 1,580 n/a
United Utilities Group PLC [3] 1,999 1,994 2,132 2,386 2,101 1,985 n/a
Athens Water Supply & Sewerage [4] 360 354 343 340 347 350 n/a
Tallinna Vesi [5] 53 53 53 56 59 60 n/a
Thessaloniki Water and Sewerage Company SA [6] 77 76 77 77 78 76 n/a
Eaux de Royan SA [7] 36 35 n/a n/a n/a n/a n/a
Societe des Eaux de Douai SA [8] 15 13 n/a n/a n/a n/a n/a
US Water Companies
California Water Service Group [9] 449 451 463 544 566 590 591
Aqua America [10] 590 579 587 734 741 717 710
American Water Works Co Inc [11] 2,253 2,198 2,280 2,863 3,001 2,992 2,930
American States Water Co [12] 363 355 351 413 394 390 370
Connecticut Water SVC Inc [13] 72 75 76 93 95 101 106
Middlesex Water Co [14] 86 86 88 114 120 116 117
SJW Group [15] 204 208 241 275 307 345 337
York Water Co [16] 32 32 35 42 43 43 41
European Network Companies
Snam [17] 3,946 3,848 3,566 3,649 2,560 2,533 2,586
Terna Rete Elettrica Nazionale [18] 1,806 1,896 1,996 2,082 2,103 2,248 n/a
REN - Redes Energeticas Nacionais [19] 811 789 756 819 739 748 n/a
Red Electrica [20] 1,769 1,773 1,854 1,959 1,954 1,971 n/a
Enagas [21] 1,198 1,308 1,227 1,222 1,218 1,385 1,342
Elia System Operator [22] 1,307 1,390 839 851 868 888 n/a
Fluxys Belgium [23] 626 548 555 538 509 511 n/a
Notes:
[1], [2], [3], [4], [5], [6], [18], [19], [20], [22], [23]: No data is available for 2018.
[7], [8]: No public data is available.
Regulated Revenues
The peer companies used to estimate beta should have similar a systematic risk to the Dutch
drinking water firms, meaning that, if the value of the drinking water firms were observable,
it would react to changes in market conditions in the same way as the value of the peer firms.
Because revenues for water production, transport and supply are regulated, they are less
sensitive to changes in economic conditions than a firm operating in the free market. Ideally,
the firms we select as peers should earn most of their revenues from a mix of regulated
production, network and supply activities which are similar to those of the drinking water
brattle.com | 12firms. Accordingly, we only include in the peer group companies with at least 70% of revenues
from regulated production, network or supply activities. 17
As shown in Table 7, all companies, with the exception of Eaux de Royan, Eaux de Douai,
report revenues from regulated activity separately. Regulated activities represent at least 80%
of total revenues for all peers, with the exception of American States, for which regulated
activities represent between 73% and 79% of total revenues.
Table 7: Percentage of Regulated Revenues
% of Regulated Revenues
2012 2013 2014 2015 2016 2017 2018
European and US Water Companies
Severn Trent PLC [1] 82% 82% 86% 86% 84% 90% n/a
Pennon Group PLC [2] 100% 100% 100% 100% 100% 98% n/a
United Utilities Group PLC [3] 99% 99% 100% 100% 99% 99% n/a
Athens Water Supply & Sewerage [4] 97% 96% 94% 94% 94% 93% n/a
Tallinna Vesi [5] 91% 90% 91% 88% 85% 86% n/a
Thessaloniki Water and Sewerage Company SA [6] 96% 95% 96% 94% 94% 96% n/a
Eaux de Royan SA [7] n/a n/a n/a n/a n/a n/a n/a
Societe des Eaux de Douai SA [8] n/a n/a n/a n/a n/a n/a n/a
US Water Companies
California Water Service Group [9] 97% 98% 97% 97% 97% 100% 100%
Aqua America [10] 98% 98% 97% 96% 98% 99% 100%
American Water Works Co Inc [11] 89% 89% 88% 86% 86% 88% 86%
American States Water Co [12] 73% 76% 78% 79% 78% 77% 75%
Connecticut Water SVC Inc [13] 92% 94% 94% 95% 95% 95% 95%
Middlesex Water Co [14] 89% 88% 88% 88% 89% 88% 88%
SJW Group [15] 96% 96% 96% 96% 96% 97% 97%
York Water Co [16] 92% 92% 92% 92% 92% 92% 93%
European Network Companies
Snam [17] 96% 99% 98% 98% 95% 96% 96%
Terna Rete Elettrica Nazionale [18] 95% 95% 91% 89% 90% 87% n/a
REN - Redes Energeticas Nacionais [19] 97% 97% 97% 95% 97% 96% n/a
Red Electrica [20] 97% 97% 97% 88% 89% 94% n/a
Enagas [21] 95% 94% 97% 95% 94% 83% 81%
Elia System Operator [22] 93% 95% 93% 91% 90% 91% n/a
Fluxys Belgium [23] 95% 97% 97% 97% 98% 98% n/a
Notes:
[1], [2], [3], [4], [5], [6], [18], [19], [20], [22], [23]: No data is available for 2018.
[7], [8]: No public data is available.
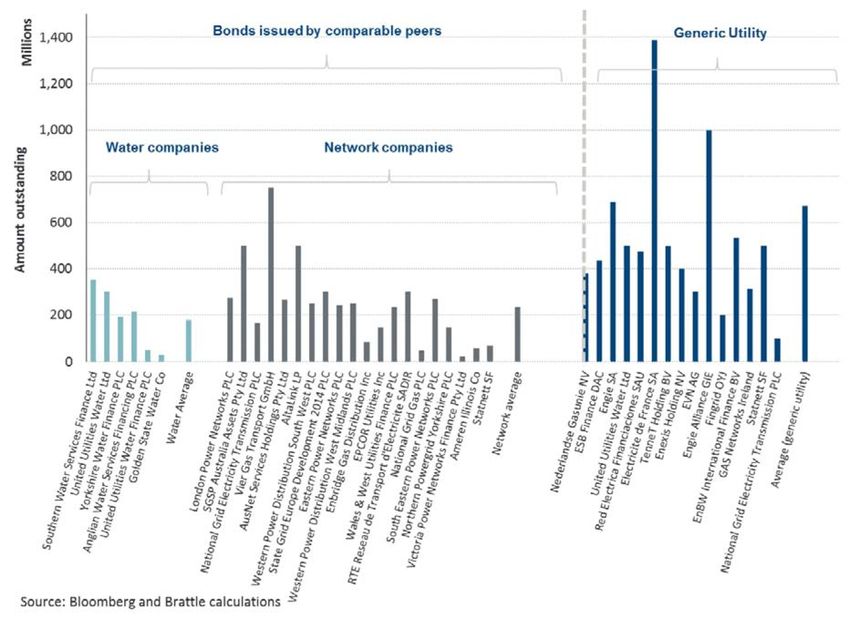
M&A Activity
Substantial M&A activity will tend to affect a firm’s share price in a way that is unrelated to
the systematic risk of the business. Hence, the observed beta for a firm with substantial M&A
17 Although American States Water passes the regulated revenue test, it derives a significant portion
of the non-regulated revenues from business with military sites under long term contracts (50 years).
Therefore we exclude it from our sample as American States Water faces a different systematic risk
than Dutch drinking water firms.
brattle.com | 13activity will tend to underestimate the true beta for a firm with the same business activity
absent M&A activity. Accordingly, we exclude firms that have been involved in ‘substantial’
mergers and acquisitions (M&A) during the period for which data is used to calculate the beta.
We define a ‘substantial’ M&A activity as a transaction involving more than 30% of the average
market capitalization of the firm in the thirty days preceding the transaction, and having a
noticeable effect on the daily returns of the stock price. Several firms were involved in large
M&A activity – that is, exceeding 30% of market capitalization – during the analysis period. 18
Based on our analysis of M&A activity, we exclude REN, Aqua America, Connecticut Water
Services and the SJW Group from the sample. We include details of the analysis in Appendix
A.
Credit Rating
Share prices of firms with lower credit ratings tend to be more reactive to company-specific
news. This will lower the measured beta, in a way that may not be representative of the Dutch
drinking water firms. To avoid this issue, we select as comparables firms with an investment
grade credit rating.
Table 8 shows the credit rating of our potential peers, as assigned by the credit-rating agency
Standard & Poor’s (S&P). According to S&P’s credit-rating scale, an investment grade rating is
BBB- or higher. 19 S&P has assigned a credit rating to fourteen of the firms selected and all of
them have a rating of BBB- or higher. 20
S&P does not report a credit rating for several of the firms included in our group of potential
comparables. We consider that Pennon Group would be investment grade, as its license
18 While we mainly focus on large M&A activity we have also investigated the effect of other large
operations. For example in April 2018 the Belgian transmission system operator Elia, announced
that it had completed the acquisition of an additional 20% stake in Eurogrid International SCRL
(‘Eurogrid’), the holding company of the German TSO 50Hertz Transmission GmbH. Hoever this
did not have a significant effect on the returns of Elia.
19 S&P actually states that BBB is investment grade. Since S&P adds pluses and minuses to its credit
ratings, we interpret a BBB- rating to be investment grade.
20 The rating for Aqua America is actually from another rating agency, Egan-Jones EJR). However EJR
uses the same credit rating scales as S&P, namely from AAA to D (including the modifiers “+” and
“-”) for long-term ratings. See Gunter Strobl, Han Xia, The Issuer-Pays Rating Model and Ratings
Inflation: Evidence from Corporate Credit Ratings (November 2011).
brattle.com | 14conditions require it to maintain financial metrics consistent with an investment grade credit
rating. 21
No rating is available for United Utilities Group, although its subsidiaries United Utilities and
North West Water recently received from S&P a rating of BBB+ and A- respectively on their
long term obligations.
There is also no credit rating for Athens Water Supply. This is likely because, since its listing
on the Athens Exchange in 2000 and until 2013, the Company held only a relative small amount
of short‐term debt, which seemed to fund working capital. From 2014 onwards, the company
did not arrange any bank debt, either long-term or short-term. 22 Accordingly, a credit rating
does not seem relevant for Athens Water Supply.
We do not investigate further the credit rating of Eaux de Royan, Eaux de Douai, Fluxys,
Tallinna Vesi and Thessaloniki Water as these firms do not pass our liquidity and revenue tests.
21 For details of the requirement for British water firms to maintain an investment grade rating see
Ofwat, January 2019. Monitoring Financial Resilience, p. 29.
22 Athens Water Supply & Sewerage, Annual Report 2017, p. 24.
brattle.com | 15Table 8: Credit Rating
Rating S&P Other
[A] [B]
European Water Companies
Severn Trent PLC [1] BBB
Pennon Group PLC [2] n/a
United Utilities Group PLC [3] n/a
Athens Water Supply & Sewerage [4] n/a
Tallinna Vesi [5] n/a
Thessaloniki Water and Sewage Company SA [6] n/a
Eaux de Royan SA [7] n/a
Societe des Eaux de Douai SA [8] n/a
US Water Companies
California Water Service Group [9] A+
Aqua America [10] n/a A-
American Water Works Co Inc [11] A
American States Water Co [12] A+
Connecticut Water SVC Inc [13] A-
Middlesex Water Co [14] A
SJW Group [15] n/a
York Water Co [16] A-
European Network Companies
Snam [17] BBB+
Terna Rete Elettrica Nazionale [18] BBB+
REN - Redes Energeticas Nacionais [19] BBB
Red Electrica [20] A-
Enagas [21] BBB+
National Grid [22] A-
Elia System Operator [23] BBB+
Fluxys Belgium [24] n/a
Extracted from bloomberg as of 13 March 2019.
Aqua America rating comes from Egan-Jones for LC senior unsecured.
The Final Sample of Peers
In Table 9, below, we provide a summary of the results of the screening tests we applied to
arrive at our final sample of peers.
brattle.com | 16Table 9: Screening Tests Summary
% days M&A
Revenues B-A spread Final sample
traded activity
European Water Companies
Severn Trent PLC UK
Pennon Group PLC UK
United Utilities Group PLC UK
Athens Water Supply & Sewerage GR
Tallinna Vesi EE
Thessaloniki Water and Sewerage Company SA GR
Eaux de Royan SA FR
Societe des Eaux de Douai SA FR
US Water Companies
California Water Service Group US
Aqua America US
American Water Works Co Inc US
American States Water Co US
Connecticut Water SVC Inc US
Middlesex Water Co US
SJW Group US
York Water Co US
European Network Companies
Snam IT
Terna Rete Elettrica Nazionale IT
REN - Redes Energeticas Nacionais PT
Red Electrica ES
Enagas ES
Elia System Operator BE
Fluxys Belgium BE
V. Asset Beta
–––––
ACM’s methodology specifies that the cost of equity will be estimated by applying the Capital
Asset Pricing Model, which expresses the cost of equity for a business activity as the sum of a
risk-free rate and a risk premium. The size of the risk premium depends on ERP and the
systematic risk of the underlying asset, a parameter referred to as ‘beta’. 23 Beta is commonly
estimated as the covariance of a firm’s equity value relative to the market as a whole.
As explained above, the Dutch water distribution firms are not listed. Accordingly, we estimate
the systematic risk for Dutch water distribution using our peer group of firms which are
23 Further information on assumptions and theory underlying the CAPM can be found in most
financial textbooks; see Brealey, Myers, Allen, “Principles of Corporate Finance”.
brattle.com | 17publicly traded and derive the majority of their profits either from water distribution, or from
a regulated network activity which appears to face similar systematic risk to water distribution.
V.A. Peer Group Equity Betas
ACM’s methodology specifies a three year daily sampling period for the beta. Accordingly, we
estimate equity betas for the peer group of firms by regressing the daily returns of individual
stocks on market returns over the last three years. 24
The relative risk of each peer, as summarised in its beta parameter, must be measured against
an index representing the overall market. A hypothetical investor in a Dutch water firm would
likely diversify its portfolio within a single currency zone so as to avoid exchange rate risk.
Accordingly, to calculate market returns we use a broad Eurozone index for companies
operating in the Eurozone. We use national indices for companies operating in the UK and the
US. Using indices from the relevant country or currency zone avoids exchange rate movements
depressing the betas, and should result in a higher beta estimate than if we estimated betas
against an index derived in a different currency. 25
We perform a series of diagnostic tests to assess if the beta estimates satisfy the standard
conditions underlying ordinary least squares regression. We test for autocorrelation using the
Breusch-Godfrey test, but rely on the OLS estimate of the beta parameter even in the presence
of autocorrelation. 26 We test for the presence of heteroscedasticity using the White’s test and
use White’s-Huber robust standard errors.
24 As mentioned above, we use the three-year period 1 May 2016 through 30 April 2019 as our
estimation window for the beta of all firms on the peer group.
25 For example, suppose we calculate the beta of a UK firm, whose shares are priced in Pounds sterling
(GBP) and which earns most of its profits in GBP, against an index denominated in Euros. Large
changes in GBP-EUR exchange rates would reduce the beta. This is because, in Euro terms, the
depreciation of the Euro would cause the returns of the UK firm to increase, while the Euro-
denominated index has not changed. This reduces the covariance between the returns on the index
and the return on the UK firm, which results in a lower estimate of beta. From the perspective of a
Eurozone investor, the lower beta represents the diversification benefits of investing in another
currency. However, it would not be correct to then apply this beta for a Eurozone investor investing
in a firm in the Eurozone, which does not have the same diversification benefit, or for a UK investor
investing in a UK firm. Hence, there is an argument that it would be reasonable to use an index
which is in the same currency as the listed shares of the postal operator.
26 We test for autocorrelation up to three lags. Note that the OLS estimator of the beta is unbiased (not
systematically too high or too low) and consistent (converges to the correct value) even in the
presence of autocorrelation.
brattle.com | 18In addition to the above diagnostic tools and adjustment procedures, we further consider the
Dimson adjustment. The Dimson adjustment accounts for the issue that prices may react to
news the day before or the day after the market index reacts. This could occur because of
differences in market opening times and trading hours, or differences in the liquidity of the
firm’s shares relative to the average liquidity of the market. If such an effect is present, a beta
estimated using only the correlation between the daily return on the firm’s share and the return
on the market index on the same day may be biased. Accordingly, the Dimson adjustment
regresses a company’s daily returns using the market index returns one day before and one day
after as additional regressors. 27 The Dimson adjusted beta is the sum of the three coefficients
calculated by the regression. If the market is perfectly efficient, all information should be dealt
with on the same day. If the Dimson adjusted beta estimate is significantly different from the
original beta estimate, this suggests that information about the true beta may be lost by
considering only the simple regression.
We have performed this test for the firms in our peer groups. The Dimson adjustment is
significant for two firms out of the total sample, suggesting that information on systematic risk
is contained within the adjacent days. Hence for these two firms we take the adjusted beta. For
the remaining firms we take the unadjusted beta. Table 10 shows our results.
Table 10 Results: Equity betas
Tests Results
Model
Robust
Heteroskeda Serial chosen
Beta standard
sticity correlation
error
European Water Companies
Severn Trent PLC United Kingdom No No 0.57 0.068 OLS
Pennon Group PLC United Kingdom No No 0.63 0.068 OLS
United Utilities Group PLC United Kingdom Yes No 0.60 0.076 OLS
Athens Water Supply & Sewerage Greece No Yes 0.51 0.069 OLS
US Companies OLS
California Water Service Group United States Yes No 0.63 0.081 OLS
American Water Works United States Yes No 0.35 0.067 OLS
Middlesex Water Co United States Yes No 0.66 0.098 OLS
European Network Companies
Snam Italy No No 0.60 0.083 Dimson
Terna Rete Elettrica Nazionale Italy No No 0.55 0.077 Dimson
Red Electrica Spain Yes No 0.49 0.070 OLS
Enagas Spain Yes No 0.56 0.059 OLS
Elia System Operator Belgium No Yes 0.26 0.052 OLS
27 More days of leads and lags can be applied, but in this case we look at only one.
brattle.com | 19Peers Group Asset Betas
As well as reflecting the systematic risk of the underlying business, equity betas also reflect the
risk of debt or financial leverage. As debt is added to the company, the equity will become
riskier as more cash from profits goes towards paying debt in each year before dividends can
be distributed to equity. With more debt, increases or decreases in a firm’s profit will have a
larger effect on the value of equity. Hence if two firms engage in exactly the same activity, but
one firm has more debt, that firm will have a higher equity beta than the firm with less debt.
To measure the relative risk of the underlying asset on a like-for-like basis it is necessary to
‘unlever’ the betas, imagining that the firm is funded entirely by equity. The resulting beta is
referred to as an asset beta or an unlevered beta. To accomplish the un-levering, the
methodology specifies the use of the Modigliani and Miller formula. 28 Table 11 illustrates both
the equity beta and the asset betas for each firm.
28 The specific construction of this equation was suggested by Hamada (1972) and has three underlying
assumptions: A constant value of debt; a debt beta of zero; that the tax shield has the same risk as
the debt.
brattle.com | 20Table 11 : Equity and Asset Betas
Equity Gearing Tax Asset
beta (D/E) rate beta
[A] [B] [C] [D]
European Water Companies
Severn Trent PLC United Kingdom 0.57 104.5% 19.3% 0.31
Pennon Group PLC United Kingdom 0.63 85.0% 19.3% 0.37
United Utilities Group PLC United Kingdom 0.60 126.3% 19.3% 0.30
Athens Water Supply & Sewerage Greece 0.51 0.0% 28.9% 0.51
Median [1] 0.34
US Companies
California Water Service Group United States 0.63 39.7% 34.6% 0.50
American Water Works United States 0.35 52.0% 34.6% 0.26
Middlesex Water Co United States 0.66 25.0% 34.6% 0.57
Median [2] 0.50
European Network Companies
Snam Italy 0.60 87.8% 25.9% 0.36
Terna Rete Elettrica Nazionale Italy 0.55 83.3% 25.9% 0.34
Red Electrica Spain 0.49 56.1% 25.0% 0.35
Enagas Spain 0.56 81.9% 25.0% 0.34
Elia System Operator Belgium 0.26 105.3% 31.9% 0.15
Median [3] 0.34
Notes and sources:
[B]: Calculated from Bloomberg data. Average values from Q2 2016 to Q1 2019.
[C]: KPMG. Average values from Q2 2016 to Q1 2019.
[D]: [A]/(1+(1-[C])x[B]).
V.C. Asset Beta for Dutch Water Distribution
Table 11 illustrates a range of asset betas. The median asset betas for European water companies
is 0.34, the median asset betas for US water companies is 0.5, and the median asset betas for
European network companies is 0.34. From this range, we must derive a single estimate for the
asset beta for Dutch drinking water distribution.
There are several reasons to believe that the US water companies have structurally higher betas
because of differences in regulation and the US water industry more generally. US firms have
a price cap, rather than a revenue control. Firms with a price caps tend to have higher betas,
because they face volume risk, which itself tends to be correlated to economic activity. In other
words, a downturn in economic activity could cause a reduction in transported volumes, which
in turn leads to reduced revenues and profits for the network. Hence price-cap regulation
increases the correlation between the firm’s share price and the market index, giving a higher
beta. In the US, water firms change their tariff or rates when either the water company or its
customers asks for the tariffs to be changed via a ‘rate case’. Since rate cases are expensive and
brattle.com | 21risky – in that tariffs could change in unpredictable ways – they tend to be only brought when
a large change in the market has occurred. Accordingly, there is a qualitative case that the
revenues for US water firms will tend to be more highly correlated with the market, since it is
more likely that, for example, the water firms’ customers will ask for lower rates when there is
a decrease in economic activity. This does not occur in Europe, where tariff reviews or price
controls take place at regular fixed intervals, independent of macroeconomic activity. We also
understand that US water firms are engaged in a historically high level of capital expenditure.
This will lead to increased ‘operating leverage’, which will again tend to increases betas, all else
being equal. Therefore, we conclude that the betas for US water firms are likely to overestimate
the true beta for a Dutch water distribution firm.
European network firms have similar regulation to Dutch water distribution firms, in that they
are subject to a regulated revenue control. However, they are not water firms. We expect that
water demand may be less sensitive to macroeconomic conditions than demand for electricity
or gas. While a regulated firm may have a revenue guarantee, a fall in revenues may only be
compensated in a later period, and the present value of the compensation may not be sufficient
to offset completely the earlier fall in revenues. Hence, differences in the sensitivity of demand
to macroeconomic conditions could affect a regulated firm’s beta. To the extent that water
demand may be less sensitive to macroeconomic conditions than demand for electricity or gas,
the beta for European network firms may be structurally higher than the beta for a Dutch water
distribution firm.
We conclude that the asset betas we estimate for both US water companies and European
network firms may overestimate the true beta for a Dutch water distribution firm. On the other
hand, we prefer to rely on a sample of at least 10 firms in calculating beta. Given this, we give
more weight to the European water firms, and less weight to the US water firms and the
European network firms when estimating the asset beta for Dutch water distribution.
Specifically, we give the European water firms a 50% weight, and the US water firms and the
European network firms a 25% weight each. Table 12 shows that this results in an asset beta of
0.38. The asset beta of 0.38 is higher than the median European water firms’ asset beta of 0.34,
and in our view is more likely to overestimate the true asset beta for Dutch water distribution
than to underestimate it.
brattle.com | 22Table 12: Asset Beta for Dutch Water Distribution
Median Beta Weight
European Water Companies 0.34 50%
US Water Companies 0.50 25%
European Network Companies 0.34 25%
Weighted average 0.38
In practice, for this period and with the selected peer group, the median beta for European
network firms is identical to the median beta for the European water companies. Hence, the
weighting of the European network firms makes very little difference to the final beta estimate.
We note that if we had simply taken the median of the European and US water firms, we would
have obtained a similar but slightly lower asset beta of 0.37. The median of the entire
unweighted peer group is 0.35.
brattle.com | 23VI. Gearing
–––––
The relevant decree states that the financing structure used for calculating the WACC should
be that which is considered reasonable for drinking water companies given the situation on the
financial markets. The explanatory notes to the decree also state that this value may deviate
from the actual equity capital of the Dutch drinking water companies. Given that the cost of
debt will be based on a firm with an A rating, we interpret this to mean that the assumed
gearing should also be consistent with an A rating.
We have investigated the relationship between gearing and credit rating for a number of
network firms. Figure 4 illustrates our findings. The average gearing of A rated firms is 27%
(see also Table 13) and the average gearing of firms rated BBB is 48. While this confirms that
gearing is an important factor for credit ratings, another factor driving credit ratings include
the sector in which the firm is active and the countries in which it operates.
Figure 4: Gearing vs S&P Credit Rating 29
29 Rating as of end of April 2019 and gearing ratio for Q1 2019.
brattle.com | 24Table 13: Average Gearing (D/A) of A rated Peers
Country Rating D/A
California Water Service Group United States A+ 26%
American Water Works United States A 32%
Middlesex Water Co United States A 18%
Red Electrica Spain A- 34%
Average
A- to A+ 27%
In the past other EU regulators have allowed higher gearing levels – up to around 65% – in
their WACC calculations. However since 2008 firms have generally had to hold less debt to
maintain an investment grade rating. Targeting an A grade rating – which is the last-but-one
credit rating before debt loses its investment-grade status – seems prudent.
We also note two other factors relevant to Dutch water distribution. First, Dutch water
distribution firms pay no tax. This means that one of the main attractions of debt financing –
being that interest is tax deductible –has no relevance for Dutch water firms. As a result, we
might expect Dutch water firms to have less debt than a comparable firm that pays tax. Second,
and relatedly, we understand that there is a requirement that Dutch water distribution firms
are financed by no more than 70% equity, so in other words that they have at least 30% debt.
This places a minimum or floor on the gearing for Dutch water distribution firms.
We note that the final WACC results are not sensitive to the choice of gearing, as long as the
firms maintain an A credit rating. As gearing increases, the proportion of relatively cheap debt
in the WACC formula increases. However, increased debt means more risk for equity holders,
which results in a higher equity beta and a higher cost of equity. The cost of debt will also start
to increase. These two effects – more relatively cheap debt versus increasing equity and
eventually debt costs – largely offset one another. 30 As long as the target level of debt and the
credit rating assumed are consistent with one another, and the credit rating is reasonable given
that the country in which the firms operate, then the resulting WACC should be reasonable.
For example, we estimate that the WACC varies by only 0.1 percentage points (10 basis points)
as the gearing increases from 30% to 40%.
30 The insensitivity of the WACC to the financing choices under certain assumptions is known as the
Modigliani–Miller theorem.
brattle.com | 25Given the observed gearing levels of between 18-34%, the need to maintain an A credit rating
and the relative insensitivity of the WACC to the final choice of gearing (as long as it consistent
with an A rating), a gearing level of 30% is consistent with an A credit rating for regulated
water firms operating in the Netherlands.
VII. Cost of Debt
–––––
The method prescribes that we must estimate the cost of debt for water distribution by looking
at two different sources of debt yields and spreads: 31
1. Yields and spreads on A-rated Euro bonds with a maturity of 10 years, where the bonds
have been issued by firms active in the industry sector. We refer to these yields and
spreads as ‘generic industry’; 32
2. Yields and spreads on bond issued by firms that engage in activities which are
comparable to that of drinking water companies and which have a rating of A, A+ or
A- and a maturity of around 10-years. In our view ‘activities which are comparable to
that of drinking water companies’ in this context means not only firms engaged in
drinking water distribution but also firms engaged in activities such as the transport
and/or distribution of gas and electricity. We refer to these as the ‘comparable’ bonds.
In both cases, we calculate two year average and five year average of the differences between
the bond yields and the relevant government bond rates. We describe the results below.
VII.A. Spread on the Generic Industry
Bonds
The method requires the calculation of the spread of the cost of 10-year debt over the risk-free
rate. We take the risk-free rate to be the contemporaneous yield on a Dutch government 10-
year bond. The spread is the difference between the yield on the generic A-rated industrial
Euro-denominated debt with 10 years maturity and the contemporaneous yield on a Dutch
government 10-year bond.
31 By spread we mean the difference between the yield to maturity and the risk-free rate.
32 By ‘generic’, we mean these are yields for a group of A-rated industrial firms calculated by
Bloomberg, where the individual firms used in the sample have not been identified.
brattle.com | 26Figure 5 illustrates how this spread has developed over the last five years. The average spread
over the last five years is 0.62% and the average spread over the last two years is 0.70%. The
average of these two numbers gives a spread of 0.66%
Figure 5: Spread of 10-year A-rated European Industrial Debt over 10-year Dutch Government
bonds
VII.B. Spread on the Comparable
Bonds
We considered two sources of ‘comparable’ bonds: a generic utility bond and individual bonds
issued by firms engaged in similar activities to drinking water distribution.
VII.B.1. Generic Utility
We took the difference between the yield on the generic A-rated utility Euro-denominated
debt with 10 years maturity and the contemporaneous yield on a Dutch government 10-year
bond. The average spread for the generic A-rated EUR utility bonds was 0.70% over the last
brattle.com | 27five years and 0.76% over the last two years. The average of these two numbers gave a spread
of 0.73%.
VII.B.2. Firms engaged in similar activities to
drinking water distribution
We identified a ‘long-list’ of issuers whose bonds are traded and who seemed to be engaged in
similar activities to drinking water distribution. This includes water distribution companies,
but also network companies more generally. To increase the sample size we considered firms
from around the world, and not only Europe, though we limited the currencies to GB Pounds
Sterling, US Dollars, Canadian Dollars and Euros. We then screened the long-list to find debt
which was rated either A, A+ or A- by Standard & Poors (S&P), and had a maturity of between
9 to 11 years during 1 May 2014 to 1 May 2019. We also eliminated so-called ‘callable bonds’, 33
‘putable bonds’, 34 ‘convertible bonds’ 35 and ‘sinkable bonds’. 36 Applying these criteria reduced
the number of possible bonds to 175. From the list of 175, we then checked that the firms were
really engaged in activities that could be considered similar to drinking water distribution.
Specifically, we checked that most of the firms’ revenues were derived from regulated activities
in energy or water. Applying this criterion reduced the number of bond issuers to 26 (6 in water
and 20 network companies), and the number of bond issues to 66. Appendix B gives details of
the firms considered.
We include yields during the period when bonds still have 9 to 11 year maturity and calculate
spreads against yields of relevant government bonds with 10-year maturity. We decide the
relevant government bond based on the country where the business predominantly operates.
33 Callable bonds can be redeemed by the issuer prior to maturity and generally attract a higher yield
than bonds that mature on a fixed date. Callable bonds cannot be compared on a like-for-like basis
with Government bonds that have a fixed maturity, which is why we do not use them in our
analysis. Callable bonds generally attract a higher yield because bonds are more valuable if interest
rates fall, but in this scenario the callable bond may be re-deemed. Hence the bond holder has an
asymmetric pay-off.
34 Putable bond gives bond holders options to sell back bonds to issuers at one or several specific dates
before maturity. When interest rate arises, investors could exercise such option and use the proceeds
in higher-yield investments. Bond holders are generally willing to accept a lower yield to have such
option.
35 Convertible bond is a type of bond that can be converted into equity at certain dates during its life.
Convertible bond usually attracts a lower yield because investors could convert it into stocks and
receive a higher yield when stock price arises.
36 Sinkable bond is a bond issue backed by sinking fund, which sets aside money on a regular basis to
ensure the repayments will be made. Sinkable bond has less risk to investors and allows the issuers
to offer a lower interest rate to bond holders.
brattle.com | 28You can also read