Investigating the Suitability of a Heat Pump Water-Heater as a Method to Reduce Agricultural Emissions in Dairy Farms
←
→
Page content transcription
If your browser does not render page correctly, please read the page content below
sustainability

Article
Investigating the Suitability of a Heat Pump Water-Heater as a
Method to Reduce Agricultural Emissions in Dairy Farms
Patrick S. Byrne * , James G. Carton and Brian Corcoran

                                          School of Mechanical and Manufacturing Engineering, Faculty of Engineering and Computing,
                                          Dublin City University, Whitehall, Dublin 9, Ireland; james.carton@dcu.ie (J.G.C.); brian.corcoran@dcu.ie (B.C.)
                                          * Correspondence: patrick.byrne49@mail.dcu.ie; Tel.: +353-851094981

                                          Abstract: The performance of an air-source heat pump water-heater (ASHPWH) system manufac-
                                          tured by Kronoterm was benchmarked in this study for the application of dairy farming in Ireland.
                                          The COP of the system was calculated to be 2.27 under normal operating conditions. The device was
                                          able to supply water at 80 ◦ C, however a full tank at this temperature was not achieved or deemed
                                          necessary for the dairy application. Litres per kWh was used as a performance metric for the device
                                          and the usable water per unit of energy for the system was found to be 397 L when using both
                                          electric heaters and 220 L when using just the top heater both in conjunction with the heat pump. The
                                          performance of the heat pump system in terms of its cost to run and efficiency was also compared
                                          with five other water heaters. The heat pump is seen to be very efficient, however due to the carbon
                                          intensity of the Irish grid electricity and high water temperatures required, the solar water heater
                                          with gas backup was found to be the best performing under energy efficiency and carbon emissions
                                          per litre of usable water. In conclusion, although the heat pump was not the best-performing system
                                under these metrics, the cost and complexity of the solar-gas system may be a deterrent for dairy

                                          farmers and for this reason, the heat pump is considered a cost-effective, efficient and viable option
Citation: Byrne, P.S.; Carton, J.G.;
                                          for dairy farmers trying to reduce their carbon footprint and energy bills.
Corcoran, B. Investigating the
Suitability of a Heat Pump
                                          Keywords: heat pump; dairy farming; water heater; ASHP; ASHPWH; usable water; emissions
Water-Heater as a Method to Reduce
Agricultural Emissions in Dairy
Farms. Sustainability 2021, 13, 5736.
https://doi.org/10.3390/su13105736
                                          1. Introduction
Academic Editor: Rajeev Bhat                    One of the main drivers of environmental damage in the form of climate change is
                                          the emission of greenhouse gases (GHGs) in the production of energy, and in particular
Received: 5 April 2021                    electricity. Due to the increase in the burning of fossil fuels since the industrial revolution,
Accepted: 6 May 2021                      the increase in concentration of these GHGs in our atmosphere has resulted in a warming
Published: 20 May 2021                    effect on the planet [1]. There are many ways in which emissions can be reduced and the
                                          implementation of all of the possible strategies improves the chances of meeting the targets
Publisher’s Note: MDPI stays neutral      set out by the EU. Figure 1, below, shows how our climate targets interact with one another.
with regard to jurisdictional claims in   By improving the energy efficiency, the demand for energy decreases, because less energy
published maps and institutional affil-   is required to perform the same basic task, e.g., electricity for agricultural water-heating.
iations.                                  By decreasing the demand for energy, the proportion of energy that is generated through
                                          renewable sources increases, because the total energy has decreased. In the same way, by
                                          reducing the demand for energy through improvements in energy efficiency, the amount
                                          of fossil fuels burned is reduced. The same works for increasing the quantity of energy
Copyright: © 2021 by the authors.         produced from renewable energy. For this reason, all avenues to reducing energy demand
Licensee MDPI, Basel, Switzerland.        and increasing renewable energy production must be explored. For example, in thermal
This article is an open access article    power plants using fossil fuels to produce electricity, only about 55% of the energy stored
distributed under the terms and           within the fuel is converted to electricity as remaining energy is lost as heat [2]. Other
conditions of the Creative Commons        losses which occur in the production of electricity are distribution and parasitic losses. The
Attribution (CC BY) license (https://
                                          net supply efficiency of electricity in Ireland in 2017 was 49%, which means that 51% of the
creativecommons.org/licenses/by/
                                          energy produced was lost [2].
4.0/).

Sustainability 2021, 13, 5736. https://doi.org/10.3390/su13105736                                        https://www.mdpi.com/journal/sustainability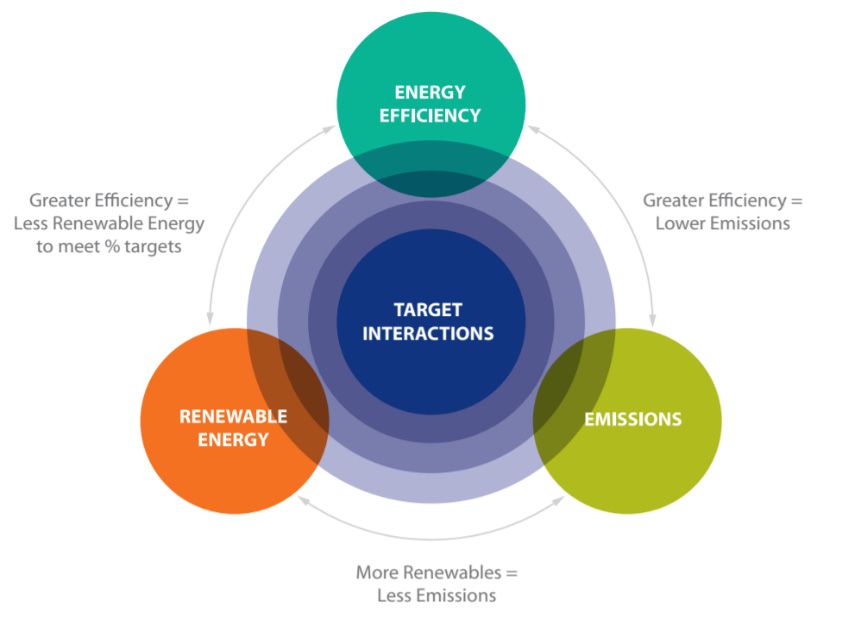
Sustainability 2021, 13, x FOR PEER REVIEW 2 of 17
Sustainability 2021, 13, 5736 2 ofwas
and parasitic losses. The net supply efficiency of electricity in Ireland in 2017 17 49%,
which means that 51% of the energy produced was lost [2].
Figure 1. Interaction of climate actions [3].
Figure 1. Interaction of climate actions [3].
Contrasting to renewables the inefficiency of fuel sources such as coal and peat, as well
as the higher carbon
Contrasting intensity of those
to renewables fuels highlight
the inefficiency ofthe importance
fuel sources suchof investment
as coal and in thepeat, as
renewable energy space in order to reduce GHG emissions
well as the higher carbon intensity of those fuels highlight the importance of investmentin the production of electricity,
as electricity accounted for 27% of the energy used in Ireland in 2018 [4]. An important
in the renewable energy space in order to reduce GHG emissions in the production of
point to note is that in the production of electricity from non-combustible renewable sources
electricity,
such as wind, as electricity accounted
solar and hydro (not pumpedfor 27%hydro of thestorage),
energythereusedare in no
Ireland in 2018 [4]. An
transformation
important pointastothere
losses incurred, noteisisnothat
energyin the
lost production
in the production of electricity from
of electricity from non-combustible
these sources. re-
newable
There aresources
still some such as wind,
losses that occursolar in and hydro (not
the transport pumped
of the hydro
electricity storage),
generated, andthere
there are no
transformation
may be some energy lossesrequired
incurred, to as there the
produce is no energy from
electricity lost in the sources
these productionalso. of electricity
These
losses
from are much
these sources.smaller thanare
There thestill
transformation
some losses losses
thatincurred
occur inwhen producingof
the transport electricity.
the electricity
Reducing
generated, and electricity
there mayconsumption
be some energy by way of increasing
required the efficiency
to produce of appliances
the electricity from these
and of electrical water-heating systems have a large impact
sources also. These losses are much smaller than the transformation losses incurred on reducing Ireland’s GHG when
emissions [5]. This is because as we reduce the demand for electricity the fuel mix becomes
producing electricity.
more renewable as fewer fossil fuels need to be burned to make up the demand.
Reducing
Currently, electricity
the agriculture consumption
sector in Ireland by way of increasing
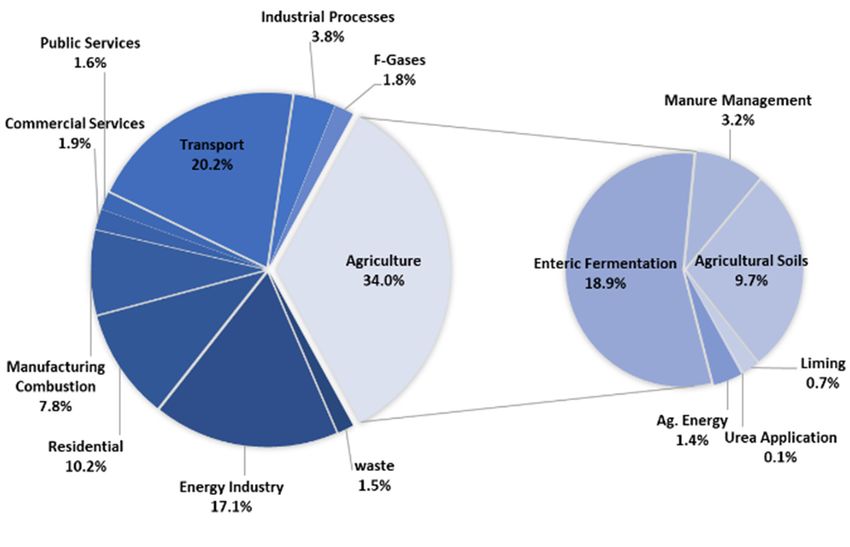
is responsible for 34%the efficiency
of Ireland’s ofGHG
total appliances
and of electrical
emissions, equatingwater-heating
to 45% of Ireland’ssystems have a large
non-Emissions impact
Trade Schemeon reducing Ireland’s
(ETS) emissions [6]. GHG
emissions [5]. This is because as we reduce the demand for
The contribution of each industry to Ireland’s GHG emissions is shown in Figure 2. It can electricity the fuel mix becomes
more renewable
be seen as fewer
that agriculture fossil
is the fuelscontributor
largest need to betoburned Ireland’s toGHG
makeemissions.
up the demand.
Due to the
highCurrently,
proportionthe of Ireland’s
agriculturenon-ETS sector emissions
in Ireland coming from this sector,
is responsible for 34%it is of
imperative
Ireland’s total
that energy emissions in this sector are reduced if
GHG emissions, equating to 45% of Ireland’s non-Emissions Trade Scheme (ETS) the targets set by the EU are going to emis-
be met.
sions [6]. The contribution of each industry to Ireland’s GHG emissions is shown in Figure
In the agriculture sector, emissions have increased year on year since 2014 according to
2. It can be seen that agriculture is the largest contributor to Ireland’s GHG emissions. Due
the Sustainable Energy Authority Ireland (SEAI) and the Environmental Protection Agency
to(EPA)
the high
[4,7].proportion
This contrasts of greatly
Ireland’s with non-ETS
the general emissions
trend in coming
emissionsfrom this sector,
in Ireland it is imper-
which have
ative
beenthat energy
reducing, seeemissions
Figure 3. Thein thismain sector
reason aresuggested
reduced by if the
the targets
EPA for setthisby theincrease
is an EU are going
toinbedairy
met.cow numbers, up 27% over the past five years, which equates to an increase of
overIn300,000
the agriculture
dairy cows sector,
[7]. The emissions
increase have in dairyincreased
cows is the yearresult
on year since
of the milk2014 according
quota’s
to the Sustainable Energy Authority Ireland (SEAI) and the Environmental Protection
Agency (EPA) [4,7]. This contrasts greatly with the general trend in emissions in Ireland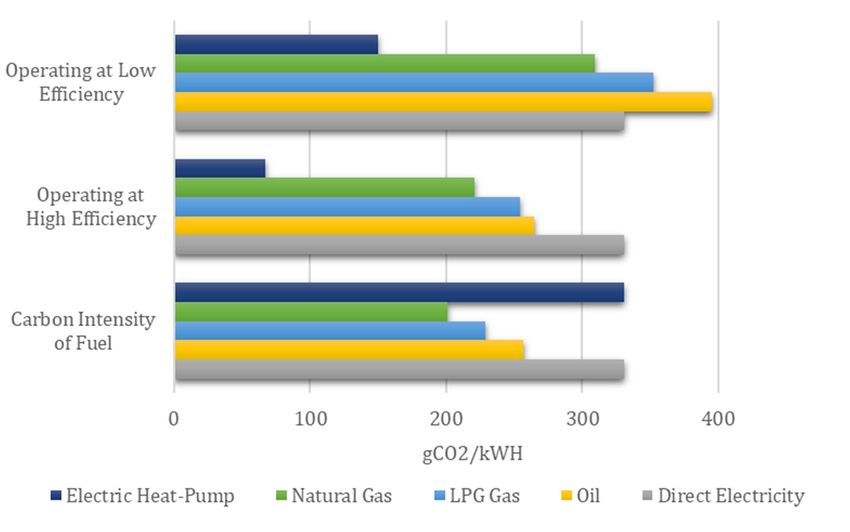
Sustainability 2021, 13, x FOR PEER REVIEW 3 of 17
Sustainability 2021, 13, x FOR PEER REVIEW 3 of 17
which have been reducing, see Figure 3. The main reason suggested by the EPA for this is
Sustainability 2021, 13, 5736 an increase in dairy cow numbers, up 27% over the past five years, which equates 3toof an 17
which have been reducing, see Figure 3. The main reason suggested by the EPA for this is
increase of over 300,000 dairy cows [7]. The increase in dairy cows is the result of the milk
an increase in dairy cow numbers, up 27% over the past five years, which equates to an
quota’s abolition in 2015 [8]. Although abolition of the quotas has resulted in increased
increase of over 300,000 dairy cows [7]. The increase in dairy cows is the result of the milk
incomes for Irish dairy farmers, failure to improve efficiency in practices has resulted in
quota’s abolition
abolition in 2015
in 2015 [8]. [8]. Although
Although abolitionabolition of thehas
of the quotas quotas has in
resulted resulted in increased
increased incomes
an increase in emissions over this time [8]. Most of the emissions in agriculture are non-
incomes
for for Irish
Irish dairy dairyfailure
farmers, farmers, failure toefficiency
to improve improvein efficiency
practicesin practices
has resultedhas resulted
in an increasein
energy related, and a large proportion of these non-energy-related emissions are difficult
anemissions
in increase in emissions
over this timeover
[8]. this
Mosttime [8].emissions
of the Most of the emissions are
in agriculture in agriculture
non-energyare non-
related,
to avoid without the reduction of the herd numbers [9]. Therefore, in order to see any
energy
and related,
a large and a large
proportion proportion
of these of these non-energy-related
non-energy-related emissions
emissions are difficult are without
to avoid difficult
significant reduction in emissions from agriculture, dairy farmers will have to be much
to avoid
the without
reduction of thethe reduction
herd numbers of[9].
theTherefore,
herd numbers [9].to
in order Therefore, in order to
see any significant see any
reduction
more efficient in terms of their energy use.
significant reduction in emissions from agriculture, dairy farmers will
in emissions from agriculture, dairy farmers will have to be much more efficient in termshave to be much
more
of theirefficient
energyin terms of their energy use.
use.
Figure 2. Breakdown of 2018 emissions (data from [6,10]).
Figure 2. Breakdown of 2018 emissions (data from [6,10]).
Figure 2. Breakdown of 2018 emissions (data from [6,10]).
Figure3.3.Agriculture
Figure Agricultureemissions
emissionsfrom
from2000–2018
2000–2018(data
(datafrom
from[10]).
[10]).
Figure 3. Agriculture
Maintaining lowemissions from 2000–2018
total bacteria count and (data fromthermoduric
a low [10]). count is important for
Maintaining low total bacteria count and a low thermoduric count is important for
maintaining milk quality on dairy farms, and one way this is achieved is through using the
maintaining milk quality on dairy farms, and one way this is achieved is through using
Maintaining
correct low total bacteria
cleaning procedures. count
Hot water and a lowfor
is required thermoduric count is
washing milking importantand
equipment for
the correct cleaning procedures. Hot water is required ◦ Cway for
◦ C washing milking equipment
maintaining
the bulk tankmilk quality
on dairy on dairy
farms. farms, and
Temperatures of 65one to 75this is
areachieved
requiredisfor
through using
cleaning the
the correct
milking cleaningand
equipment, 60 ◦ C to 70
procedures. ◦ C water
Hot is required
for cleaning fortank
the bulk washing milking
[11]. Water equipment
temperatures
will drop during the washdown procedure, so according to Glanbia, starting temperatures
of 70–75 ◦ C are essential [12]. The quantity of hot water required on dairy farms fluctuates
based on the frequency of milking and the size of the farm, so it is difficult to quantify theSustainability 2021, 13, 5736 4 of 17
hot water required for an average farm on a daily basis. For the milking machines, roughly
10 litres of hot water are required per milking unit, and an average farm has 16 milking
units [11]. An 8000 L bulk tank, which is adequate for an average sized farm requires about
160 L of hot water for cleaning.
A method which has been used to reduce energy consumption in an industrial and
residential setting has been the implementation of heat pumps for space and water heating.
A study carried out by Hong and Howarth found that in 2009, 18% of energy used in the
home was for water heating [13]. They implemented a scenario to estimate the energy
savings that could be incurred by using heat pumps instead of the more popular gas and
electric heaters, for domestic hot water in residential and commercial setting. The findings
were that if heat pumps were used instead, total emissions from fossil fuels in residential
and commercial use would be 26% lower [13]. It was concluded following the study that
heat pumps are an effective method of reducing GHG emissions in water heating [13].
Upton et al. analysed the electricity consumption of 22 Irish dairy farms along with
their daily and seasonal trends to identify the strategies which could reduce electricity
usage on dairy farms and also maximise the use of electricity during off peak hours to
reduce costs [14]. An interesting result found that 20 of the 22 dairy farms studied were
using electric water heaters [14]. The study also found that 60% of the direct energy
used in the farm was electricity, and of that electricity used, 80% was used in the milking
parlour [14]; the two practices that used the most energy were milk cooling (31%) and
water heating (23%) [14].
Gas boilers and liquefied petroleum gas (LPG) instant boilers are also common meth-
ods of heating water in dairy farms [15]. Both of these are lower in emissions in comparison
to the electric storage heaters due to the lower carbon intensities of the fuels. However,
as the production of electricity is based more on renewables all the time, this may not
be the case for the entire life cycle of a new system which is installed, which should be
considered when purchasing a new water heater. Oil boilers were a popular choice, but
they have higher installation costs and cause greater emissions due to the higher carbon
intensity of the fuel. In terms of renewable water-heating technologies, solar thermal is an
option, but according to Upton et al., it can only supply around 40% of the total hot water
demand [15]. Heat pumps are another renewable technology that can be used for water
heating. Heat pump water heaters work on the basis of a reverse refrigeration cycle, which
means they can transfer low grade heat into useable heat to increase the temperature of the
water. There are three main heat pump technologies: water source heat pumps (WSHPs),
ground source heat pumps (GSHPs) and air-source heat pumps (ASHPs).
Heat pumps have advantages compared to other systems because of their ability to
heat water efficiently due to their high coefficient of performance (COP). The COP of a
heat pump refers to the amount of heat energy supplied by the heat pump, divided by the
amount of energy consumed by the heat pump. Figure 4 shows each type of water heater
with emissions (excluding solar as it has no emissions). Table 1 shows the information in
Figure 4 in a tabular format. It can be seen from Figure 4 that the COP of the heat pump
seems to make it much more efficient in terms of carbon emissions produced per unit of
useful heat. Due to the lack of education in heat pump technology, higher initial cost and a
history of limited availability, the uptake of heat pumps in Irish dairy farming has been
limited. However, there are now grants available in Ireland by the SEAI for businesses
which reduce the initial purchase cost of heat pumps [16].Sustainability 2021,13,
Sustainability2021, 13,5736
x FOR PEER REVIEW 56 of
of 17
17
Figure 4. Heat pumps vs. water heaters (adapted from SEAI [17]).
Figure 4. Heat pumps vs. water heaters (adapted from SEAI [17]).
Table 1. Comparison of water heater efficiency.
Table 1. Comparison of water heater efficiency.
Electric
Direct Electricity Oil LPG Gas
Direct Natural
LPG Gas Natural Electric
Oil Heat-Pump
Electricity Gas Gas Heat-Pump
High Efficiency Conversion Rate 100% 97% 91% 91% 560%
Low Efficiency Conversion Rate High Efficiency
100% Conversion
65%Rate 100%
65% 97% 91%
65% 91% 560%
250%
Carbon Intensity of Fuel Low Efficiency Conversion Rate 100% 65% 65% 65% 250%
331 265 229 201 331
(gCO2 /kWh) Carbon Intensity of Fuel
331 265 229 201 331
(gCO2/kWh)
There are many different types of heat pump which could be used in the application
2. Materials
of and Methods
dairy farming, but the type which would be most applicable to all farms would be the
air-source
2.1. Heat Pump Systemwater-heater (ASHPWH) [17]. Other heat pumps are more expensive
heat pump
to install and may not be possible to install in certain farms, and therefore this study will
The heat pump system used in this study is an air-source heat pump water heater
deal with ASHPWHs in particular. In this study the performance of an ASHPWH system
(ASHPWH) made by Kronoterm and supplied by Glenergy Ltd. [21], which can be seen
is of interest for the application of dairy farming in Ireland. A study by Upton et al. [18]
in Figure 5. The condenser in the heat pump is a wrap-around condenser. The heat pump
investigated the performance of an ASHPWH with an electric heating element for the dairy
incorporates two electric water heaters which are used to heat the tank above 65 °C or to
farm application. The heat pump was used to heat the water to 55 ◦ C, and the electric
heat just the top portion of the tank when only a small amount of hot water is needed. For
heating element was then used to heat the water to 80 ◦ C. The study used usable water
the purpose of this study, the comfort setting and the external heater settings on the device
as a metric for the performance of the heat pump and it defined usable water as water
were used. The comfort setting uses the heat pump to heat water to 65 °C and then uses
between the temperatures of 60 ◦ C and 80 ◦ C [18]. This is the temperature range for which
the electric heaters to heat the water to 80 °C, and the external heater setting allows one to
the water is deemed usable for washing down the bulk tank and the temperature range for
choose for either the top heater or both heaters to be used. The two configurations that the
cleaning the milking machines is 65 ◦ C to 75 ◦ C. The temperature of the water in the tank
heat pump
may not be was tested in are shown
the temperature that theinwater
Tablewill
2. be at when it reaches the bulk tank and
milking machines, so a higher threshold for useable water temperature is used in this study
to account for this. The metric of L/kWh was used to compare the performance of the heat
pump water heater with an electric emersion element only water heater. The ASHPWH
was able to produce 15.12 L/kWh in comparison to 9.66 L/kWh with the electric emersion
heater [18].
Upton’s study found that the maximum amount of usable water which could be
drawn out of the system was found when the water was mixed during the heating process.
This study aims to use the same metrics to compare an ASHPWH with some of the
other options available to a dairy farmer looking to improve the energy efficiency of their
farm, in particular the performance of an air-source heat pump water-heater (ASHPWH)
system, manufactured by Kronoterm, is analysed for its ability to reduce emissions in the
Figure 5. Heat pump schematic and statistics.Sustainability 2021, 13, 5736 6 of 17
application of dairy farming in Ireland. For this study usable water is in line with Glanbia’s
recommendation of greater than 70 ◦ C [12].
ASHPWHs are very sensitive to their ambient conditions, but ambient temperature
has the largest effect as the amount of energy available to the heat pump from the air
decreases as temperature decreases. In general terms, as the ambient temperature increases,
the COP of the heat pump increases and as the ambient temperature decreases, so does the
COP. The true relationship though is slightly more complex, the COP of the heat pump
is related to the difference between the ambient temperature and the temperature of the
heat sink. This is why as the temperature of the water increases within the ASHPWH, the
COP decreases. As the difference in temperature between the ambient conditions and the
heat sink4.increases,
Figure it becomes
Heat pumps more
vs. water difficult
heaters for the
(adapted system
from SEAIto[17]).
draw useful heat from the
air, and therefore it uses more power per unit of useful heat which it supplies to the heat
sink.
TableThis relationship of
1. Comparison has beenheater
water shownefficiency.
in multiple studies, which aimed to compare the
performance of ASHPs during different periods of the year. For example, in a study carried
out by Ji et al. which was carried out in China Direct LPG from
[19], the COP increased 2 at 4.5 ◦ CElectric
Natural
◦
average temperature to 3.42 at 31 C average Oil
temperature. A similarGasstudy carried
Electricity Gas outHeat-Pum
by
Zhang et al. investigated the COP of a heat pump over each season, in order to find the
High Efficiency Conversion Rate 100% 97% 91% 91% 560%
seasonal performance factor (SPF) of an air-source heat pump [20]. The study found that
Low Efficiency Conversion Rate 100% 65% 65%
◦
the COP during the winter, at an average ambient temperature of 0 C was 2.61, which 65% 250%
increased Carbon
to 4.82Intensity of Fuel
during spring and autumn with an average temperature of 25 ◦ C and
331 265 229 201 331
increased further (gCO summer to 5.66 for an average temperature of 35 ◦ C [20]. These
2/kWh)
during
studies show how great an effect the ambient temperature of the environment can have on
the
2. performance
Materials and of air-source
Methodsheat pumps.
2.2.1. Heat Pump
Materials System
and Methods
2.1. Heat
ThePump
heatSystem
pump system used in this study is an air-source heat pump water heat
The heat pump
(ASHPWH) madesystem used in this
by Kronoterm andstudy is an air-source
supplied by GlenergyheatLtd.
pump water
[21], heater
which can be see
(ASHPWH) made by Kronoterm and supplied by Glenergy Ltd. (Sydney, Australia)
in Figure 5. The condenser in the heat pump is a wrap-around condenser. The heat pum [21],
which can be seen
incorporates in Figure
two electric5. water
The condenser
heaters in the heat
which arepump
usedistoa heat
wrap-around
the tankcondenser.
above 65 °C or
The heat pump incorporates two electric water heaters which are used to heat the tank
heat just the top portion of the tank when only a small amount of hot water is needed. Fo
above 65 ◦ C or to heat just the top portion of the tank when only a small amount of hot
the purpose of this study, the comfort setting and the external heater settings on the devic
water is needed. For the purpose of this study, the comfort setting and the external heater
were used.
settings on theThe comfort
device setting
were used. Theuses the setting
comfort heat pump to heat
uses the watertotoheat
heat pump 65 °C andtothen use
water
the
◦ electric heaters to heat the water to 80 °C, and the external
◦ heater setting
65 C and then uses the electric heaters to heat the water to 80 C, and the external heater allows one
choose
setting for either
allows one tothe top heater
choose or both
for either heaters
the top heatertoorbe used.
both Theto
heaters two
be configurations
used. The two that th
configurations
heat pump was thattested
the heatinpump was tested
are shown in are2.shown in Table 2.
in Table
Figure
Figure 5. 5. Heat
Heat pump
pump schematic
schematic and statistics.
and statistics.Sustainability 2021, 13, 5736 7 of 17
Table 2. Heat pump system configurations.
Configuration Heat Pump Status Immersion Element Status
1 On from 20–65 ◦C Top Heater Only from 65–80 ◦ C
2 On from 20–65 ◦ C Both Heaters On from 65–80 ◦ C
2.2. Measurement Equipment
The measurement equipment used in this study included a Fluke 435 Series II Power
Quality and Energy Analyser, a Pico data logger with thermocouples, the Kronoterm cloud
system and an EL-USB II data logger. Information such as temperatures, relative humidity
and power were collected by these systems in order to characterise the performance of the
system under the operating conditions of the given test, as ambient conditions can have a
large effect on the performance of heat pumps.
2.3. Testing Setup and Procedure
The setup for the tests was consistent for each of the tests performed, and the heat
pump settings were used to vary the test parameters. In order to measure the power and
energy, the loops and clips on the Fluke system were connected to the relevant wires. The
EL-USB II data logger was attached to the air intake to ensure that the ambient conditions
were measured accurately. The Pico data logger was connected to k type thermocouples
which were used to measure the temperature of the water as it exited the tank, in order to
measure the useable water.
2.4. Equations
This formula was used to calculate the energy increase in the water so that the COP of
the heat pump could be calculated. The equation used for this was:
E = mc p (∆T ) (1)
where m is the mass of the water, c p is the specific heat capacity and ∆T is the temperature
difference between the start and end temperature of the water.
The COP of an ASHPWH has been defined as the amount of energy the system can
transfer to the water divided by the energy consumed by the system.
E
COP = (2)
Q
The carbon emissions per cycle in kg (C) of each water heater was calculated using
this formula.
EF m
C= × (3)
ε 1000
where EF is the emissions factor for the fuel, ε is the L/kWh value calculated for the water
heater and m is the mass of the water heated.
The cost per cycle (P) of each water heater was calculated using the following formula.
cf
P= ×m (4)
ε
where c f is the cost of the fuel per kWh. For electricity, there are day and night rates, so the
formula for the electricity calculations is shown below.
cfD cfN
P= × mD + × mN (5)
ε ε
where c f D is the cost per kWh of electricity on the day rate, m D is the mass of the water
heated on the day rate. The subscript N denotes the same for the night rate.Sustainability 2021, 13, 5736 8 of 17
The area of the solar panels needed for the system, As , can be found using the
following formula.
E
As = × 0.7 (6)
cs
where cs is the solar collection of one square metre of solar panel, and 0.7 represents the
solar fraction used in this study.
The average energy generated by the solar installation is found by multiplying the
panel area by the average collection per square metre as shown below. This value was then
subtracted from the total energy needed to heat the water to find the total energy needed
from the backup system, EB .
Es = As × cs (7)
EB = E − Es (8)
2.5. Comparison Section
The systems which have been chosen to be compared to the heat pump are as follows:
electric, natural gas boiler, LPG instant water heater and a solar water heater with an
electric or natural gas backup. These systems have been chosen as they all offer different
benefits in terms of either fuel source, convenience or efficiency. Solar was chosen as it is
generally considered to be one of the most efficient methods of water heating, and the flat
plate collector in particular was chosen as flat plates systems are generally cheaper than
evacuated tube collectors, which make the cost of the system slightly more comparable to
the price of a heat pump water heater. In the literature, the electric backup tends to be seen
more than a gas backup for solar water heaters, but both were considered in this study, as
the author felt that a natural gas backup would be less carbon intensive than an electric
backup. Natural gas was chosen as gas boilers are less carbon intense than oil boilers and
have a lower cost. The LPG system was chosen as these systems offer instant hot water
which could be a good option for smaller farms with less water-heating requirements. The
electric option will also be considered as it is the most common type of water heater used
on dairy farms according to Upton’s report [14].
The comparison was performed on the basis of one full cycle of the heat pump to a
maximum of 80 ◦ C. The amount of usable water from the system from that cycle was used
as a comparison metric, and the other values for the heat pump were calculated using the
L/kWh figure. The other water heaters were compared to the heat pump in terms of how
many L/kWh those systems can produce in a full heating cycle. This method was chosen,
as it removes variables such as heat loss which cannot be estimated for the solar or natural
gas systems. The water was heated from 20 ◦ C to an average water temperature of 70.7 ◦ C.
By using the average temperature, the amount of energy and therefore energy-related
emissions of the other water heaters which those heaters would require to achieve with
the same amount of water at that average temperature will be calculated. The other metric
used to compare the systems is the cost per day, the formula for which can be seen in
Equation (5).
2.5.1. Gas Heating Option
The gas heating option considered is an instant water heater made by LPG Flogas. In
order to calculate the number of kilowatt hours (kWh) of gas burned to heat the water to
the required temperature, the energy formula in equation 1 was used, and an efficiency
of 90% was assigned to the gas heater, as this is the high end in terms of efficiency for gas
water heaters.
2.5.2. Solar with Electric or Gas Backup
In order to calculate the efficiency of a solar system with a backup heat source, first
the sizing of the solar system needed to be calculated. In order to calculate the size of
the system, the first step was to find the solar radiation for the summer period, as this isSustainability 2021, 13, 5736 9 of 17
the period where the solar radiation will be highest. By sizing the system based on the
maximum solar radiation the system will not be oversized, which in solar installations
could be very costly. This is because in oversized solar water-heating systems, at peak
solar radiation, stagnation occurs in the system resulting in irreparable damage to the
solar collectors.
By finding the average solar radiation per metre squared on a day during the summer,
the size of the system can be calculated by dividing the energy required for heating water
on an average day by the average solar radiation per meter squared during summer. This
gave the area of panels required to supply a 100% solar fraction. Solar water heaters
however are not designed to heat water to 80 ◦ C, so to accommodate for this the solar
fraction of the installation should be 70%. The remainder of the heating was done by
a backup source. Equation (6) shows the mathematical formulation of the calculations
described above. The area was rounded to the nearest whole number to give the number
of panels required.
To calculate an average day of heating with the designed solar system, the average
solar radiation for the year was divided by 365 to find the average solar radiation per metre
squared for a day in the year. This solar radiation value was multiplied by the efficiency
values for the collector and for the system which were taken from a paper by Duffy and
Ayompe [22], which was conducted in Dublin using flat plate collectors with an external
storage tank with an electric backup. The solar collection of one panel was then multiplied
by the calculated area of the solar installation to calculate the kWh of heat energy made up
by the solar system (see Equation (7)). The result of this calculation is a value for the total
amount of energy which will be stored in the water over a day by the solar installation.
By subtracting this value from the total amount of energy required to heat the water for
the given day, the amount of energy required from the backup source on that day can
be calculated (see Equation (8)). The amount of energy produced by the solar system is
considered free energy in terms of both cost and carbon emissions, so only the energy used
by the backup source is considered in the calculations for comparing the efficiency of the
system with the ASHPWH.
2.5.3. Calculation Methodology
The two metrics to be used to compare the systems are the carbon emissions and cost
per day, assuming daily water use of 397 L. By dividing the carbon intensity of the fuel for
each system (gCO2 eq/kWh) by the efficiency of that system (L/kWh), the carbon intensity
of each system (gCO2 eq/L) can be found. This is shown in a mathematical formulation in
Equation (3).
By dividing the cost per kWh of fuel (€/kWh) by the efficiency of each system (L/kWh),
the cost per litre can be found. This can be multiplied by the quantity of useable water
needed to find the cost per day of operating the system. The mathematical formulation of
this can be seen in Equation (4). To take into account the different cost rates of electricity,
Equation (5) should be used.
For the heat pump, it is possible that for some farmers using this system they could
operate using only the night rate of electricity, as heat loss from the system during the day
is minimal. To account for topping up the heat during the day with the electric heaters, it is
assumed that 25% of the electricity use will be during the day, meaning 75% will be on the
night rate. The rates of electricity cost used in the calculations are shown in Table 3.
Table 3. Conversion units and cost values.
Carbon Intensity Cost Per kWh
Fuel Source Cost Per kWh (Day)
(gCO2 eq/kWh) (Night)
Electricity 331 0.15 0.07
Gas 201 0.066 0.066
LPG 229 0.12 0.12Sustainability 2021, 13, 5736 10 of 17
It would be expected that most of the solar radiation will be absorbed by the system
after the first milking, and therefore most of the energy used by the electric backup would
be used in the night rate. To account for this, 75% of the energy used by the solar with
electric backup has been assigned to the night rate and 25% to the day rate.
In order to extrapolate the results to see the comparative yearly performance of the
systems, for the sake of simplicity the daily water use will be assumed to be the usable
water number calculated for the heat pump for a full cycle.
Electricity pricing comes from a report from J. Upton et al. which was presented at the
Teagasc National Dairy Conference [23]. The carbon intensity of the fuel sources comes
from the SEAI website which has the most up to date information which is from 2020 [2].
The price of natural gas and LPG comes from a domestic fuel cost comparison published
by SEAI [24].
3. Results
The tests carried out on the heat pump were done to benchmark its performance under
normal operating conditions. The results in Figure 6 show that the heat pump used in this
test had high efficiency at lower water temperatures with a COP of 4.3 for the temperature
range of 20–30 ◦ C. The efficiency of the heat pump reduced significantly as the temperature
of the water increased. This was expected, as the COP for heat pumps decreases as the
discharge temperature increases. Although the heat pump is more efficient than other water
heater technologies even at higher water temperatures, it is not as efficient as some of the
heat pumps which were seen in the literature such as one in the study by Ibrahim et al. [25]
where the COP of the heat pump was still greater than 2.5 at temperatures around 55 ◦ C.
The COP of 2.27 for a full cycle is also at the lower end of what was seen in the literature,
although most of the studies did not heat the water as high as 65 ◦ C, which did have an
impact on the results of the experiment. If the heat pump had been run to 55 ◦ C the COP
of the cycle would have been 2.66 which would be comparable with some of the studies
in the review of heat pump water heaters by Hepbasli et al. [26]. The performance of an
ASHPWH is dependent on ambient temperature and humidity and therefore the COP may
change throughout the year. For this reason, in cooler climates it has been seen that locating
an ASHPWH indoors can improve the average COP over the year and does not affect space
heating bills significantly [27]. Some of the studies cited in that review of water heaters
also began with lower initial water temperatures, which would result in a higher COP [26].
The temperature varies by month and by storage method, but a normal range for Ireland
is between 8 and 14 ◦ C [28]. In practice, the initial water temperature may be lower than
that used in this study but do not affect the overall findings. Although the COP of the heat
pump decreases significantly at higher water temperatures (see Table 4) it would still be
worth using the heat pump at these higher temperatures as the efficiency of the system is
still higher than it would be with an electric water heater.
Table 4. COP of heat pump.
Temperature Range COP
20–25 4.28
25–30 4.36
30–35 3.45
35–40 2.91
40–45 2.55
45–50 2.13
50–55 1.66
55–60 1.54
60–65 1.33
20–65 2.27Sustainability 2021, 13, x FOR PEER REVIEW 11 of 17
Sustainability 2021, 13, 5736 11 of 17
Water Temperature (ᵒC)
20 30 40 50 60
12 5.0
4.5
Energy Consumption (kWh)
10
4.0
3.5
8
Average COP
3.0
6 2.5
2.0
4
1.5
1.0
2
0.5
0 0.0
0 60 120 180 240 300 360 420
Time (m)
Heat Pump Energy (kWh) COP vs. Temperature
Energy performance
Figure6.6.Energy
Figure performance ofofheat
heatpump.
pump.
Another key performance indicator of any water-heating system is the time taken to
Table
heat4.the
COP of heat
water to a pump.
given temperature. The time taken to heat the water from 20–65 ◦ C was
6 h and 46 min. ThisTemperature
is a significant Range
amount of time, but it should be noted that COP the amount
of water being heated is also quite large at 450 L. The heat pump is significantly slower to
heat water than a typical gas20–25 boiler and the instant LPG instant water heater, and 4.28
therefore
the farmer should be aware of this and heat water in advance. The heat pump4.36
25–30 has a slow
rate of temperature loss, which 30–35can be seen from the orange line in Figure 7, and 3.45
therefore
in order to save energy costs, the heat pump system should be run to at least 65 ◦
35–40 2.91C at the
night rate of electricity. The 40–45
electric heaters can then be used to heat the water2.55 to useable
temperatures shortly before it is needed. In comparison to the other types of water heater,
45–50 2.13
a gas system would have greater heat losses as gas water-heater tanks are more difficult to
insulate due to the internal 50–55combustion. The instant water heater has no standby 1.66 losses,
which could mean that for small 55–60 farms with little water usage, such a system may 1.54be ideal.
A key performance metric for 60–65energy use in water heaters is sizing. If the system 1.33 is too
large it usually leads to excess energy
20–65 use over time. As more water is heated than
2.27needed,
heat loss from the system can be quite significant and therefore this is another important
factor for a farmer to consider.
Another key performance indicator of any water-heating system is the time taken to
Despite the heat pump using more energy towards the end of the cycle, the rate of
heat the water to
temperature a given
increase temperature.
falls, this means Thethat time taken
at higher to heat the water
temperatures, the heatfrom
pump20–65 °C was
uses
6 hours
more energy and takes longer to heat the water. It should be mentioned that when the heat that
and 46 minutes. This is a significant amount of time, but it should be noted
thepump
amount of water
is used to heatbeing heated
the water, the is alsoheats
water quiterelatively
large at uniformly.
450 L. TheThis heat pump isthe
is because signifi-
system
cantly uses atowrap-around
slower heat watercondenser which gas
than a typical can be seen and
boiler in Figure 5. The uniform
the instant heatingwater
LPG instant
of theand
heater, tanktherefore
was checked with a thermocouple
the farmer should be aware whichofwas
thisplaced nearwater
and heat the bottom of the The
in advance.
tank as seen in Figure 5.
heat pump has a slow rate of temperature loss, which can be seen from the orange line in
Figure 7, and therefore in order to save energy costs, the heat pump system should be run
to at least 65 °C at the night rate of electricity. The electric heaters can then be used to heat
the water to useable temperatures shortly before it is needed. In comparison to the other
types of water heater, a gas system would have greater heat losses as gas water-heater
tanks are more difficult to insulate due to the internal combustion. The instant water
heater has no standby losses, which could mean that for small farms with little water us-
age, such a system may be ideal. A key performance metric for energy use in water heaters
is sizing. If the system is too large it usually leads to excess energy use over time. As more
water is heated than needed, heat loss from the system can be quite significant and there-
fore this is another important factor for a farmer to consider.Despite the heat pump using more energy towards the end of the cycle, the rate of
temperature increase falls, this means that at higher temperatures, the heat pump uses
more energy and takes longer to heat the water. It should be mentioned that when the
heat pump is used to heat the water, the water heats relatively uniformly. This is because
the system uses a wrap-around condenser which can be seen in Figure 5. The uniform
Sustainability 2021, 13, 5736 12 of 17
heating of the tank was checked with a thermocouple which was placed near the bottom
of the tank as seen in Figure 5.
Time (days)
0 1 2 3 4 5 6 7 8 9 10 11 12 13
90
80
70
60
Temperature (ᵒC)
50
40
30
20
10
0
0 60 120 180 240 300 360 420 480 540 600 660 720 780 840 900 960 1020108011401200
Time (m)
Heating Cycle (m) Cooldown from 65 (days) Cooldown from 80 (days)
7. Heat
Figure 7.
Figure Heat pump
pumpheating
heatingand
andcooling
coolingcycles.
cycles.
With regards to the energy used for the full cycle, the total energy when only the top
With regards to the energy used for the full cycle, the total energy when only the top
heater was used was 12.4 kWh and using both heaters the energy used was 13.82 kWh, see
heater was used was 12.4 kWh and using both heaters the energy used was 13.82 kWh,
Table 5. This shows one potential issue with this system, which is that it will not heat the
see Table 5. This shows one potential issue with this system, which is that it will not heat
full tank to 80 ◦ C. The top heater heats only roughly the top third of the tank due to thermal
the
stratification, which°C.
full tank to 80 The top
means that heater
1.91 kWh heats only roughly
of energy is requiredthetotopheatthird
the oftopthe
thirdtank due to
of the
thermal
tank from 65–80 C, see Table 6. The energy consumption over time for both configurations top
stratification,
◦ which means that 1.91 kWh of energy is required to heat the
third of theintank
is shown Figure from 65–80
8. The °C, see
system hasTable 6. Thethermostat
a built-in energy consumption
which shutsover time
off the for both
system
configurations ◦
when it reaches 80 C. This is located near the top of the tank as shown in Figure 5 and off
is shown in Figure 8. The system has a built-in thermostat which shuts
the systemdue
therefore, whento theit reaches 80 °C. This is
thermal stratification in located
the tanknearcaused thebytop
theof topthe tank the
heater, as shown
whole in
Figure
tank is 5notandheated to 80 ◦ C.
therefore, due to the stratification
Thermal thermal stratification
is commonininthe water tank caused
heaters by the top
containing
multiple
heater, theheating
wholeelements,
tank is not particularly
heated to when80 °C.the tank has
Thermal a large aspect
stratification ratio and in
is common is an
water
important tool used in designing hot water tanks to reduce the
heaters containing multiple heating elements, particularly when the tank has a large as-need to reheat the whole
tankratio
pect [29]. and
One is wayan to solve thistool
important issue
usedwhich would alsohot
in designing improve
waterthe performance
tanks to reduce of thethe
need
heat pump system would be to mix the water while the emersion
to reheat the whole tank [29]. One way to solve this issue which would also improve heaters are being used, the
as this was noted
performance of thetoheatimprove
pumpthe L/kWh
system valuebeintoUpton’s
would mix thestudy
water[18].
while Thistheimproves
emersionthe heat-
performance of the system in terms of L/kWh as it ensures that the full tank is heated to the
ers are being used, as this was noted to improve the L/kWh value in Upton’s study [18].
set-point temperature. The difference in quantity of useable water is large, especially when
This improves the performance of the system in terms of L/kWh as it ensures that the full
considering that only 1.42 kWh more electricity is used to heat the remaining portion of the
tank is heated to the set-point temperature. The difference in quantity of useable water is
tank. The reason for this is that the useable water temperature in this study is considered
large,
aboveespecially
70 ◦ C, andwhen considering
therefore only thethat only 1.42
top portion ofkWh more
the tank electricity
can be consideredis used asto heat the
usable
remaining
water when portion
only the oftop
theheater
tank. The reason
is used for this
between is that
65 and 80 ◦the useable
C. The water energy
remaining temperature
used in
this
to heat the water to this temperature is not wasted, as the tank has a very low ratecan
study is considered above 70 °C, and therefore only the top portion of the tank of be
considered
temperature decline. As cold water enters the system, it will push the hotter water toThe
as usable water when only the top heater is used between 65 and 80 °C.
remaining
the top of theenergy
tank,used and to heat thethe
therefore water to this can
top heater temperature
be used again is nottowasted,
heat thisasportion
the tankof has
the tank.a very low rate of temperature decline. As cold water enters the system, it will push the
hotter water to the top of the tank, and therefore the top heater can be used again to heat
this portion of the tank.
Sustainability 2021, 13, 5736 13 of 17
Table 5. Full heating cycle energy performance.
Energy Consumed Useable
Configuration Time (h)
Table 5. Full heating Air Inperformance.
cycle energy (°C) L/kWh
(kWh) Water (L)
Configuration Time (h) 1 Air In (◦ C) 7.45 Energy Consumed
19.34 (kWh) 12.40 Water (L) 220L/kWh 17.74
Useable
1 7.45 2 19.34 7.47 19.34
12.40 13.83 220 397 17.74 28.70
2 7.47 19.34 13.83 397 28.70
Table 6. Electric heater energy use.
Table 6. Electric heater energy use.
Configuration Power (W) Time (m) Total Energy (J) Total Energy (kWh)
Configuration 1
Power (W) 2860
Time (m) 40 6,864,000
Total Energy (J) 1.91
Total Energy (kWh)
1 2860 2 4810 40 41.33 11,927,838
6,864,000 3.31
1.91
2 4810 41.33 11,927,838 3.31
16
14
Energy Consumption (kWh)
397L Useable Water
12
10
8
6
4 220L Useable Water
2
0
0 60 120 180 240 300 360 420 480
Time (m)
Configuartion 1 (kWh) Configuration 2 (kWh)
Figure8.8. System
Figure Systemenergy
energyperformance.
performance.
Comparison to Other Water Heaters
Comparison to Other Water Heaters
A system, capable of supplying up to 120 L of water at 85 ◦ C in 10 min, is an instant
water Aheater
system, capable
by LPG of [30].
Flogas supplying up tohas
The system 120 L ofefficiency
lower water atthan
85 °Cthe in 10 minutes,
ASHPWH. Thereis an
instant water heater by LPG Flogas [30]. The system has lower efficiency
is no information available regarding the efficiency of the system, but as it is a gas system, than the
ASHPWH.
an estimate Thereof 90%isefficiency
no information
has beenavailable
used. A 90% regarding thewill
efficiency efficiency
be assumedof theforsystem,
the gas but
as it is a gas system, an estimate of 90% efficiency has been used. ◦
boiler also. The heat pump meanwhile has a COP of 2.27 up to 65 C and then an electricA 90% efficiency will be
assumed
heater of for~99% theefficiency
gas boilerisalso.
usedThe heatthe
to heat pumpwatermeanwhile has atemperature.
to the set point COP of 2.27 The up to 65 °C
gas
and
systemthen an electric
however uses heater of ~99%
a less carbon efficiency
intensive fuel, is usedisto
which heat advantage
a clear the water over to the
theset point
heat
temperature.
pump system The in thegas system
current however
climate. One ofusestheamost
less obvious
carbon advantages
intensive fuel, which
of the is a clear
gas system
is that it canover
advantage produce waterpump
the heat much faster
system thanin the
theheat pump,
current which takes
climate. One of7.5the
h tomost
heat 397 L
obvious
of usable water from a starting temperature of 20 ◦ C.
advantages of the gas system is that it can produce water much faster than the heat pump,
whichThe other
takes 7.5water
hoursheater compared
to heat 397 L oftousable
the heat pump
water system
from was a solar
a starting flat plate collec-
temperature of 20 °C.
tor ofThe 2 . The method used to size the solar collector was described in the methodology
9 mother water heater compared to the heat pump system was a solar flat plate col-
sectionofand
lector 9 mthe solar
2. The radiation
method usedinformation
to size thewas taken
solar from the
collector wasMet Eireann website
described in the
in the methodol-
sunshine section [31]. Solar systems, similar to the heat pump system used in this study do
ogy section and the solar radiation information was taken from the Met Eireann website
not heat the water to useable temperatures. The majority of the heating is done by the solar
in the sunshine section [31]. Solar systems, similar to the heat pump system used in this
collector when the sun is shining but a backup heater is used to heat the water up to the
study
desired dotemperature.
not heat theBecause
water to useable
a lot of the temperatures.
water heating will Thebe majority
done byofthe the heating
backup is done
heater,
especially in winter and in overcast conditions, it is important that the backup heater is
efficient in terms of both cost and carbon emissions. Two backup heating options will be
considered in this comparison. The more common option is the electric backup heater, butSustainability 2021, 13, 5736 14 of 17
perhaps the more efficient and cost-effective option is a gas backup heater. Gas is cheaper
per kWh and is also a cleaner source of energy than electricity. In terms of a comparison
with the heat pump, both systems offer a renewable method of heating water, they both
take a relatively longer time to heat water unless the backup source is used and they are
both relatively expensive in comparison to the gas system. Both the heat pump and the
solar system could be more cost effective using the available government grants, which
would offset some of the difference in price.
First, comparing the performance of the systems with reference to their energy effi-
ciency and their carbon intensities—Table 7 shows the results of the calculations detailed in
the comparison section of the methodology section of the report. It can be seen from Table 7
that regarding efficiency, the heat pump has the highest efficiency in terms of L/kWh,
followed by the solar with electric backup. However, the solar with gas backup is more
efficient than the heat pump with respect to its carbon emissions. It contributes to 25% less
emissions when compared to the heat pump.
Table 7. Comparison of efficiency and carbon intensity and cost.
kgCO2 eq Per Running Cost Per
System L/kWh % Dif. V. HP % Dif. V. HP
Day Day (€)
Heat Pump 28.70 4.57 - 1.24 -
Electric Heater 16.74 7.85 72% 2.13 72%
LPG Instant Water Heater 15.22 5.98 31% 3.05 146%
Gas Boiler 15.22 5.24 15% 1.91 54%
Solar with Gas Backup 23.18 3.44 −25% 1.13 −9%
Solar with Electric Backup 26.91 4.88 7% 1.33 7%
The carbon intensity of natural gas is much less than that of the carbon intensity of
electricity, which is why the solar with gas backup is less carbon intensive than the solar
with electric backup. The solar with electric backup is more carbon intensive and less
fuel efficient than the heat pump, which is perhaps why it was deemed an unsuitable
investment option by Upton et al. [32]. The solar with electric backup was pointed to as
the most efficient option by Ibrahim et al. [25], but this is not the case in Ireland as Table 7
shows. In a country where the carbon intensity of electricity is lower and the solar radiation
is more constant throughout the year, it is possible that the solar with electric backup could
be the most efficient option.
It appears from the analysis of the results in Table 7 that the best overall option by
efficiency and carbon emissions is the solar with gas backup. The installation of this sort
of solar system may be unfeasible for a lot of farmers due to high initial costs, and if this
is the case the heat pump is the next best option. Because the heat pump can be installed
almost anywhere, and as it has a lower initial cost it would still be a very good option. The
gas system is also a good option as it compares very closely in terms of emissions with the
heat pump, which may not have been expected prior to the analysis. It should be pointed
out that this comparison is a high-level overview and does not go into the details that may
arise, like heat loss from the tanks and variability in terms of ambient temperature and
solar radiation. The heat pump is still likely to be related to less emissions over its life cycle
due to the ever-decreasing carbon intensity of electricity, which fell from 635 gCO2 /kWh
to 331 gCO2 /kWh from 2005 to 2020.
In terms of comparing the cost of the systems, Table 7 shows the results of the calcula-
tions discussed. All running costs shown in Table 7 are in euros. The cost of operating the
systems per litre and per day assuming that the amount of usable water heated is 397 L per
day is shown and this is extrapolated out to show the yearly cost under these conditions. It
can be seen that again the solar with gas backup performs better than the heat pump, but
the heat pump outperforms the other systems. If it was possible to operate the heat pump
on only night rate electricity it would be 17.5% cheaper to operate than the solar with gas
backup, but it is unlikely that this would be possible for dairy farmers unless there is onlySustainability 2021, 13, 5736 15 of 17
one milking carried out per day. Because the solar with gas backup system would be more
expensive to purchase and install than the heat pump, it is possible that the heat pump
would yield a better return on investment over its life cycle.
The solar with electric backup and the gas system are more expensive to operate than
the heat pump and they are also less efficient and more carbon intensive than the heat
pump, which means that they are probably not as good an investment idea as the heat
pump. It should also be pointed out that for small farms where hot water use is less than
around 200 L per day the instant gas heater could be a very good option. The overall cost
difference over the year period will decrease, and as the heat pump is more expensive to
purchase than the gas system it could be a better investment for the farmer.
The heat pump system offers some advantages over the water heaters traditionally
used in dairy farms. Its greater efficiency and cheaper running costs should serve as
motivation to implement these systems in dairy farms in Ireland and in other countries
with cool temperate climates. The higher efficiency of heat pumps is such that if 25% of
Irish dairy farmers switched from electric emersion heaters to heat pumps as much as
4.7 ktCO2 eq. could be saved per year. This would be a saving of roughly 3.2% of total
emissions from electricity use in dairy farms in Ireland. There are also some disadvantages
to the system such as long heating cycle times, but the inconvenience of this can be negated
by setting the system to heat water on a specific schedule to suit the milking times in the
dairy farm.
4. Conclusions
There are many ways to reduce the total carbon emissions that are released for the
production of energy, and all avenues to reducing these emissions should be explored.
Jevons paradox is apparent in our energy systems today, as we improve the efficiency
of each of the energy consuming systems we use, but the number of systems that we
use continues to increase. This is why it is important to reduce our emissions in all
ways including the production and use of electricity. The agriculture sector is the largest
contributor to Ireland’s GHG emissions, and although only 4% of these emissions are
energy related, an effort should be made to reduce these energy-related emissions where
possible. Within the dairy farming sector, which is the most carbon-intense sector within
agriculture, the third largest user of energy is water heating. The two larger energy
users, milk cooling and milk pumping have been made more efficient by using up-to-date
technology such as variable speed drives and plate pre-coolers. The same effort should
be made to reduce the carbon emissions related to water heating, and it appears that an
ASHPWH is a viable option to do this for all dairy farmers. The ASHPWH tested in this
study had a COP of 2.27, which was comparable with what was seen in the literature,
considering the water was heated to 65 ◦ C in this study. The ASHPWH when completing a
full cycle in configuration 1 was able to produce 28.7 litres of useable water per kWh of
energy used, while configuration 2 was able to produce 17.74 L/kWh. It was also noted
that adding a mixer to the tank which would be used to de-stratify the tank could be used
as a method to heat the full tank to the set-point temperature. The efficiency of heat pumps
varies based on many external factors such as ambient temperature and humidity, and
therefore its performance will change seasonally.
The heat pump system was compared to some of the current options used in dairy
farms and some of the other potential renewable energy methods which could be used to
reduce carbon emissions from water heating. The heat pump system performed better in
terms of cost and emissions than the current methods used in dairy farms. One system that
stood out by its comparative performance versus the heat pump was the solar water heater
with a gas backup. This system was marginally cheaper to run than the heat pump but
was 25% less carbon intense due to its less carbon intense fuel and benefit of using solar
which has zero emissions. This system would be more expensive to implement than the
ASHPWH which could serve as a barrier to entry for dairy farmers. It could be the topic of
further research to investigate using a life-cycle analysis which system would be best outYou can also read