Solar origins of a strong stealth CME detected by Solar Orbiter - Astronomy & Astrophysics
←
→
Page content transcription
If your browser does not render page correctly, please read the page content below
Astronomy & Astrophysics manuscript no. output                                                                                  ©ESO 2021
April 10, 2021

                                                          Letter to the Editor

    Solar origins of a strong stealth CME detected by Solar Orbiter
Jennifer O’Kane1 , Lucie M. Green1 , Emma E. Davies2 , Christian Möstl3 , Jürgen Hinterreiter3, 4 , Johan L. Freiherr von
                      Forstner5 , Andreas J. Weiss3, 4 , David M. Long1 , and Tanja Amerstorfer3

      1
          Mullard Space Science Laboratory, UCL, Holmbury St Mary, Dorking, Surrey, RH5 6NT, UK e-mail: ucasjro@ucl.ac.uk
      2
          Department of Physics, Imperial College London, London, UK
      3
          Space Research Institute, Austrian Academy of Sciences, Graz, Austria
      4
          Institute of Physics, University of Graz, Graz, Austria
      5
          Institut für Experimentelle und Angewandte Physik, Christian-Albrechts-Universität zu Kiel, Kiel, Germany

     April 10, 2021

                                                                ABSTRACT

     Aims. We aim to locate the origin of a stealth coronal mass ejection (CME) detected in situ by the MAG instrument on board Solar
     Orbiter and make connections between the CME observed at the Sun and the interplanetary CME (ICME) measured in situ.
     Methods. Remote sensing data were analysed using advanced image processing techniques to identify the source region of the stealth
     CME, and the global magnetic field at the time of the eruption was examined using potential field source surface (PFSS) models.
     The observations of the stealth CME at the Sun were compared with the magnetic field measured by the Solar Orbiter spacecraft, and
     plasma properties were measured by the Wind spacecraft.
     Results. The source of the CME is found to be a quiet Sun cavity in the northern hemisphere. We find that the stealth CME has a
     strong magnetic field in situ, despite originating from a quiet Sun region with an extremely weak magnetic field.
     Conclusions. The interaction of the ICME with its surrounding environment is the likely cause of a higher magnetic field strength
     measured in situ. Stealth CMEs require multi-wavelength and multi-viewpoint observations in order to confidently locate the source
     region; however, their elusive signatures still pose many problems for space weather forecasting. The findings have implications for
     Solar Orbiter observing sequences with instruments such as EUI that are designed to capture stealth CMEs.
     Key words. Sun: coronal mass ejections (CMEs) – Sun: corona – Sun: magnetic fields – Sun: heliosphere

1. Introduction                                                         image processing techniques can be used to identify observa-
                                                                        tional signatures, although these can be very faint and hard to de-
Coronal mass ejections (CMEs) are large eruptions of the Sun’s          tect (Alzate and Morgan 2017; O’Kane et al. 2019). Studies car-
plasma and magnetic field into the heliosphere. If they are Earth-      ried out so far indicate that stealth CMEs may originate at rela-
directed, these events have the potential to drive space weather        tively high heights ≈ 1.3 R in the corona (Robbrecht et al. 2009;
effects. A subset of interplanetary CMEs (ICMEs), known as              O’Kane et al. 2021), implying that the eruptive structure has a
magnetic clouds, exhibit enhanced magnetic field strength, a ro-        relatively low magnetic field strength and low plasma density,
tation in at least one of the magnetic field components, and low        leading to a correspondingly low energy release, lack of strong
plasma density, temperature, and plasma β when detected in situ         radiative emissions, and lower propagation speed (
A&A proofs: manuscript no. output

                                                                                      20                                                    Btot
made possible using advanced image processing techniques. The                              Solar Orbiter
paper is organised as follows: Sect. 2 describes the in situ and re-                  10                                                    BR
                                                                                                                                            BT

                                                                       B [nT, RTN]
mote sensing data as well as the methods used within this study;
                                                                                       0                                                    BN
Sect. 3 describes the analysis of the stealth CME connecting the
in situ and the solar source perspectives; and finally Sect. 4 dis-
                                                                                      10
cusses the results and conclusions.
                                                                                      20
                                                                                     2020-04-18 2020-04-19 2020-04-20 2020-04-21 2020-04-22 2020-04-23
2. Data and methods                                                                   20                                                    Btot
                                                                                          Wind
2.1. Data                                                                             10                                                    BR
                                                                                                                                            BT

                                                                       B [nT, RTN]
For the in situ analysis, magnetic field data were obtained from                       0                                                    BN
the magnetometer (MAG; Horbury et al. 2020) on board Solar
Orbiter (Müller et al. 2020), which provides in situ observations                     10
of the CME at approximately 0.8 AU. The magnetic field inves-                         20
tigation (MFI; Lepping et al. 1995) and solar wind experiment                        2020-04-18 2020-04-19 2020-04-20 2020-04-21 2020-04-22 2020-04-23
(SWE; Ogilvie et al. 1995) of the Wind spacecraft provide mag-                       600                                                          120
                                                                                     500 Wind
                                                                                                                                             Vp
netic field and solar wind plasma observations at 1 AU.                                                                                           100
    For the remote sensing observations, the white light CME                         400                                                          80

                                                                                                                                                     Np [cm 3]
                                                                        V [kms 1]
was analysed using data from the Large Angle and Spectrometric                       300                                                          60
COronagraph (LASCO; Brueckner et al. 1995) on board the SO-
lar and Heliospheric Observatory (SOHO; Domingo et al. 1995)                         200                                                          40
and the COR1 and 2 coronagraphs (part of the Sun Earth Con-                          100                                                     Np 20
nection Coronal and Heliospheric Investigation instrument suite,                       0                                                          0
                                                                                     2020-04-18 2020-04-19 2020-04-20 2020-04-21 2020-04-22 2020-04-23
SECCHI, Howard et al. 2008) on board the Solar TErrestrial
Relations Observatory Ahead (STEREO-A, Kaiser et al. 2008)                 Fig. 1. In situ observations of the CME. In each panel, the shock front
spacecraft. EUV data were taken from the Atmospheric Imag-                 is delineated by the solid vertical line, and the magnetic flux rope
ing Assembly (AIA, Lemen et al. 2011) on board the Solar Dy-               boundaries are shown by the vertical dashed lines. Top panel: Solar
namics Observatory (SDO, Pesnell et al. 2011) spacecraft, and              Orbiter magnetic field data in radial-tangential-normal (RTN) coordi-
the Extreme Ultraviolet Imager (EUVI; Howard et al. 2008) on               nates, where the total magnetic field magnitude is shown in black and
                                                                           the magnetic field components, RTN, are in red, green, and blue, re-
board STEREO-A. Line of sight magnetic field data were taken
                                                                           spectively. Middle panel: Wind magnetic field data in RTN coordinates,
from the Helioseismic and Magnetic Imager (HMI) data (Scher-               displayed similarly to that of Solar Orbiter. Bottom panel: The proton
rer et al. 2012) on board SDO.                                             speed (black) and density (red) measured by Wind.

2.2. Methods
Coronagraph data were processed using the Normalising-Radial-              by Wind (0.996 AU) at 01:34 UT on 20 April 2020, arriving with
Graded Filter (NRGF, Morgan et al. 2006). EUV data were                    a mean proton speed of 346 km s−1 .
processed using both the Multi-scale Gaussian Normalisation                    The in situ data reveal a clear magnetic flux rope structure,
(MGN) technique (Morgan and Druckmüller 2014) and the                      constrained by the vertical dashed lines in Fig. 1, where the lead-
NRGF technique. Stack plots were created using COR1 and                    ing edge times of the magnetic flux rope are 08:59 UT on 19
COR2 data by taking a radial slice from Sun centre. The slice              April 2020 at Solar Orbiter and 07:56 UT on 20 April 2020 at
taken at 90◦ is presented in this paper, as this most clearly shows        Wind (defined by Davies et al. 2021). The CME can be classi-
the CME curve. The plane-of-sky kinematics were obtained us-               fied as a magnetic cloud, meeting criteria detailed by Burlaga
ing the Savitzky-Golay bootstrapping technique (Byrne et al.               et al. (1981a). The configuration of the magnetic flux rope can
2013), and the 3D shape and orientation of the CME in the COR2             be classified as south-east-north (Bothmer and Schwenn 1998;
and LASCO/C2 fields of view were modelled using the gradu-                 Mulligan et al. 1998) and, therefore, has left-handed chirality
ated cylindrical shell (GCS) model (Thernisien et al. 2006; Frei-          and the flux rope axis is of low inclination to the ecliptic plane.
herr von Forstner 2021). Longitude and latitude are defined in                 The maximum magnetic field strength reached within the
Carrington coordinates.                                                    magnetic flux rope was 20.1 nT at Solar Orbiter and 16.3 nT
                                                                           at Wind. This is a relatively high field strength for an ICME at
                                                                           solar minimum and/or from quiet Sun regions. The proton den-
3. The stealth CME                                                         sity of the magnetic flux rope measured at Wind was relatively
3.1. In situ observations                                                  low throughout, with a mean density of 11.6 cm−3 ; however, this
                                                                           includes the rise in density towards the trailing edge (discounting
In situ magnetic field signatures observed by both Solar Or-               this rise, the mean density in the flux rope is 8.3 cm−3 ). The rise
biter and Wind as well as the solar wind plasma data observed              in density towards the trailing edge is likely due to a compression
by Wind whilst the spacecraft were close to radial alignment,              of the magnetic flux rope caused by the high speed stream that
but separated in longitude by less than 5◦ , are shown in Fig. 1.          follows, which we observe at Wind to have a mean proton speed
The shock front (delineated by the solid vertical line in Fig. 1)          of ∼450 km s−1 . The high speed stream may also be the rea-
driven by the CME was first observed in situ by Solar Orbiter at           son we observe a stronger magnetic field strength than expected
05:06 UT on 19 April 2020 whilst the spacecraft was located at a           within the CME, where the mean magnetic field strength of the
heliocentric distance of 0.809 AU. The shock was then observed             flux rope (18.4 nT at Solar Orbiter and 13.6 nT at Wind) is much
Article number, page 2 of 7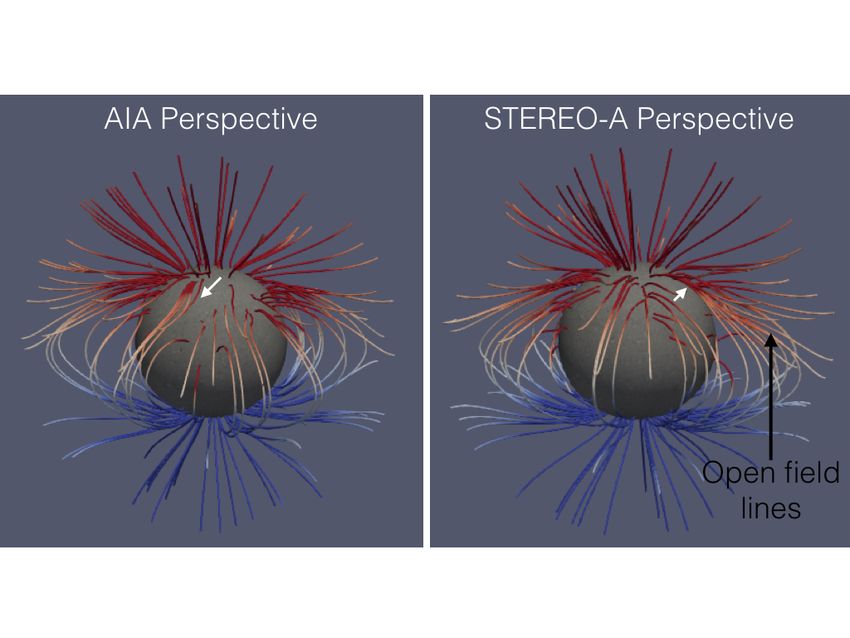
Jennifer O’Kane et al.: Solar origins of a strong stealth CME detected by Solar Orbiter

                          EUVI−A 171Å 13−April−2020 12:09 UT                                              COR1-A Stack Plot
                            COR1−A 14−April−2020 03:15 UT
                         2000
                                                                                     3.5

                         1000
                                                                                     3.0

                                                                      Height (RO•)
           Y (arcsec)

                            0                                                        2.5

                        −1000                                                        2.0

                        −2000                                                        1.5
                             0    1000      2000      3000                                 00:00    12:00     00:00   12:00    00:00     12:00
                                         X (arcsec)                                                    Start Time (12-Apr-20 17:47:34)

Fig. 2. Left: Combined EUVI-A 171Å and COR1-A, illustrating the connectivity between the high altitude structures observed in EUVI-A and the
CME observed in COR1-A. The EUVI-A image was taken at 22:09 UT 13 April 2020, when the cavity was observed, whilst the COR1-A image
was taken at 03:15 UT 14 April 2020, when the CME eruption was underway. The blue line represents the 90◦ slice taken for the stack plot. Right:
A stack plot inverse image of COR1-A, taken at an angle of 90◦ , showing the CME curve. The blue crosses indicate the points selected to track
the CME curve.

stronger than those calculated for ICMEs at similar heliocentric                           das and Romashets 2017), with the parameters derived from the
distances (e.g. Janvier et al. 2019).                                                      3DCORE fit,
     The magnetic field profiles observed at both spacecraft show
a slight decline in magnetic field strength as the flux rope passes                                πB1AU
                                                                                           Φax =         ln(1 + τ1AU D1AU /2),                                  (1)
over the spacecraft. Such asymmetric profiles are consistent with                                   τ1AU
the model of an expanding flux rope (Nieves-Chinchilla et al.
2018; Janvier et al. 2019). However, the proton speed profile of                           gives Φax = 0.33+0.16
                                                                                                             −0.13 × 10
                                                                                                                       21
                                                                                                                          Mx, which is consistent with the
the CME observed at Wind shows only a small decline through-                               numerical result; although, this should in general be seen only
out the magnetic flux rope. Asymmetric magnetic field profiles                             as a rough approximation because the flux rope cross section
with a relatively small expansion may correspond to ICMEs                                  in 3DCORE is not cylindrical, but elliptical. The axial flux we
with distorted structures (Nieves-Chinchilla et al. 2018), as ob-                          determined for this event is thus at the lower end of reported
served in images taken by the STEREO-A Heliospheric Imager                                 axial fluxes in ICME flux ropes (cf. Qiu et al. 2007).
(HI) of this event (Davies et al. 2021). The mean propagation
speed of the leading edge between Solar Orbiter and Wind was                               3.2. Stealth CME source region
341 km s−1 , assuming a constant transit velocity would suggest
a CME onset time ∼5 days prior to its arrival at Wind (i.e. on 15                          As seen in Fig.2, the stealth CME is observed in COR1-A as
April 2020).                                                                               a faint enhancement in density, and it becomes clear in COR2-
     We have applied a semi-empirical 3D flux rope model to the                            A by 03:54 UT 15 April 2020, following the brightening and
Solar Orbiter data (3DCORE, Möstl et al. 2018; Weiss et al.                                swelling of a streamer. The CME exhibits a bright underside and
2021) in order to derive global parameters of the flux rope within                         a clear concave-up structure, which is suggestive of a flux rope
this ICME. Detailed results are given in Davies et al. (2021) and                          configuration (Vourlidas et al. 2013) . In COR1-A, the underside
Freiherr von Forstner et al. (2021), and work on a paper on si-                            of the CME can be clearly tracked from 10:16 UT 14 April 2020
multaneous multi-point fitting of the Solar Orbiter, Wind, and                             (Fig.2), using the 90◦ slice, and it has an average velocity of
BepiColombo flux rope magnetic field data is underway (Weiss                               18 km s−1 . Using this speed and a height of 2.5 R at 22:30 UT
et al. 2021b, in prep.). Here we present additional information                            14 April 2020, we estimate a more accurate CME onset time of
on the magnetic flux derived from the 3DCORE fit on the Solar                              ∼19:30 UT 13 April 2020. In COR2-A, the CME has an average
Orbiter MAG data only. This is of particular interest because for                          speed of 53 km s−1 . The increase in CME speed between that
stealth CMEs, large-scale magnetic reconnection during flares                              measured from COR2-A and that measured in situ at Wind is
can be ruled out as a formation mechanism of the flux rope (e.g.                           likely due to the high speed stream following the CME and the
Qiu et al. 2007; Möstl et al. 2009), and this yields parameters of                         background solar wind.
a flux rope that was pre-existing in the solar corona.                                         Primary observations of the Sun during this time period show
     Davies et al. (2021) report the fit results with the 3DCORE                           no active regions, and the photospheric magnetic field exhibited
technique applied to the Solar Orbiter data, propagated to 1 AU:                           only weak small-scale field fragments (see Fig. 3). EUV and H-
an axial field strength of B0 = 14.3 ± 0.9 nT, a flux rope diame-                          alpha data showed that no filaments or filament channels were
ter of D1AU = 0.114 ± 0.022 AU, and a twist of τ = −3.7 ± 0.6                              present either, making the source region of the CME very chal-
field line turns over the full torus (τ < 0 implies left-handed                            lenging to identify. Using the images from COR2-A and C2 at
chirality), or τ1AU = −0.6 ± 0.1 turns per AU. We have numer-                              05:39 UT and 05:36 UT 15 April 2020, respectively, the CME
ically integrated the flux rope cross section to find an axial flux                        was fitted with the GCS model (see Fig.4). The GCS fit found
of Φax = 0.30 ± 0.06 × 10²¹ Mx. The application of the formula                             an approximate source region at 143±7◦ longitude and 3±3◦ lat-
for a uniform twist cylindrical flux rope (e.g. equation 16 in Van-                        itude (see Table 2 in Freiherr von Forstner et al. 2021), and it is
                                                                                                                                         Article number, page 3 of 7
A&A proofs: manuscript no. output
HMI 13−April−2020 20:00 UT AIA 193Å 13−April−2020 20:00 UT
800 800
600 600
400 400
Y (arcsec)
Y (arcsec)
200 200
0 0
−200 −200
−600 −400 −200 −0 200 400 600 −600 −400 −200 −0 200 400 600
X (arcsec) X (arcsec)
Fig. 3. Left: HMI image at 20:00 UT 13 April 2020, showing the magnetic field just before the cavity began to rise. The blue ’X’ marks the
location of the GCS approximated source region, whilst the red box marks the approximate location of the cavity that was observed at the solar
limb. Right: Corresponding AIA 193Å image, with the GCS and cavity regions being highlighted as before. In both figures, the limb of EUVI-A
is over-plotted as the white line.
COR2-A LASCO-C2 therefore deduce that this is the cavity responsible for the CME
2020-04-15 05:39 UT 2020-04-15 05:36 UT that is later detected in situ. The deflection of the cavity was
measured by applying the GCS model to the structure in 171 Å
EUVI-A. The cavity is observed to deflect southwards by ∼19◦
within the EUVI FOV, and a further ∼12◦ into the FOV of COR1.
It is noted that due to applying the GCS model to one spacecraft
instead of two, errors are larger. However, this is smaller for lat-
itude such that the deflection can be measured with reasonable
confidence.
The cavity is an observational signature of a flux rope present
in the low corona as the eruption takes place. We tracked the re-
gion back to the eastern limb of SDO to look for evidence of
the flux rope present prior to the eruption. Three cavities are ob-
served on the limb in AIA 171 Å between 6 and 10 April 2020.
The first cavity at 10◦ latitude erupted off limb on 8 April 2020,
and therefore was ruled out as being the source. The second cav-
ity at 40◦ latitude, which is highlighted by the red-dashed circle
in Fig. 6, closely matches the erupting cavity observed in EUVI-
A (at 35.7◦ latitude) and with its approximate longitude. The
Fig. 4. Remote sensing observations of the CME. STEREO-A COR2 third cavity at 30◦ latitude does not match in longitudinal ex-
(direct images) and SOHO LASCO C2 (running difference images). In tent with the cavity observed at the limb of EUIV-A. Thus we
the bottom panels, the GCS fitting according to the parameters obtained conclude the second cavity observed is the structure that later
by Freiherr von Forstner et al. (2021) is indicated by the blue mesh. erupts as the stealth CME. Using these two observations, we ob-
tain an approximate source region from the SDO perspective as
139◦ ±5◦ longitude and 38◦ ±2◦ latitude, indicated by the red box
indicated by the blue cross in Fig. 3. This puts the approximate in Fig. 3. The difference between the source region and the es-
source region on disk from SDO, and on limb from STEREO-A. timated region obtained from the GCS is due to the southwards
deflection of the cavity as it erupts.
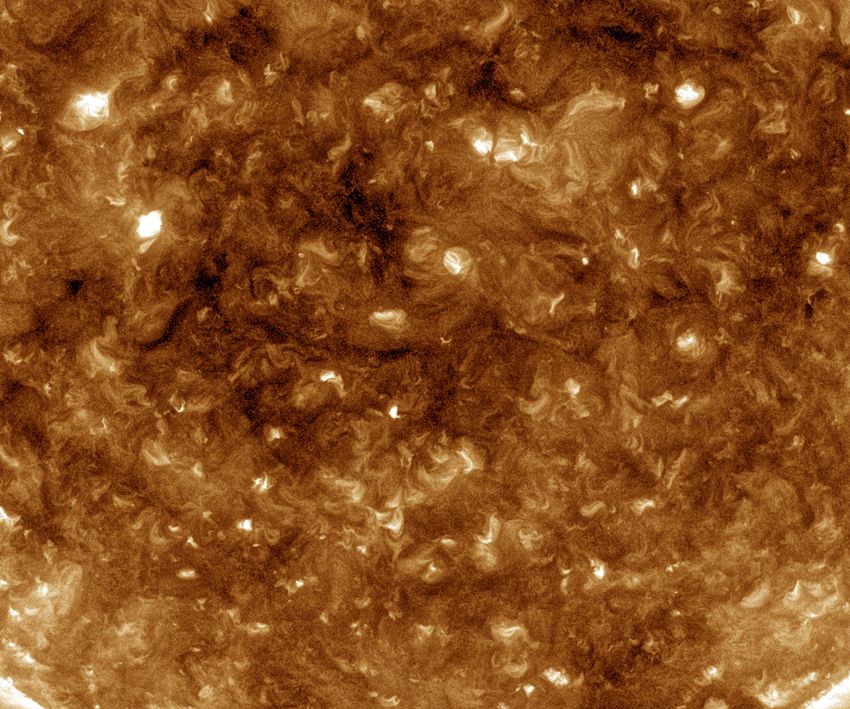
Although both the MGN and difference imaging techniques
were applied to each AIA passband, they did not reveal any clear We further investigated the magnetic topology of the source
eruption signatures on disk. However, the NRGF and MGN pro- region and its surrounding environment with a potential field
cessed 195 Å and 171 Å EUVI-A data revealed multiple high- source surface (PFSS) model, using the PFSS solver in Python
altitude dynamic structures off the solar limb, including a bright (pfsspy, Yeates 2018; Stansby 2019). Fig. 7 shows the PFSS
looped region, a large bright structure, and a cavity structure model as viewed from both the AIA (left) and STEREO-A
(Fig. 5). The large bright structure is observed from 08:50 UT (right) perspectives, with the modelled magnetic field lines
13 April 2020, and then it slowly rises into COR1-A, coinciding showing the positive (red) and negative (blue) polarities. The
with the brightening and swelling of the streamer. The concave- CME originates in the northern hemisphere, near the central
up cavity structure is observed from 22:09 UT 13 April 2020 at meridian (west limb) from the AIA (STEREO-A) perspective.
35.7◦ latitude, and it is deflected southwards as it erupts from Open field lines are deflected southwards, towards the equator,
the Sun, coinciding with initiation of the CME in COR1-A. We similar to the trajectory of the cavity observed in EUVI-A. Given
Article number, page 4 of 7Jennifer O’Kane et al.: Solar origins of a strong stealth CME detected by Solar Orbiter
EUVI−A 171Å 12−April−2020 02:09 UT EUVI−A 171Å 13−April−2020 14:09 UT EUVI−A 171Å 13−April−2020 22:09 UT
800 800 800
600 600 600
400 400 400
Y (arcsec)
Y (arcsec)
Y (arcsec)
200 200 200
0 0 0
−200 −200 −200
400 600 800 1000 1200 1400 400 600 800 1000 1200 1400 400 600 800 1000 1200 1400
X (arcsec) X (arcsec) X (arcsec)
Fig. 5. MGN processed EUVI-A 171Å images, illustrating the structures contributing to the stealth CME. Left panel: The red arrows point out
a bright loop structure that is above filament material. Middle panel: The large bright high altitude structure, illustrated by the red arrows. Right
panel: The cavity structure, highlighted by the red-dashed circle.
cantly higher than that found in a comparison study of stealth
CMEs at solar minimum by Kilpua et al. (2014), who show an
AIA 171Å 7−April−2020 19:00 UT average Bmax of 9.7 nT across a sample of ten stealth CMEs,
1000
and the in situ stealth CME study of Nieves-Chinchilla et al.
(2013). This maximum field strength and the south-east-north
800 configuration of the flux rope may have been the deciding fac-
tors in this event producing a category G1 geomagnetic storm.
600 The slow speed of stealth CMEs means that we do not typically
expect them to drive shocks. In this event, a forward shock is
Y (arcsec)
detected in situ, similar to the case of the stealth CME stud-
400
ied in Nieves-Chinchilla et al. (2013). The shock is likely due
to the slower solar wind conditions at 1 AU ahead of the ICME
200 (∼300 km s−1 ). Also, the slight expansion in the unperturbed sec-
tion of the ICME means that a combination of a relatively slow
0 solar wind speed ahead of the CME and the CME expansion may
drive the shock as proposed by Lugaz et al. (2017).
This study reinforces the need for multi-wavelength, multi-
−200
−1200 −1000 −800 −600 −400 −200 −0
view point observations of the solar corona, combined with im-
X (arcsec) age processing techniques, to further our ability to detect and
analyse stealth CME source regions. These observations indi-
cate that for Solar Orbiter EUI to successfully observe stealth
Fig. 6. MGN-processed AIA 171Å image at 19:00 UT 7 April 2020, CME sources, observing sequences should include regular syn-
showing the cavity structure observed on the limb (red-dashed circle) optic images from the 174 Å waveband of the Full Sun Imager
∼6 days before the eruption. (FSI) telescope, which will have a field-of-view of 4 R at peri-
helion.
the absence of active regions and the solar minimum phase at this Acknowledgements. JO thanks the STFC for support via funding given in her
time, the global magnetic field is close to that of a dipole field. PHD studentship. LMG is grateful to the Royal Society, which supported this re-
search through the Royal Society University Research Fellowship scheme. DML
is grateful to the Science Technology and Facilities Council for the award of an
Ernest Rutherford Fellowship (ST/R003246/1). JvF thanks the German Space
4. Discussion and conclusions Agency (Deutsches Zentrum für Luft- und Raumfahrt e.V., DLR) for their sup-
port of his work on the Solar Orbiter EPD team under grant 50OT2002. CM,
Here, we present a study of the first stealth CME observed in situ AJW, JH and TA thank the Austrian Science Fund (FWF): P31521-N27, P31659-
by Solar Orbiter, with accompanying Wind in situ observations N27, P31265-N27. ED is supported by funding from the Science and Technol-
and STEREO-A and SDO remote sensing data. The combined ogy Facilities Council (STFC) studentship ST/N504336/1. SDO is a mission of
use of STEREO-A and SDO data revealed that the origin of the NASA’s Living With a Star Program. STEREO is the third mission in NASA’s
Solar Terrestrial Probes program. SOHO is a mission of international coopera-
CME was a quiet Sun cavity within small-scale magnetic field tion between ESA and NASA. The authors thank the SDO, STEREO, and SOHO
and that there was no clear polarity inversion line. The cavity teams for making their data publicly accessible.The Solar Orbiter magnetometer
identified in EUVI-A and AIA 171 Å passbands extended up was funded by the UK Space Agency (grant ST/T001062/1). Its data are avail-
to 1.3 R (from Sun centre) in the corona. Such dark elliptical able in the Solar Orbiter Archive at http://soar.esac.esa.int/soar/.
cavities in the quiet Sun indicate the presence of a magnetic flux
rope and have been found to have a median height of 1.2 R
(Gibson 2015). References
Despite the quiet Sun origin of the stealth CME, the mag- Alzate, N. and Morgan, H. (2017), ‘Identification of low coronal sources of
netic cloud still had a very high field strength in the interplan- “stealth” coronal mass ejections using new image processing techniques’, The
etary medium (13.6 nT at Wind). The ∼1 AU value is signifi- Astrophysical Journal 840(2), 103.
Article number, page 5 of 7A&A proofs: manuscript no. output Fig. 7. PFSS model of Carrington rotation 2229, as observed from the AIA perspective (left) and STEREO-A perspective (right). Positive (negative) polarity is coloured in red (blue), on 13 April 2020. The approximate source region of the stealth CME is indicated by the white arrows. Bothmer, V. and Schwenn, R. (1998), ‘The structure and origin of magnetic Goldstein, M. L., Hoeksema, T., Lockwood, M., Magnes, W., Maksimovic, clouds in the solar wind’, Ann. Geophys. 16, 1–24. M., Marsch, E., Matthaeus, W. H., Murphy, N., Nakariakov, V. M., Owen, Brueckner, G., Howard, R., Koomen, M., Korendyke, C., Michels, D., Moses, C. J., Owens, M., Rodriguez-Pacheco, J., Richter, I., Riley, P., Russell, C. T., J., Socker, D., Dere, K., Lamy, P., Llebaria, A. et al. (1995), The large an- Schwartz, S., Vainio, R., Velli, M., Vennerstrom, S., Walsh, R., Wimmer- gle spectroscopic coronagraph (lasco), in ‘The SOHO Mission’, Springer, Schweingruber, R. F., Zank, G., Müller, D., Zouganelis, I. and Walsh, A. P. pp. 357–402. (2020), ‘The Solar Orbiter magnetometer’, A&A 642, A9. Burlaga, L., Sittler, E., Mariani, F. and Schwenn, a. R. (1981a), ‘Magnetic loop Howard, R. A., Moses, J. D., Vourlidas, A., Newmark, J., Socker, D., Plunkett, behind an interplanetary shock: Voyager, helios, and imp 8 observations’, S., Korendyke, C., Cook, J., Hurley, A., Davila, J. et al. (2008), ‘Sun earth Journal of Geophysical Research: Space Physics 86(A8), 6673–6684. connection coronal and heliospheric investigation (secchi)’, Space Science Burlaga, L., Sittler, E., Mariani, F. and Schwenn, R. (1981b), ‘Magnetic loop Reviews 136(1-4), 67. behind an interplanetary shock: Voyager, Helios, and IMP 8 observations’, Howard, T. A. and Harrison, R. A. (2013), ‘Stealth coronal mass ejections: A J. Geophys. Res. 86(A8), 6673–6684. perspective’, Solar Physics 285(1-2), 269–280. Byrne, J., Long, D., Gallagher, P., Bloomfield, D., Maloney, S., McAteer, R., Janvier, M., Winslow, R. M., Good, S., Bonhomme, E., Démoulin, P., Dasso, S., Morgan, H. and Habbal, S. R. (2013), ‘Improved methods for determining Möstl, C., Lugaz, N., Amerstorfer, T., Soubrié, E. and Boakes, P. D. (2019), the kinematics of coronal mass ejections and coronal waves’, Astronomy & ‘Generic Magnetic Field Intensity Profiles of Interplanetary Coronal Mass Astrophysics 557, A96. Ejections at Mercury, Venus, and Earth From Superposed Epoch Analyses’, Davies, E. E., Möstl, C., Owens, M. J., Weiss, A., Amerstorfer, T., Hinterreiter, J., Journal of Geophysical Research (Space Physics) 124(2), 812–836. Bauer, M., Bailey, R. et al. (2021), ‘In situ multi-spacecraft and remote imag- Kaiser, M. L., Kucera, T., Davila, J., Cyr, O. S., Guhathakurta, M. and Chris- ing observations of the first cme detected by solar orbiter and bepicolombo’, tian, E. (2008), ‘The stereo mission: An introduction’, Space Science Reviews A&A . 136(1-4), 5–16. URL: https://doi.org/10.1051/0004-6361/202040113 Kilpua, E., Mierla, M., Zhukov, A., Rodriguez, L., Vourlidas, A. and Wood, B. D’Huys, E., Seaton, D., Poedts, S. and Berghmans, D. (2014), ‘Observational (2014), ‘Solar sources of interplanetary coronal mass ejections during the so- characteristics of coronal mass ejections without low-coronal signatures’, The lar cycle 23/24 minimum’, Solar Physics 289(10), 3773–3797. Astrophysical Journal 795(1), 49. Lemen, J. R., Akin, D. J., Boerner, P. F., Chou, C., Drake, J. F., Duncan, D. W., Domingo, V., Fleck, B. and Poland, A. I. (1995), ‘The soho mission: an Edwards, C. G., Friedlaender, F. M., Heyman, G. F., Hurlburt, N. E. et al. overview’, Solar Physics 162(1-2), 1–37. (2011), The atmospheric imaging assembly (aia) on the solar dynamics ob- Freiherr von Forstner, J. L. (2021), ‘johan12345/gcs_python: Version 0.2.0’. servatory (sdo), in ‘The Solar Dynamics Observatory’, Springer, pp. 17–40. URL: https://doi.org/10.5281/zenodo.4443203 Lepping, R. P., Acũna, M. H., Burlaga, L. F., Farrell, W. M., Slavin, J. A., Schat- Freiherr von Forstner, J. L., Dumbović, M., Möstl, C., Guo, J., Papaioannou, ten, K. H., Mariani, F., Ness, N. F., Neubauer, F. M., Whang, Y. C., Byrnes, A., Elftmann, R., Xu, Z., Terasa, J. C., Kollhoff, A., Wimmer-Schweingruber, J. B., Kennon, R. S., Panetta, P. V., Scheifele, J. and Worley, E. M. (1995), R. F., Rodríguez-Pacheco, J., Weiss, A. J., Hinterreiter, J., Amerstorfer, T., ‘The Wind Magnetic Field Investigation’, Space Sci. Rev. 71, 207–229. Bauer, M., Belov, A. V. et al. (2021), ‘Radial evolution of the april 2020 Lugaz, N., Farrugia, C. J., Winslow, R. M., Small, C. R., Manion, T. and Savani, stealth coronal mass ejection between 0.8 and 1 au. comparison of forbush N. P. (2017), ‘Importance of CME Radial Expansion on the Ability of Slow decreases at solar orbiter and near the earth’, A&A . CMEs to Drive Shocks’, ApJ 848(2), 75. URL: https://doi.org/10.1051/0004-6361/202039848 Morgan, H. and Druckmüller, M. (2014), ‘Multi-scale gaussian normalization Gibson, S. (2015), Coronal Cavities: Observations and Implications for the for solar image processing’, Solar physics 289(8), 2945–2955. Magnetic Environment of Prominences, Vol. 415, p. 323. Morgan, H., Habbal, S. R. and Woo, R. (2006), ‘The depiction of coronal struc- Green, L., Torok, T., Vršnak, B., Manchester, I., Veronig, A. et al. (2018), ‘The ture in white-light images’, Solar Physics 236(2), 263–272. origin, early evolution and predictability of solar eruptions’, arXiv preprint Möstl, C., Amerstorfer, T., Palmerio, E., Isavnin, A., Farrugia, C. J., Lowder, C., arXiv:1801.04608 . Winslow, R. M., Donnerer, J. M., Kilpua, E. K. J. and Boakes, P. D. (2018), Horbury, T. S., O’Brien, H., Carrasco Blazquez, I., Bendyk, M., Brown, P., Hud- ‘Forward Modeling of Coronal Mass Ejection Flux Ropes in the Inner Helio- son, R., Evans, V., Oddy, T. M., Carr, C. M., Beek, T. J., Cupido, E., Bhat- sphere with 3DCORE’, Space Weather 16(3), 216–229. tacharya, S., Dominguez, J. A., Matthews, L., Myklebust, V. R., Whiteside, Möstl, C., Farrugia, C. J., Miklenic, C., Temmer, M., Galvin, A. B., Luhmann, B., Bale, S. D., Baumjohann, W., Burgess, D., Carbone, V., Cargill, P., East- J. G., Kilpua, E. K. J., Leitner, M., Nieves-Chinchilla, T., Veronig, A. and wood, J., Erdös, G., Fletcher, L., Forsyth, R., Giacalone, J., Glassmeier, K. H., Biernat, H. K. (2009), ‘Multispacecraft recovery of a magnetic cloud and its Article number, page 6 of 7
Jennifer O’Kane et al.: Solar origins of a strong stealth CME detected by Solar Orbiter

   origin from magnetic reconnection on the Sun’, Journal of Geophysical Re-
   search (Space Physics) 114(A4), A04102.
Müller, D., Cyr, O. S., Zouganelis, I., Gilbert, H. R., Marsden, R., Nieves-
   Chinchilla, T., Antonucci, E., Auchère, F., Berghmans, D., Horbury, T. et al.
   (2020), ‘The solar orbiter mission-science overview’, Astronomy & Astro-
   physics 642, A1.
Mulligan, T., Russell, C. T. and Luhmann, J. G. (1998), ‘Solar cycle evolution of
   the structure of magnetic clouds in the inner heliosphere’, Geophys. Res. Lett.
   25, 2959–2962.
Nieves-Chinchilla, T., Vourlidas, A., Raymond, J. C., Linton, M. G., Al-haddad,
   N., Savani, N. P., Szabo, A. and Hidalgo, M. A. (2018), ‘Understanding the
   Internal Magnetic Field Configurations of ICMEs Using More than 20 Years
   of Wind Observations’, Sol. Phys. 293(2), 25.
Nieves-Chinchilla, T., Vourlidas, A., Stenborg, G., Savani, N. P., Koval, A., Sz-
   abo, A. and Jian, L. K. (2013), ‘Inner Heliospheric Evolution of a “Stealth”
   CME Derived from Multi-view Imaging and Multipoint in Situ observations.
   I. Propagation to 1 AU’, ApJ 779(1), 55.
Nitta, N. V. and Mulligan, T. (2017), ‘Earth-affecting coronal mass ejections
   without obvious low coronal signatures’, Solar Physics 292(9), 125.
Ogilvie, K. W., Chornay, D. J., Fritzenreiter, R. J., Hunsaker, F., Keller, J., Lo-
   bell, J., Miller, G., Scudder, J. D., Sittler, Jr., E. C., Torbert, R. B., Bodet, D.,
   Needell, G., Lazarus, A. J., Steinberg, J. T., Tappan, J. H., Mavretic, A. and
   Gergin, E. (1995), ‘SWE, A Comprehensive Plasma Instrument for the Wind
   Spacecraft’, Space Sci. Rev. 71, 55–77.
O’Kane, J., Cormack, C. M., Mandrini, C. H., Démoulin, P., Green, L. M., Long,
   D. M. and Valori, G. (2021), ‘The magnetic environment of a stealth coronal
   mass ejection’, The Astrophysical Journal 908(1), 89.
   URL: https://doi.org/10.3847/1538-4357/abd2bf
O’Kane, J., Green, L., Long, D. M. and Reid, H. (2019), ‘Stealth coronal mass
   ejections from active regions’, The Astrophysical Journal 882(2), 85.
Palmerio, E., Kilpua, E. K. J., Möstl, C., Bothmer, V., James, A. W., Green,
   L. M., Isavnin, A., Davies, J. A. and Harrison, R. A. (2018), ‘Coronal Mag-
   netic Structure of Earthbound CMEs and In Situ Comparison’, Space Weather
   16(5), 442–460.
Palmerio, E., Kilpua, E. K., James, A. W., Green, L. M., Pomoell, J., Isavnin,
   A. and Valori, G. (2017), ‘Determining the intrinsic cme flux rope type using
   remote-sensing solar disk observations’, Solar Physics 292(2), 39.
Patsourakos, S., Vourlidas, A., Török, T., Kliem, B., Antiochos, S. K., Archon-
   tis, V., Aulanier, G., Cheng, X., Chintzoglou, G., Georgoulis, M. K., Green,
   L. M., Leake, J. E., Moore, R., Nindos, A., Syntelis, P., Yardley, S. L.,
   Yurchyshyn, V. and Zhang, J. (2020), ‘Decoding the Pre-Eruptive Magnetic
   Field Configurations of Coronal Mass Ejections’, Space Sci. Rev. 216(8), 131.
Pesnell, W. D., Thompson, B. J. and Chamberlin, P. (2011), The solar dynamics
   observatory (sdo), in ‘The Solar Dynamics Observatory’, Springer, pp. 3–15.
Qiu, J., Hu, Q., Howard, T. A. and Yurchyshyn, V. B. (2007), ‘On the Mag-
   netic Flux Budget in Low-Corona Magnetic Reconnection and Interplanetary
   Coronal Mass Ejections’, ApJ 659(1), 758–772.
Robbrecht, E., Patsourakos, S. and Vourlidas, A. (2009), ‘No trace left behind:
   Stereo observation of a coronal mass ejection without low coronal signatures’,
   The Astrophysical Journal 701(1), 283.
Scherrer, P. H., Schou, J., Bush, R., Kosovichev, A., Bogart, R., Hoeksema, J.,
   Liu, Y., Duvall, T., Zhao, J., Schrijver, C. et al. (2012), ‘The helioseismic
   and magnetic imager (hmi) investigation for the solar dynamics observatory
   (sdo)’, Solar Physics 275(1-2), 207–227.
Stansby, D. (2019), ‘dstansby/pfsspy: pfsspy 0.1.2’.
   URL: https://doi.org/10.5281/zenodo.2566462
Thernisien, A., Howard, R. and Vourlidas, A. (2006), ‘Modeling of flux rope
   coronal mass ejections’, The Astrophysical Journal 652(1), 763.
Vandas, M. and Romashets, E. (2017), ‘Magnetic cloud fit by uniform-twist
   toroidal flux ropes’, A&A 608, A118.
Vourlidas, A., Lynch, B. J., Howard, R. A. and Li, Y. (2013), ‘How Many CMEs
   Have Flux Ropes? Deciphering the Signatures of Shocks, Flux Ropes, and
   Prominences in Coronagraph Observations of CMEs’, Sol. Phys. 284, 179–
   201.
Weiss, A. J., Möstl, C., Amerstorfer, T., Bailey, R. L., Reiss, M. A., Hinterre-
   iter, J., Amerstorfer, U. A. and Bauer, M. (2021), ‘Analysis of Coronal Mass
   Ejection Flux Rope Signatures Using 3DCORE and Approximate Bayesian
   Computation’, ApJS 252(1), 9.
Yeates, A. (2018), ‘First release of pfss code.’.
   URL: https://doi.org/10.5281/zenodo.1472183

                                                                                                                             Article number, page 7 of 7
You can also read