High-cadence measurements of electron pitch-angle distributions from Solar Orbiter SWA-EAS burst mode operations
←
→
Page content transcription
If your browser does not render page correctly, please read the page content below
Astronomy & Astrophysics manuscript no. output                                                                                       ©ESO 2021
July 14, 2021

                                                            Letter to the Editor

 High-cadence measurements of electron pitch-angle distributions
       from Solar Orbiter SWA-EAS burst mode operations
  C. J. Owen1? , D.O. Kataria1 , L. Berčič1 , T. S. Horbury2 , M. Berthomier3 , D. Verscharen1, 4 , R. Bruno5 , S. Livi6 , P.
   Louarn7 , C. Anekallu1 , C. W. Kelly1 , G. R. Lewis1 , G. Watson1 , V. Fortunato8 , G. Mele9 , G. Nicolaou6, 1 , R. T.
                                   Wicks10 , H. O’Brien2 , V. Evans2 , and V. Angelini2

       1
           Mullard Space Science Laboratory, University College London, Holmbury St. Mary, Dorking, Surrey, RH5 6NT, UK.
       2
           Space and Atmospheric Physics, The Blackett Laboratory, Imperial College London, London, SW7 2AZ, UK.
       3
           Laboratoire de Physique des Plasmas, Ecole Polytechnique, Palaiseau, France.
       4
           Space Science Center, University of New Hampshire, Morse Hall, Durham, NH 03824, USA.
       5
           INAF-Istituto di Astrofisica e Planetologia Spaziali, Via Fosso del Cavaliere 100, 00133 Roma, Italy.
       6
           Southwest Research Institute, 6220 Culebra Road, San Antonio TX, 78238, USA.
       7
           Institut de Recherche en Astrophysique et Planétologie, 9, Avenue du Colonel Roche, B.P. 4346, 31028 Toulouse Cedex 4, France.
       8
           Planetek Italia S.r.l., Via Massaua, 12, I-70132 Bari BA – Italy
       9
           Leonardo, Viale del lavoro, 101, 74123 Taranto, Italy
      10
           Northumbria University, Department of Mathematics, Physics and Electrical Engineering, Newcastle upon Tyne, NE1 8QH, UK
     Received 31 March 2021; accepted 18 June 2021

                                                                  ABSTRACT

     Small-scale kinetic processes associated with turbulence, plasma instabilities, magnetic reconnection, etc., play a major role in dis-
     sipating this energy and governing the large-scale evolution of the solar wind. However, a general impediment to improving the
     understanding of the kinetic physics of the solar wind is in the limitations on measurement cadences of particle instruments, which
     are usually several orders of magnitude below the equivalent cadences of field instruments. Nevertheless, knowledge of the details of
     the particle velocity distribution functions (VDFs) at sub-second cadence is required to make progress in this area. This is particularly
     true for the electron VDFs, which play a significant role in the overall energetics of the solar wind through their transmission of heat
     flux from the Sun. In this paper, we detail and illustrate a novel measurement scheme deployed on Solar Orbiter’s Solar Wind Analyser
     Electron Analyser System (SWA-EAS), which allows for 2D pitch angle distributions (PAD) to be returned over short periods (5-10
     minutes) at a cadence of 0.125 seconds. This is achieved through the use of a B-field vector shared by the magnetometer (MAG)
     instrument to steer the SWA-EAS system to record only that part of the full SWA-EAS field-of-view needed to construct the PAD. We
     provide an example of early observations using this scheme to illustrate that it is working well. Given that the electrons are usually
     gyrotropic, these measurements provide a new tool with which to derive details of the electron VDFs at high cadence for the study of
     the solar wind’s kinetic processes.
     Key words. (Sun:) solar wind, Sun: heliosphere, plasmas, magnetic fields

1. Introduction                                                            measurement cadences from seconds to minutes, which provide
                                                                           appropriate data to pursue Sun-heliosphere connection science
Many of the prime goals of the Solar Orbiter mission involve es-           topics. However, to fully exploit their high duty cycles for oper-
tablishing links between the activity in the solar photosphere or          ation and to make best use of operations outside of the RS win-
corona and the phenomena subsequently observed in inner helio-             dows, the mission science activity plan (Zouganelis et al. 2020)
sphere space (Müller et al. 2020). To this end, the mission carries        also includes goals related to the intrinsic physics of the solar
a comprehensive payload comprising both remote sensing (RS)                wind itself. These goals include advancing our understanding
instruments for diagnostics of the solar atmosphere and in situ            of physical processes such as turbulence, plasma instabilities,
(IS) instrumentation aimed at providing measurements of the so-            magnetic reconnection, collisionless shocks, and other kinetic
lar wind in the vicinity of the spacecraft. Due to telemetry (TM)          plasma processes that, despite their operation on relatively small
constraints, the RS instruments operate in observing windows               temporal and spatial scales, are involved in the complex dynam-
that cover ∼30 days in a ∼6-month orbit. However, the IS in-               ics driving both the large-scale thermodynamics and evolution of
struments, comprising an energetic particle detector suite (EPD,           the solar wind as well as the localised transfer of energy between
Rodríguez-Pacheco et al. (2020)), a magnetometer (MAG, Hor-                EM fields and charged particles (Verscharen et al. 2019).
bury et al. (2020)), a radio and plasma waves instrument suite
                                                                               Providing measurements on timescales appropriate for the
(RPW, Maksimovic et al. (2020), and a solar wind plasma anal-
                                                                           study of kinetic plasma processes is generally not an issue for the
yser suite (SWA, Owen et al. (2020)), each hold the capability of
                                                                           EM fields and waves instruments, such as MAG and RPW, since
near full-time operation. Each of these can operate with temporal
                                                                           they can relatively easily access the sub-second regime associ-
 ?                                                                         ated, for example, with the ion and electron dissipation range for
   Corresponding author:          Christopher    J.   Owen      e-mail:
c.owen@ucl.ac.uk                                                           solar wind turbulence (e.g. Goldstein et al. 2015, and references
                                                                                                                        Article number, page 1 of 5

  Article published by EDP Sciences, to be cited as https://doi.org/10.1051/0004-6361/202140959
A&A proofs: manuscript no. output

therein). These timescales are significantly more challenging to
achieve for particle instrumentation, where obtaining a full 3D
velocity distribution functions (VDF) measurement may be de-
pendent on the spacecraft spin rate (typically of a few seconds)
or on electrostatic deflection techniques combined with accumu-
lation times, which allow for sufficient counts to be recorded
in each measurement bin. This limitation has been overcome,
for example, by the Magnetospheric Multi-scale (MMS) mission
(Burch et al. 2016), which deploys eight sets of particle detectors
per spacecraft in order to address the physics of magnetic recon-
nection. However, this approach is not practical within the scope
of most missions. Nevertheless, the determination of deviations
in solar wind particle VDFs from the Maxwellian equilibrium
state is critical to understanding the complex interplay between
coronal heating, acceleration, global expansion, and local kinetic
processes in driving the evolution of the solar wind plasma (e.g.,
Marsch 2006). Furthermore, a proper assessment of the kinetic
microstate of the solar wind requires particle VDFs at the sub-
second cadence accessible to the fields instruments. Fortunately,
in the case of electrons, the gyrotropy of the VDF around the
B-field direction is expected to be very good, such that the fast
measurement of an electron 2D pitch angle distribution (PAD)
can go a long way towards meeting these goals.
    In this paper, we provide the details of a novel technique
deployed on Solar Orbiter for making such high-cadence mea-
surements of the electron PAD using the SWA Electron Anal-
yser System (SWA-EAS). We first review the basic concept and           Fig. 1. Schematic of the SWA-EAS sensor. The rectilinear box houses
operation of the sensor in Section 2. In Section 3, we describe        sensor electronics and provides orthogonal mounting for two cylindrical
the scheme and the on-board operations that allow the sensor to        sensor heads comprising an aperture deflection subsystem, a hemispher-
capture a complete 2D electron PAD on timescales of 0.125 sec-         ical electrostatic analyser subsystem, an annular microchannel plate de-
ond. In Section 4, we provide an example of the operation of the       tector/anode subsystem. Each head accumulates counts of electrons in
scheme before discussing the caveats to its use. We provide a          64 energy bins (∼1 eV to ∼ 5 keV) arriving from each of 16 elevation
summary of our work in Section 5.                                      directions(±45◦ ) and 32 azimuth directions (0◦ ≤ φ < 360◦ ). Accumu-
                                                                       lation time for a full 3D data product is ∼ 1 second. (see Owen et al.
                                                                       (2020) for further details)
2. SWA-EAS
A description of the SWA-EAS structure and operation can be
found within the SWA instrument paper (Owen et al. 2020). In           head, a high-heritage design for a hemispherical EA allows the
this section, we summarise the relevant points pertaining to the       separation of electrons entering the instrument aperture into 64
fast capture of electron PADs.                                         logarithmically-spaced energy bins ranging from ∼ 1 eV to ∼ 5
    Figure 1 shows a schematic of the SWA-EAS sensor, which            keV.
is located on the end of a 4m long boom which maintains its                 Given that each sensor head accepts electrons arriving from
location within the spacecraft shadow. The rectilinear box struc-      all azimuths simultaneously, the mode of operation to build up a
ture contains most of the instrument electrical subsystems and         full 3D VDF is to use the ADS system to select a given elevation
provides the mounting for two separate cylindrical electrostatic       angle for electrons arriving into each head, then to sweep the
analyser (EA) heads (e.g. Carlson et al. 1982), each with an aper-     EA across the full range of 64 energies, before moving on to the
ture deflection system (ADS). The ADS is used to electrostati-         next elevation setting. The accumulation time for each elevation-
cally steer electrons arriving from ’elevation’ directions within      energy bin measurement is 0.96 ms, such that the full set of
±45◦ of the centre plane (that lying orthogonal to the axis of         measurements is made in 16 x 64 x 0.96 ms = 0.983 seconds.
cylindrical symmetry) of each sensor head into its aperture. Each      Although the combined sensor pair are capable of producing the
sensor head simultaneously accepts electrons arriving from a           resulting full 3D measurement space at this ∼1 second cadence,
full 360◦ in azimuth, except for three minor blockages due to          the volume of data involved is challenging for the SWA TM bud-
three pillars that mount the top of the sensor head to its lower       get, even after compression is applied. For this reason, this full
half. Overall, each sensor head separates, within its own science      cadence data product can only be returned to the ground for very
frame, the direction of arrival of electrons into 32 bins in azimuth   limited periods, at most 5 minutes per day on average. Rather, the
(0◦ ≤ φ < 360◦ ) and 16 bins in elevation (−45◦ ≤ θ < 45◦ ). We        SWA Data Processing Unit (SWA-DPU) uses the base 3D VDF
note that the 16 bins in elevation are not equally sized due to the    to calculate onboard moments at a 4 second cadence, which is
asymmetry in the mounting environment between top and bot-             returned to the ground with the full VDFs returned at only 10 or
tom of each head (see Owen et al. (2020) for further details).         100 second cadence depending on TM availability. In any case,
Since the two sensor heads are mounted orthogonally to each            all of these available data cadences are ≥ 1 second, which is al-
other (and at 45◦ to the spacecraft-Sun line), the two swaths          ready long compared to what is ideally required to address the
of sky representing each sensor heads field of view (FoV) are          solar wind kinetic physics topics outlined in the introduction.
combined to cover the full sky, with additional blockages only         For this reason, we derived a ’burst mode’ (BM) of operation,
due to the spacecraft and its appendages. Within each sensor           which improves this situation by capturing a 2D electron PAD at
Article number, page 2 of 5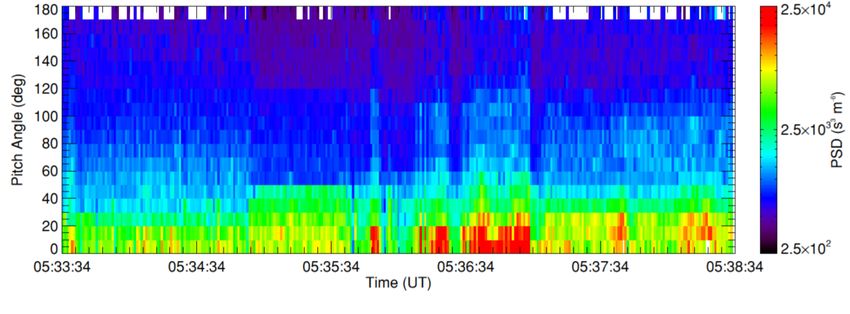
C. J. Owen et al.: High Cadence Electron Pitch Angle Distributions

    ‘Pixel’ detecting lowest         ZHEAD
    (and < 90º) pitch angle                         BS20
    electrons in Band #1
                                                    e–
Selected                                                    ‘Pixel’
Elevation                                                   detecting
Band #1                                                     180º pitch
(32 az bins)                                                angle
                                                            electrons
‘Pixel’
detecting 0º
pitch angle
electrons
                                                         ‘Pixel’ detecting
 Selected
                                                         highest (and >
 Elevation
                                                         90º) pitch angle
 Band #2
                                                         electrons in
 (32 az bins)       e–                                   Band #2

Fig. 2. Schematic of the rationale of the SWA-EAS BM PAD capture
scheme. The sensor head with centre-plane closest to the B-field direc-
                                                                             Fig. 3. Full sky map showing an example of the SWA-EAS BM capture
tion is steered to capture the two elevation bands containing the field
                                                                             scheme. The B-field direction is chosen here to be at [32◦ , 15◦ ] (red
direction and anti-field direction. In these two bands, all 32 azimuth
                                                                             diamond) so the anti-field direction is at [−148◦ , −15◦ ] (red triangle).
bins record incoming electrons simultaneously. This then captures 64
                                                                             The blue grid shows the projection of the EAS1 angle-angle bins onto
samples in pitch angle space spread between 0◦ and 180◦ .
                                                                             the plane of the sky, while the red contours show lines of constant pitch
                                                                             angle for this B-field direction, for pitch angles of 30◦ , 60◦ , 90◦ , 120◦ ,
                                                                             and 150◦ . The two selected elevation bands are shown shaded in orange.
eight times the temporal resolution of the 3D product. In the next
                                                                             Combined these cross the full range of pitch angle space.
section, we describe the onboard algorithm used in this scheme.

3. High-cadence PAD capture scheme                                           parallel to the field direction, represented by the green arrow in
                                                                             the lower left quadrant) will be detected and associated with the
In order to further the ability of the SWA-EAS sensor to con-                pixel shaded blue in the lower left of the figure. Thus, if the sen-
tribute to the kinetic physics goals of Solar Orbiter, we devised            sor is commanded to measure only these two specific angular
a BM operational scheme, whereby we sample the minimum                       bins, determined with reference to the B-field direction, we can
number of measurement elements required to provide a valid                   be sure that we have captured both the 0◦ and 180◦ pitch an-
2D PAD of the electrons at subsecond resolution. Fundamen-                   gle electrons. However, since all azimuths in the selected sensor
tal to this operation is the availability to the SWA-DPU of the              head frame for a given elevation and energy are measured simul-
near-contemporaneous B-field unit vector, b̂, from the MAG in-               taneously, there is no time penalty to also capturing the other 31
strument (Horbury et al. 2020). This need was addressed by the               azimuth pixels associated with the two selected elevations. These
MAG and SWA teams, together with ESA and Airbus UK, dur-                     two selected elevation bands, each containing 32 azimuthal bins,
ing the mission planning phase, so this data product is communi-             are shaded in yellow in the figure.
cated between MAG and SWA onboard over an inter-experiment                       We now consider the pitch angles associated with the two
link, known as Service 20 (S20). This data product is communi-               sets of 32 azimuth bins selected by this algorithm. For the ’se-
cated at 0.125 second cadence and with minimal latency.                      lected elevation band #1’ shown in the upper part of Figure 2, we
     On receipt of a magnetic unit vector, an algorithm within               note that as we move away from the azimuthal pixel containing
the SWA-DPU first calculates which of the two SWA-EAS sen-                   the B-field direction and ’detecting’ 180◦ pitch angle electrons,
sor heads has the B-field direction lying closest to its aperture            the azimuth angle of the measurement corresponds to electrons
centre plane (equivalent to the largest angle between b̂ and the             of lower and lower pitch angles. The lowest pitch angle sampled
sensor head science frame Z-axis shown in Figure 1). For that                in this band corresponds to the pixel azimuth directly opposite
sensor head, the algorithm calculates which of the 16 elevation              that containing the B-field (light blue shaded pixel in upper left
bins contains b̂ and additionally which contains −b̂. A schematic            quadrant of the figure). From the geometry, this always corre-
illustrating this selection process is shown in Figure 2. This               sponds to pitch angles of < 90◦ , and if the selected band was
figure represents the measurement sphere for a single energy,                at 0◦ elevation (the case when BS 20 is perpendicular to ZHEAD ),
with the axis of cylindrical symmetry of the sensor head point-              then this pixel would measure electrons with 0◦ pitch angle. Con-
ing up the page and marked as ZHEAD . We draw the projection                 versely, for ’Selected Elevation Band #2’ in the lower part of Fig-
of b̂ through this sphere as the red-arrowed line marked BS 20 .             ure 2, azimuthal pixels located increasingly further away from
This line crosses the sphere at two points, marked by the red                that collecting 0◦ pitch angle electrons correspond to measure-
dots (we note that the fainter colouring and dashed lines are in-            ment of electrons at increasingly higher pitch angles. Similarly
tended to represent elements of the figure which are below the               to arguments above, the highest pitch angle detected in this band
surface of the sphere facing the viewer). These points are asso-             will be > 90◦ . Thus, selecting just the two elevation bands illus-
ciated with specific azimuth and elevations in the sensor head               trated in Figure 2 will provide two sets of 32 pitch angles, α1 ,
reference frame, and therefore with two specific angular ’pix-               α2 with ranges α1 = [< 90◦ : 180◦ ] and α2 = [0◦ : > 90◦ ]. Thus,
els’ (represented by blue shading around the red dots) within the            between the two selected bands, we have 64 measurements of
sensor head measurement space. We note that an electron travel-              the electrons with pitch angle range from [0◦ : 180◦ ].
ling with pitch angle 180◦ , (i.e. antiparallel to the field direction,          We further illustrate the operation of this algorithm by pre-
represented by the green arrow in the upper right quadrant) will             senting a specific example in a heliospheric coordinate system.
be detected and associated with the pixel shaded blue in the top             Figure 3 shows a ’map’ of the full sky covering ±180◦ in azimuth
right. Conversely, an electron travelling with pitch angle 0◦ , (i.e.        and ±90◦ in elevation. In this format, we may locate the Sun at
                                                                                                                            Article number, page 3 of 5
A&A proofs: manuscript no. output
[0,0] (corresponding to [1, 0, 0] in the spacecraft frame shown in
Figure 1) and +90◦ elevation points northward out of the plane
of the spacecraft orbit ([0, 0, 1] in the spacecraft frame.). As a bx by bz
definitive example, we represent the case in which the B-field di-
rection is located at azimuth 32◦ and elevation 15◦ , as marked by
the red diamond symbol. The direction opposite to the field di- θB_EAS1 θB_EAS2 Selected Elevation Band 2
rection is then marked by the red triangle at [−148◦ , −15◦ ]. This Selected Elevation Band 1
field direction falls within the FoV of the EAS1 sensor head but
is outside of the region sampled by EAS2. We therefore show,
as the blue grid, the pixelated FoV of the EAS1 sensor head
transformed onto this sky map. Selection of an elevation band φB_EAS1 φB_EAS2
containing the FoV means we capture all data from the region
shaded orange and passing across the red diamond symbol. The
selection of the elevation band containing the anti-field aligned
direction captures the data from the orange band passing through
the triangle symbol (and wrapping across the left and right edges
of the plot). Superimposed over the plot are a set of red contours,
which represent the loci for particles arriving with 30◦ , 60◦ , 90◦ ,
120◦ , and 150◦ pitch angles for this orientation of the B-field.
We note that the first selected band crosses pitch angle contours
from 180◦ (red diamond) down to < 30◦ (near [−120◦ , −15◦ ]),
while the second crosses contours from 0◦ (red triangle) up to >
150◦ (near [60◦ , 15◦ ]). This again illustrates that, in principle, a
full range of the electron PAD is sampled.
A key point here then is that since we are able to obtain a
full PAD by steering just one of the two sensor heads to sample
only the two elevations containing the B-field and anti-field di-
rections. Since the full 16 elevations comprising the full 3D VDF
is not recorded in this mode, we are able to reduce the sample
time by a factor of 8 and the data volume per sample by a factor
of 16. In practice, this means that we can capture and return this
data product at a time cadence of 0.125 seconds. However, the
data volume per second, which contains 8 times as many sam-
ples, is only half that of the 3D sample. Hence, the deployment
of this mode in practice must also be limited to only a few tens
of minutes per day. In the next section, we present an example
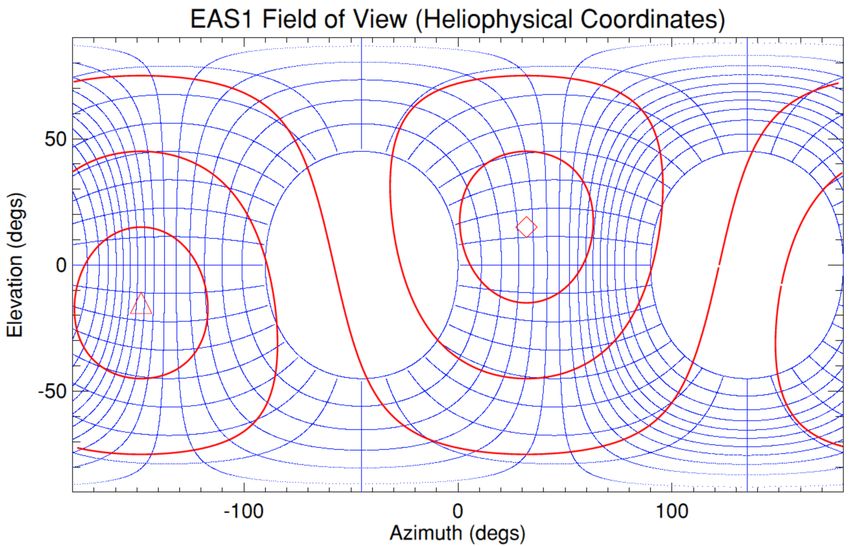
of the data returned from SWA-EAS deployed in this mode. Fig. 4. Example of an SWA-EAS BM event, showing 5 minutes of data
recorded on 26th June 2020. The top panel shows the B-field unit vector
received over S20 from MAG. Panel 2 illustrates the selection of the
4. Example BM Event EAS elevation bins for each sample, based on the MAG data. Panel 3
shows the azimuth of the field in the 2 SWA-EAS science frames, while
Figure 4 shows an example of data returned from an SWA-EAS panel 4 indicates the sensor head selected to supply data. Panels 5 and
BM on 24 June 2020, lasting for 5 minutes from 05:33:34 UT. 6 contain the data recorded in the elevation bins containing the field
The top panel shows the components of the B-field unit vec- and anti-field aligned directions for each measurement sample. These
tor, as supplied to SWA-EAS by MAG via the S20 link, in the data, for electrons of energy > 70 eV, are recorded as a function of
spacecraft frame (c.f. Figure 1). In this panel, the x-component azimuth at 0.125 s cadence. The bottom panel shows this data rebinned
is shown as the red trace, the y-component in green and the z- into pitch angle space, showing that a full PAD was obtained for most
of the duration of the event. See text for details.
component in magenta. The next two panels show the elevation
and azimuth angle of the B-field vector in the EAS1 (red) and
EAS2 (yellow) science frames. We note, however, that the yel-
low trace is absent from the second panel for much of the pe- 05:36:20 UT, the field direction moves also into the EAS2 FoV,
riod shown since the elevation angle in this frame moves below such that the orange trace is visible, and for some short peri-
−45◦ and thus outside the EAS2 FoV covering ±45◦ . The sec- ods is closer to zero elevation in the EAS2 frame than in the
ond panel also shows a series of magenta boxes which show the EAS1 frame. At those times, the data selection switches from
extent of the elevation bin selected by the B-field tracking algo- EAS1 to EAS2, as indicated in the fourth panel. We note that
rithm as that containing the field, along with a set of light blue after ∼05:37:00 UT, the B-field orientation switches such that it
boxes showing the extent of the elevation bin selected to con- lies close to the EAS1 FoV centre plane (near 0◦ elevation in the
tain the anti-field direction. It can be seen here that the EAS1 EAS1 science frame) and is almost aligned with the axis of sym-
elevation trace (red) remains almost entirely within the selected metry for EAS2 (not shown) where the field elevation angle is
elevation boxes, despite variations of elevation covering several ∼ 90◦ . Thus, for this period, small shifts in the direction of the
tens of degrees. field result in the large azimuthal shifts seen in the orange trace
Panel 4 shows the sensor head used for the selection of each in panel 3. Overall however, these upper four panels of Figure 4
data point in the time series. For the most of the event, the field show that the algorithm for selecting the appropriate sensor head
direction is closest to the centre of the EAS1 FoV, so that head is and the appropriate pair of elevations works very well for these
selected to provide data. However, during the period ∼05:34:40 - inputs.
Article number, page 4 of 5C. J. Owen et al.: High Cadence Electron Pitch Angle Distributions
Panels 5 and 6 show the time series of data collected in the on the traffic on the S20 link. This will have impact on the re-
two selected elevation bins as a function of azimuth angle and sulting science data if the field vector moves significantly (again
time through the BM event. Here, we opted to present the aver- by more than the width of one SWA-EAS elevation bin) during
aged phase space density for all energy bins > 70 eV , shown at the period of latency. If this is the case, then the SWA-DPU may
full 0.125 second cadence. We note that data exists for electrons steer the EAS using a field vector that is no longer relevant.
of lower energies, but at the time of writing, there is a need to If either of the above issues become significant, there is a re-
remove the contamination from spacecraft-generated electrons. sulting impact on the completeness of the science data product,
Moreover, the energy range shown here is representative of the although not necessarily the overall quality of the data obtained.
solar wind electron strahl, which is expected to show the greatest If the steering is in error by more than the width of an eleva-
degree of ordering by the B-field (Feldman et al. 1975). tion bin, then the foremost consequence is the failure to capture
Panels 5 and 6 show that the Band 1 fluxes are relatively low the 0◦ and 180◦ pitch angle particles. Given the average half-
for the first half of the event, while in Band 2 there is a swathe of width of an SWA-EAS elevation bin is ∼2.8◦ , we would typically
generally higher fluxes initially centred around > 150◦ azimuth lose these field-aligned measurements if the elevation of the on-
and strengthening and shifting to lower azimuths later in the pe- board B-field vector were in error by that amount. However, the
riod shown. However, a higher order data product is obtained by data that is returned can be rebinned on the ground according
associating each of the 2 x 32 azimuths shown in panels 5 and to validated ground MAG data, so that accurate, albeit incom-
6 with the corresponding pitch angle and combining measure- plete, PAD scans can still be obtained. It is anticipated that the
ments in pitch angle space. The result of this exercise for this ground-validated, rebinned PAD’s, at 0.125 s resolution, will be
case is shown in the bottom panel of Figure 4, in which we have a regular SWA Level 3 data product available from the Solar Or-
resampled the data into one of 18 10-degree wide pitch angle biter Archive 1 .
bins and also summed to a 1 second time cadence for clarity of In summary, we have deployed an important new tool for the
presentation. This data then shows the complex variation in the study of solar wind electrons and their interactions with electro-
strahl fluxes immediately before and after the significant B-field magnetic fields and waves. Electrons are highly mobile and carry
rotation at ∼05:37:00 UT. Although the strahl fluxes in the field a substantial heat flux into the solar system. Thus, attaining an
aligned direction remain dominant throughout the event, despite understanding of both how that heat flux is carried into the he-
the field rotation, the SWA-EAS data captured clearly shows the liosphere by the creation of suprathermal features within the dis-
short timescale variations in both the intensity of the beam and tribution and how it is dissipated via kinetic processes operating
its pitch-angle width, including significant variations observed on small timescales is key to understanding the overall energet-
across the current sheet itself. We believe this demonstrates a ics of the plasma. While it is unlikely that particle instruments
new observational capability through which short timescale in- will soon achieve the kind of time resolution for measurements
teractions between the fields and electrons can be studied to that are currently available through EM fields instruments, the
bring new light on kinetic scale processes. Indeed, we note that algorithm described and illustrated here will shift the boundaries
this capability has been used by Berčič et al. (2021) to examine of what is possible with the application of particle data.
the evolution of the strahl electron PAD observed later the same Acknowledgements. Solar Orbiter is a space mission of international collabo-
day during the presence of whistler waves detected by the RPW ration between ESA and NASA, operated by ESA. Solar Orbiter Solar Wind
experiment (Maksimovic et al. 2020). Analyser (SWA) data are derived from scientific sensors which have been de-
signed and created, and are operated under funding provided in numerous con-
tracts from the UK Space Agency (UKSA), the UK Science and Technology
5. Discussion and Conclusion Facilities Council (STFC), the Agenzia Spaziale Italiana (ASI), the Centre Na-
tional d’Etudes Spatiales (CNES, France), the Centre National de la Recherche
In this paper, we have described and illustrated the operation of a Scientifique (CNRS, France), the Czech contribution to the ESA PRODEX pro-
novel on board algorithm, which facilitates the rapid acquisition gramme and NASA. Solar Orbiter SWA work at UCL/MSSL is currently funded
under STFC grants ST/T001356/1 and ST/S000240/1. The Solar Orbiter MAG
of electron PADs from the Solar Orbiter SWA-EAS. Although was funded by the UK Space Agency (grant ST/T001062/1). D.V. is supported by
the scheme works well in general, there are a number of caveats STFC Ernest Rutherford Fellowship ST/P003826/1. T.H. is supported by STFC
to be kept in mind when analysing the resultant data. grant ST/S000364/1.
Firstly, the sampling of a PAD in principle loses information
related to the gyrotropy of the full VDF, which may be a draw-
back in some kinetic contexts (e.g. near a reconnection region). References
However, our scheme does sample the underlying VDF at multi-
Berčič, L., Verscharen, D., Owen, C. J., et al. 2021, A&A, this volume
ple gyrophase angles, particularly for more perpendicular pitch Burch, J. L., Moore, T. E., Torbert, R. B., & Giles, B. L. 2016, Space Science
angles. Thus, limited gyrophase information is still recoverable. Reviews, 199, 5
Secondly, although the tracking of the B-field vector received Carlson, C., Curtis, D., Paschmann, G., & Michel, W. 1982, Advances in Space
Research, 2, 67
over the S20 link is excellent, the quality and relevance of the Feldman, W., Asbridge, J., Bame, S., Montgomery, M., & Gary, S. 1975, Journal
resulting PAD can only be as good as the quality and relevance of Geophysical Research, 80
Goldstein, M. L., Wicks, R. T., Perri, S., & Sahraoui, F. 2015, Philosophical
of the input data. Although this is generally excellent, there are Transactions of the Royal Society A - Mathematical Physical and Engineering
known issues that may affect the quality of the B-field infor- Sciences, 373
mation, such as electromagnetic contamination from spacecraft Horbury, T. S., O´Brien, H., Carrasco Blazquez, I., et al. 2020, A&A, 642, A9
Maksimovic, M., Bale, S. D., Chust, T., et al. 2020, A&A, 642, A12
subsystems and other instruments, as well as drifts of the MAG Marsch, E. 2006, Living Reviews in Solar Physics, 3, 1
offsets. If any such issues cause the steering algorithm to de- Müller, D., St. Cyr, O. C., Zouganelis, I., et al. 2020, A&A, 642, A1
Owen, C. J., Bruno, R., Livi, S., et al. 2020, A&A, 642, A16
part from the actual B-field location by the width of one SWA- Rodríguez-Pacheco, J., Wimmer-Schweingruber, R. F., Mason, G. M., et al.
EAS elevation bin (or more), then the PAD completeness will be 2020, A&A, 642, A7
compromised. In addition, there is, by necessity, a latency in the Verscharen, D., Klein, K. G., & Maruca, B. A. 2019, Living Reviews in Solar
Physics, 16, 5
transmission of data from the MAG instrument, which comes via Zouganelis, I., De Groof, A., Walsh, A. P., et al. 2020, A&A, 642, A3
the spacecraft central computer and the SWA-DPU to the EAS
1
sensor. This latency is likely to be somewhat variable depending http://soar.esac.esa.int/soar/
Article number, page 5 of 5You can also read