Antarctic skin temperature warming related to enhanced downward longwave radiation associated with increased atmospheric advection of moisture and ...
←
→
Page content transcription
If your browser does not render page correctly, please read the page content below
LETTER • OPEN ACCESS

Antarctic skin temperature warming related to enhanced downward
longwave radiation associated with increased atmospheric advection of
moisture and temperature
To cite this article: Kazutoshi Sato and Ian Simmonds 2021 Environ. Res. Lett. 16 064059

View the article online for updates and enhancements.

                               This content was downloaded from IP address 46.4.80.155 on 18/09/2021 at 01:34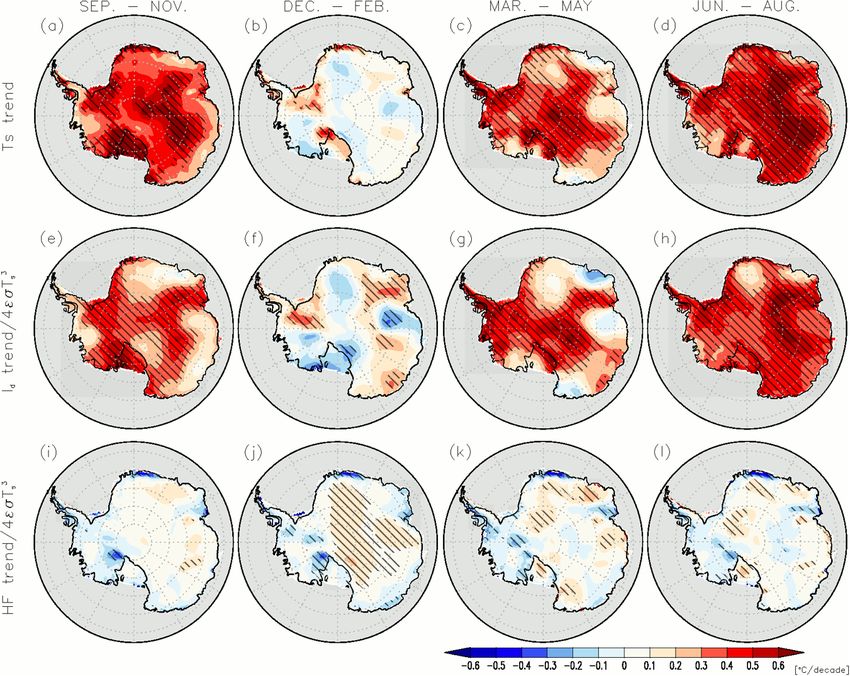
Environ. Res. Lett. 16 (2021) 064059 https://doi.org/10.1088/1748-9326/ac0211
LETTER
Antarctic skin temperature warming related to enhanced
OPEN ACCESS
downward longwave radiation associated with increased
RECEIVED
21 January 2021 atmospheric advection of moisture and temperature
REVISED
4 May 2021 Kazutoshi Sato1,∗ and Ian Simmonds2
ACCEPTED FOR PUBLICATION 1
Kitami Institute of Technology, Kitami, Japan
17 May 2021 2
School of Earth Sciences, The University of Melbourne, Melbourne, Australia
PUBLISHED ∗
Author to whom any correspondence should be addressed.
4 June 2021
E-mail: satokazu@mail.kitami-it.ac.jp
Original content from Keywords: Antarctica, skin temperature, long-term temperature trend, longwave radiation, ERA5
this work may be used
under the terms of the Supplementary material for this article is available online
Creative Commons
Attribution 4.0 licence.
Any further distribution
of this work must Abstract
maintain attribution to
the author(s) and the title We investigate linear trends in Antarctic skin temperatures (temperatures from about the top
of the work, journal millimeter of the surface) over the four seasons using ERA5 ensemble mean reanalysis data. During
citation and DOI.
1950–2020, statistically significant warming occurred over East and West Antarctica in spring,
autumn and winter, and over the Antarctic Peninsula in autumn and winter. A surface energy
budget analysis revealed that increases in downward longwave radiation related to increases in air
temperature and total column integrated cloud had a key role in Antarctic surface warming. There
were negative sea level pressure trends around the periphery of Antarctica throughout the year, and
the associated circulation contributed to warm advection from the middle latitudes to West
Antarctica and the Antarctic Peninsula. Over the interior of East Antarctica, increase in moisture
advection from lower latitudes enhanced the low-level cloud cover. A two-dimensional parameter
diagram showed that skin temperature trends for time segments longer than 30 years starting
before 1960 exhibited statistically significant warming in autumn and winter in East and West
Antarctica and the Antarctic Peninsula. In spring, West Antarctica also showed statistically
significant warming for long segments. In summer, the Antarctic Peninsula had statistically
significant warming trends for long segments and cooling trends for segments less than 30 years.
For all the studied time intervals, when skin temperatures had statistically significant positive
trends, increases in downward longwave radiation contributed more than 70% of the warming and
vice versa. This result demonstrates that on all time and space scales, changes in downward
longwave radiation associated with variations in air temperature and atmospheric moisture
loading play a dominant role controlling skin temperatures.
1. Introduction et al 2020, Kusahara 2020) and observational data
(e.g. radiosondes: Screen and Simmonds 2012; opera-
Antarctic climate change has attracted considerable tional weather station data: Li et al 2014, Marshall and
attention since the 1958 International Geophysical Thompson 2016, Jones et al 2019; automatic weather
Year, particularly with regard to temperature. Tem- station data: Bromwich et al 2012).
perature changes in Antarctica influence ice sheet From 1950 until the early 2000s, there were pos-
mass (Pritchard and Vaughan 2007, Pritchard et al itive trends in annual mean surface air temperature
2009). Various studies have addressed surface air tem- over the entire Antarctic continent with the highest
perature variability over Antarctica using reanalyzed warming rate over West Antarctica (Steig et al 2009).
data (Steig et al 2009, O’Donnell et al 2010, Schneider However, the distribution and magnitude of surface
et al 2011, Nicolas and Bromwich 2014, Huai et al air temperature trends over periods >40 years are
2019, Bozkurt et al 2020, Hillebrand et al 2020, Jun very sensitive to seasonality (O’Donnell et al 2010,
© 2021 The Author(s). Published by IOP Publishing Ltd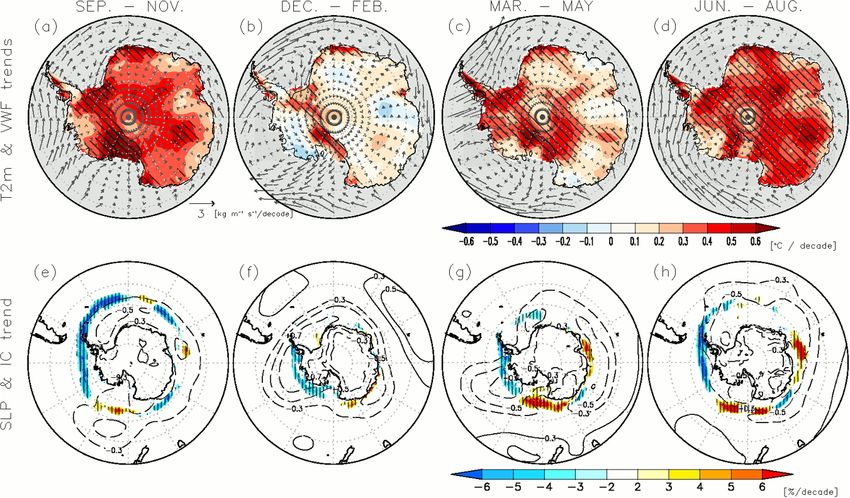
Environ. Res. Lett. 16 (2021) 064059                                                           K Sato and I Simmonds

Nicolas and Bromwich 2014, Jones et al 2019). Over          and temperature over East and West Antarctica, and
the Antarctic Peninsula, the magnitude of surface air       a positive relationship between Antarctic Peninsula
temperature warming from 1950s to 2000s or 2010s            temperatures and SAM phase (Nicolas and Bromwich
in autumn and winter is greater than in spring and          2014, Jones et al 2019).
summer. West Antarctica, excluding the Antarctic                 Previous studies examined the relationship
Peninsula, experiences its highest warming rate in          between atmospheric circulation over the SH and
spring. Conversely, over some parts of East Antarc-         tropical oceanic variability, often termed tropical–
tica surface air temperatures exhibit a negative trend      polar teleconnections (Liu et al 2005, Ding et al 2011,
in autumn and winter.                                       2012, Pezza et al 2012, Clem and Fogt 2013, 2015,
     Surface air temperature trends are also sensitive to   Ding and Steig 2013, Li et al 2014, 2015, Ciasto et al
chosen start and end years that make up a period of         2015, Irving and Simmonds 2015, 2016, Nuncio and
study (Steig et al 2009, O’Donnell et al 2010, Nicolas      Yuan 2015, Clem et al 2016, 2017, 2018, Turner et al
and Bromwich 2014, Gonzalez and Fortuny 2018,               2016, Screen et al 2018, Yiu and Maycock 2019). Dur-
Jones et al 2019). In East Antarctica, long term warm-      ing a La Niña event, the atmospheric response to SST
ing trends have been observed to exceed 50 years            cooling over the central Pacific region strengthens
in all seasons; however, shorter periods (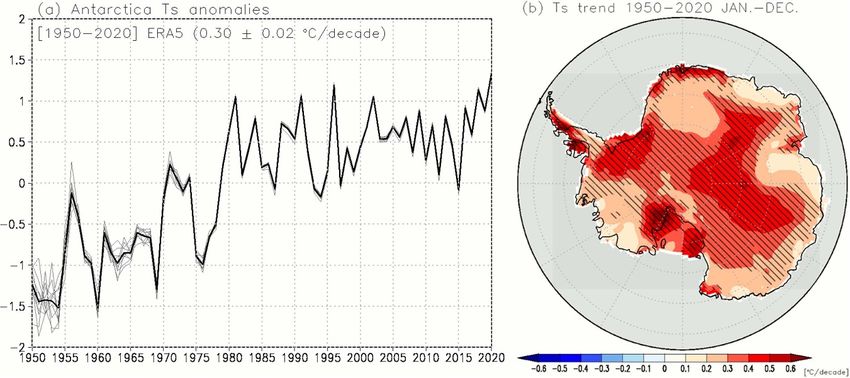
Environ. Res. Lett. 16 (2021) 064059                                                           K Sato and I Simmonds

from the high southern latitudes to over the Antarctic      ε is the surface emissivity (herein set to 1) and T s is
continent.                                                  the skin temperature. We may then write:

2. Data and methods                                                  ∆lu = − εσ∆Ts 4 = − εσ4Ts 3 ∆Ts .

                                                            Substituting this expression into equation (2) we
2.1. Reanalysis and observation data
                                                            derive:
We used the ECMWF monthly mean ERA5 reanalysis
data from 1950 to 2020 (from 1950/1951 to 2020/2021              ∆Ts = (∆Sd + ∆Su + ∆ld + ∆Fsh + ∆Flh
for summer [December to February]) at a horizontal                           + ∆R) / (4εσTs 3 ).                (3)
resolution of 0.5◦ (Hersbach et al 2020) (available
from https://www.ecmwf.int). To investigate temper-         Our equation (3) is identical to equation (3) in Lee
ature variability and its causes, various atmospheric       et al (2017), except that we have included the trends
(e.g. sea level pressure (SLP), skin temperature, short-    of the upward and downward shortwave radiation
wave and longwave radiation, latent and sensible heat       because we examined all four seasons (they only
flux, amount of integrated water and ice cloud) and         studied the Arctic winter). The T s in the denom-
oceanic (e.g. sea ice concentration and SST) para-          inator was the mean value of each season aver-
meters were used. The ERA5 dataset comprises ten            aged over the study interval at each grid point.
ensemble members. To evaluate the performance of            The parameter R is not provided in the ERA5
air temperature in the ERA5, we used air temperature        dataset. Therefore, the difference between ∆Ts and
observation data at surface and pressure level (850,        ((∆Sd + ∆Su + ∆ld + ∆F sh + ∆F lh )/4εσT s 3 ) was
700, 500, 300 hPa) in the Antarctic Climate Data,           used as the ∆R/(4εσT s 3 ).
which are available from the SCAR READER project
(Turner et al 2004) (available from https://legacy.bas.     3. Results
acuk/met/READER).
                                                            3.1. Antarctic skin temperature rise and increased
2.2. Surface budget analysis                                downward longwave radiation over 1950–2020
To investigate the causes in Antarctica skin temper-        Figure 1(a) shows the time series of annual mean
ature changes, we conducted surface budget analyses,        ERA5 skin temperature anomalies over Antarctica
which have been used previously for understanding           for each of the ten ensemble members and their
Arctic surface climate change (Lesins et al 2012, Lee       mean. There was an overall warming trend over the
et al 2017). With this approach, we revealed how the        entire continent from 1950 to 2020 in all members
various components of the energy budget contribute          (0.30 ± 0.02 ◦ C decade−1 ). Although the skin tem-
to variations in skin temperature.                          perature exhibited ensemble spread in all years; the
    The surface energy budget can be written as:            spread became small from 1979 because of an increase
                                                            in assimilated satellite data sets. Conversely, before
         G = Sd + Su + ld + lu + Fsh + Flh + R,      (1)    1978, there was relatively large ensemble spread, par-
                                                            ticularly in the early 1950s, compared with 1979.
where l and S are longwave and shortwave radiation,         To reduce the parameter uncertainty in the ERA5,
respectively, and u denotes upward and d downward,          we used ten ensemble mean data. We calculated the
G is a storage term, F lh is the surface latent heat flux   September–November (spring), December–February
and F sh is the surface sensible heat flux. The residual    (summer), March–May (autumn) and June–August
term R includes heat conduction from below the sur-         (winter) linear trends of each parameter in the energy
face (e.g. heat conduction through snow and/or heat         budget. In addition, skin temperature data in another
loss through the melting of snow). When the fluxes          four reanalysis data sets (ERA20C (available from
are directed toward the surface (i.e. toward the inter-     https://www.ecmwf.int): Poli et al 2016; ERA-Interim
face), they are defined as positive. After taking the       (available from https://www.ecmwf.int): Dee et al
differential of equation (1), the trend in the surface      2011; CFSR (available from https://cfs.ncep.noaa.
energy budget is:                                           gov/cfsr): Saha et al 2010, 2014; JRA55 (available
                                                            from https://jra.kishou.go.jp): Kobayashi et al 2015)
∆G = ∆Sd + ∆Su + ∆ld + ∆lu + ∆Fsh + ∆Flh + ∆R,              were used to compare the amplitudes and trends of
                                            (2)             surface skin temperature change among these data
                                                            (figure S1 (available online at stacks.iop.org/ERL/16/
where the differential operator ∆ represents the            064059/mmedia)). There are robust long term warm-
trend. In this study, we assumed an infinitesimally         ing trends among three reanalyses (ERA5, ERA20C
thin air surface interface with a very small heat capa-     and JRA55), and all reanalyses have Antarctica warm-
city (Lesins et al 2012, Lee et al 2017), and hence the     ing with statistical significance above the 95% level.
storage term G can be dropped.                                  Figure 1(b) shows the geographical distribution
    The upward longwave flux is expressed as                of the linear trend of annual mean skin temperat-
−εσT s 4 , where σ is the Stefan–Boltzmann constant,        ures over Antarctica (1950–2020). A sizeable portion

                                               3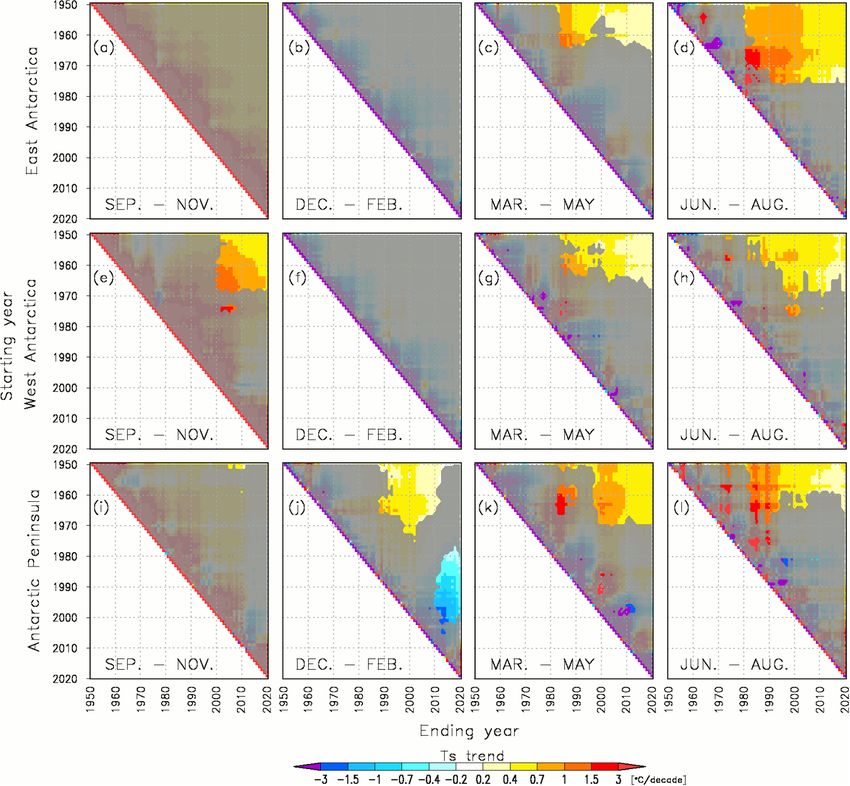
Environ. Res. Lett. 16 (2021) 064059                                                                                K Sato and I Simmonds

   Figure 1. (a) Time series of annual mean Antarctica ERA5 skin temperature (Ts) anomalies for mean (thick) and individual
   (thin) ensemble members from 1950 to 2020. (b) Distribution Ts linear trends from 1950 to 2020. The cross-hatched area
   indicates statistically significant (p < 0.05) trends.

   Figure 2. Skin temperature (Ts) linear trends (◦ C decade−1 ) in 1950–2020 (a) September–November (spring),
   (b) December–February (summer), (c) March–May (autumn) and (d) June–August (winter). Seasonal (month) ranges in (e)–(h)
   and (i)–(l) are the same as in (a)–(d) but depict data for downward longwave radiation (ld ) and turbulent heat flux (HF;
   F lh + F sh ), respectively, divided by 4εσT s 3 (◦ C decade−1 ). The cross-hatched areas indicate statistically significant (p < 0.05)
   trends.

of the continent exhibited significant positive trends                  reported differences in the distribution and mag-
including the Antarctic Peninsula, the eastern part of                  nitude of surface air temperature trends for each sea-
West Antarctica, the Ross Sea, the coast around 0◦ E                    son (Steig et al 2009, O’Donnell et al 2010, Nicolas
and the interior of East Antarctica. Previous studies                   and Bromwich 2014, Jones et al 2019). Our linear

                                                         4
Environ. Res. Lett. 16 (2021) 064059 K Sato and I Simmonds
Figure 3. The linear trends of air temperature at 2 m (T2m: ◦ C) and vertical integral of water vapor flux (VWF) (vector:
kg m−1 s−1 decade−1 ) for (a) spring, (b) summer, (c) autumn and (d) winter. The seasons in (e)–(h) are the same as (a)–(d) but
show data for sea ice cover (IC) and SLP (hPa decade−1 ). The cross-hatching shows areas with statistically significant (>95%
confidence level) data for T2m (a)–(d) and IC (e)–(h).
trends of skin temperature for each season are shown downward shortwave radiation have a minor direct
in figures 2(a)–(d). Although significant trends in impact on surface warming (Chiodo et al 2017). The
summer were limited to the coastal area around 0◦ E linear trends of R/4εσT s 3 were a little stronger but
and the southern part of the Ross Sea (figure 2(b)), were still very modest (figures S2(e)–(h)). There were
widespread warming trends were observed in the positive values in coastal areas around 0◦ E and the
other three seasons (figures 2(a), (c) and (d)). The southern part of the Ross Sea; however, statistically
magnitude, areal extent and significance are most significant change was limited to the southern Ross
marked over West Antarctica in spring, the Ant- Sea in spring. Interpreting these results, we found that
arctic Peninsula in autumn and East Antarctica in ld /4εσT s 3 is the most important term in equation
winter. (3), which indicates that the increase in downward
To explore the cause of Antarctica skin temper- longwave radiation has a major impact on Antarc-
ature change, we calculated linear trends of terms tic skin temperature warming. Similar behavior of
(i.e. ld /4εσT s 3 , (F sh + F lh )/4εσT s 3 , (Su + Sd )/4εσT s 3 longwave radiation on surface budget is shown by
and R/4εσT s 3 ) in equation (3) for the four seasons Kumar et al (2021).
during 1950–2020 (figures 2(e)–(l) and S2(a)–(h)).
The distribution and magnitude of linear trends of 3.2. Causes of Antarctic surface climate change
ld /4εσT s 3 were very similar to skin temperature over The downward longwave radiation is strongly influ-
most of Antarctica, except in summer and high elev- enced by change in atmospheric temperature and
ations around 0◦ E (figures 2(a)–(h)). Although there cloud properties. To understand the causes of changes
was a widespread positive trend in (F sh + F lh )/4εσT s 3 in downward longwave radiation over our 71 year
over the interior of East Antarctica in summer, study period, we analyzed linear trends of air tem-
they were very weak in general (figure 2(j)). Very perature at 2 m (T2m) and vertical integral of
few trends in the other three seasons were signi- water vapor flux for each season from 1950 to 2020
ficant (figures 2(i), (k) and (l)). The linear trends (figures 3(a)–(d)). Over West Antarctica and the Ant-
of (Su + Sd )/4εσT s 3 were very small in all seasons arctic coastal regions, the trends in T2m were very
because of the high albedo of the snow/ice cover similar to skin temperature in all seasons, meaning
over Antarctica (figures S2(a)–(d)). During spring that surface air temperature warming has key role in
and summer, the ozone hole reduces absorption of skin temperature warming. Increases in air temperat-
shortwave radiation in the ozone layer, influencing ure are induced by enhanced warm advection from
surface climate thorough changes in atmospheric cir- the middle latitudes (Simmonds and Murray 1999,
culation and increased downward shortwave radi- Simmonds and Keay 2000, Simmonds et al 2002,
ation at the surface (Thompson and Solomon 2002, Simmonds 2003, 2015, Simmonds and King 2004,
Thompson et al 2011). However, increases in surface Hosking et al 2013, Clem et al 2017), in agreement
5Environ. Res. Lett. 16 (2021) 064059 K Sato and I Simmonds
with poleward advection increase from midlatitude 1950 to 2020 (figures S3(e)–(h)). In all seasons, MCC
(figures 3(a)–(d)). showed statistically significant positive trends over
To illustrate the impact of local and large-scale the interior of East Antarctica, where there are rel-
changes on Antarctic climate, the linear trends of atively large differences in temperature between air
SLP and sea ice cover for each season are shown and ground (figures 2(a)–(d), 3(a)–(d) and S3(e)–
in figures 3(e)–(h). Although there were negative (h)). These results indicate that enhanced cloud
SLP trends around Antarctica in all seasons, the SLP cover increases downward longwave radiation and
pattern strongly resembled the positive SAM phase in subsequent skin temperature increases in all seasons
summer, which is consistent with Jones et al (2019). except summer over the interior of East Antarctica.
Rudeva and Simmonds (2015) and Grieger et al Over this region, the weak wind and strong tem-
(2018) also highlighted the tight connections between perature inversion in winter reduces heat exchange
SAM, cyclones, and southward moisture transport. between air and snow and influences the temperature
In autumn, negative SLP pattern is similar to neg- difference between the air and surface (Heinemann
ative phase of the Pacific–South American, which et al 2019). Although warm and moist advection
induces an east-west seesaw pattern of warm and from lower latitudes is weak, there were significant
cold advection over West Antarctica (Marshall and increases in total column clouds water and moisture
Thompson 2016). The circumpolar westerlies asso- advection (figures 3(a)–(d) and S3(i)–(l)). However,
ciated with these negative SLP patterns causes warm cold conditions over interior East Antarctica is very
advection from the South Pacific to the high lat- conducive to the formation of clouds, in spite of rel-
itudes, which leads to air temperature warming in atively little moisture advection. Therefore, increase
all seasons over the Antarctic Peninsula and West in moisture advection from lower latitude over East
Antarctica (figure 3). In addition, sea ice concentra- Antarctica interior would contribute to increasing
tions decreased to the west of the Antarctic Peninsula clouds in low level.
in all seasons (figures 3(e)–(h)), which would lead
to increasing evaporation and heat from the affected 3.3. Trends in three key Antarctic regions over
ocean (Turner et al 2013) and result in enhanced various time intervals
air temperature and water vapor. Over the southern Our analysis shows the dominant role played by
Weddell Sea, the northerly warm and moist advec- downward longwave radiation in determining the
tion associated with negative SLP over the Atlantic overall trend in Antarctic skin temperature over our
sector high latitudes induced the increase in air tem- 71 year study interval. However, it is unclear whether
perature in spring and summer (figures 3(a), (b), (e) this finding would hold true if only various inter-
and (f)). Further to the west, deepening of the ASL vals within the 71 year study period (hereafter seg-
drives northward cold and dry advection from Ant- ments) were considered, which would establish a
arctica over the Ross Sea in summer and autumn physical connection between these two parameters.
(figures 3(b), (c), (f) and (g)). In addition, over the The structure of figure 1 suggests that any calcu-
most of East Antarctica coastal region, the north- lated trend is strongly dependent on the chosen
erly warm and moist advection from Southern Ocean start and end years, echoing similar comments by
causes air temperature increases (figure 3). There- Nicolas and Bromwich (2014) and Gonzalez and
fore, increases in warm and moist advection from the Fortuny (2018). To investigate this, we used two-
middle latitudes have a direct effect on air temper- dimensional linear change diagrams to display tem-
ature warming and an indirect effect on skin tem- perature trends on a continuum (in steps of one year)
perature increases in these regions (figures 2(a)–(d) of initial and end years. We constructed these dia-
and 3(a)–(d)). grams for three key regions, West Antarctica, East
Conversely, over the interior of East Antarc- Antarctica, and the Antarctic Peninsula (figure S4)
tica, the magnitude of air temperature warming as our analyses pointed to distinct behaviors of these
was smaller than skin temperature because of rel- subdomains.
atively weaker warm advection from lower latitudes Figure 4 shows the two-dimensional spatially
(figures 2(a)–(d) and 3(a)–(d)). Over the high lat- averaged skin temperature trend diagram for these
itudes, long and shortwave radiation at the sur- regions in all four seasons. In autumn and winter, the
face are strongly influenced by clouds. In fact, the warming trends in the 1950s–1960s and early 1980s–
magnitudes of linear trends of downward longwave 2010s were most significant in all three regions with
radiation for clear sky (ld_sky )/4εσT s 3 without cloud the greatest warming in East Antarctica (figures 4(c),
forcing are smaller than those of ld /4εσT s 3 for all (d), (g), (h), (k) and (l)). Over East Antarctica, signi-
seasons (figures 2(e)–(h) and S3(a)–(d)), meaning ficant warming also occurred in winter in the 1960s-
that change in cloud has also impact on downward early 1970s and early 1980s–2010s (figure 4(d)). East
longwave radiation change, in particular over the Antarctica exhibited the widest range of segments
interior of East Antarctica. For that higher-elevation with significant temperature changes in winter. In
region, trends of middle level clouds between 800 spring, although significant warming was observed
and 450 hPa (MCC) are shown for each season from over West Antarctica in some segments starting before
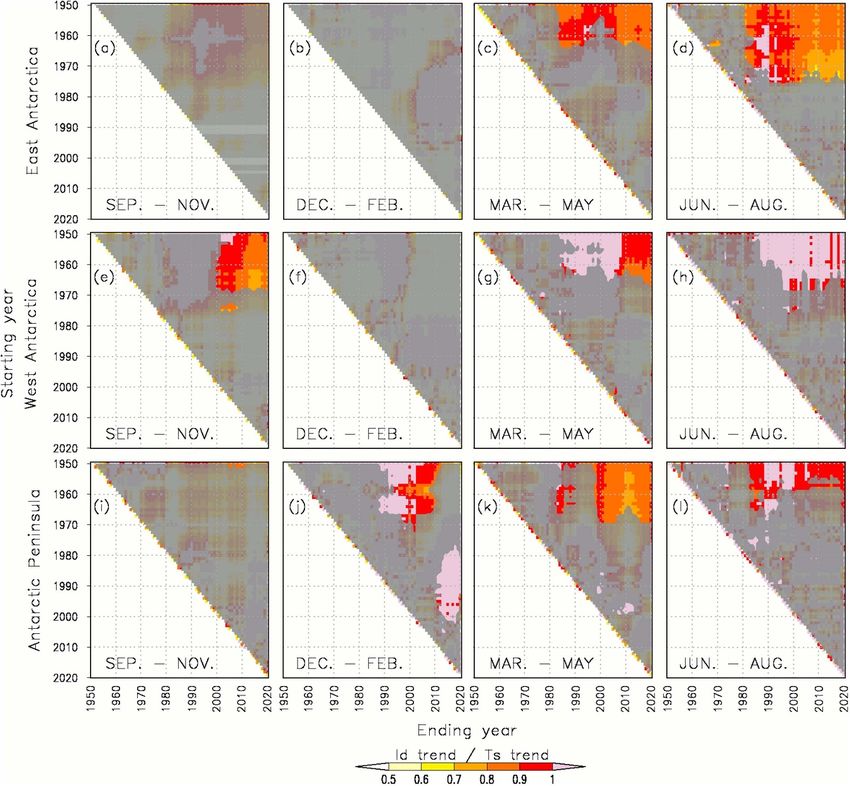
6Environ. Res. Lett. 16 (2021) 064059 K Sato and I Simmonds Figure 4. Two-dimensional linear change diagrams of spatially averaged skin temperature (◦ C decade−1 ) for (a) spring, (b) summer, (c) autumn and (d) winter in East Antarctica. Data for West Antarctica (e)–(h) and the Antarctic Peninsula (i)–(l) are also shown. All data are plotted along the final year of the studied time interval (horizontal axis) against the starting year (vertical axis). The gray shading overlays areas where the trends are not significant at the 95% confidence level. the late 1960s and ending after the early 2000s in Antarctic sea ice extent (Simmonds 2015). We do (figure 4(e)), there were no significant changes over note, however, that 2020 established a new temperat- East Antarctica or the Antarctic Peninsula even in ure record for Antarctica (figure 1(a)), a year in which longer segments (figures 4(a) and (i)). In summer, the global average surface temperature tied for the only the Antarctic Peninsula exhibited significant hottest on record (Lenssen et al 2019). For more short trends (figures 4(b), (f) and (j)). Significant warm- segments (
Environ. Res. Lett. 16 (2021) 064059                                                                                 K Sato and I Simmonds

   Figure 5. Two-dimensional linear change diagrams of the ratio of downward longwave radiation (ld )/4εσT s 3 and skin
   temperature trends for (a) spring, (b) summer, (c) autumn and (d) winter in East Antarctica. Data for West Antarctica
   (e)–(h) and the Antarctic Peninsula (i)–(l) are also shown. All data are plotted along the final year of the studied time interval
   (horizontal axis) against the starting year (vertical axis). The gray shading overlays areas where the trends are not significant at the
   95% confidence level.

(h)). In addition, high ratio values were found in                      data have the best performance of air surface
short segments for the Antarctic Peninsula in summer                    temperature interannual variability compared with
when there was a negative trend in skin temperature                     other reanalysis data (Huai et al 2019). Compared
changes (figure 5(j)). These results indicate that spa-                 with ERA-Interim, the accuracy of air temperatures
tial and temporal Antarctic skin temperature changes                    in the ERA5 is improved, as it is the successor data
are overwhelmingly explained by changes in longwave                     set to ERA-Interim (Gossart et al 2019, Tetzner et al
radiation.                                                              2019, Hillebrand et al 2020). In addition, compar-
                                                                        isons of air temperature at 2 m from ERA5 with air
4. Discussion and summary                                               temperature data at 14 Antarctica stations from each
                                                                        start observation years to 2020 showed that simu-
To investigate long term trends in atmospheric and                      lated T2m was in good agreement with in situ air
oceanic parameters, we used the preliminary version                     temperature at Antarctica stations (figure S6 and
of ERA5 data for pre-satellite era of 1950–1978. In this                table S1). The correlation coefficients of air tem-
first part of the ERA5 data set, the central pressure of                perature between ERA5 and observations attain at
some tropical cyclones was significantly lower than                     least 0.8 except for five stations. At three stations
observations, but many other aspects of this data-                      (d’Urville, Mawson and Halley), although cooling air
set were satisfactory and robust (https://confluence.                   temperature trends are observed over the 71 years,
ecmwf.int/display/CKB/ERA5+back+extension+19                            the opposite trends are found in ERA5. At these
50-1978+%28Preliminary+version%29%3A+tropi                              stations, difference in air temperature bias for each
cal+cyclones+are+too+intense). The ERA-Interim                          period would result from difference in number of

                                                         8
Environ. Res. Lett. 16 (2021) 064059 K Sato and I Simmonds
assimilated observation data around these stations Data availability statement
into ERA5 (Sato et al 2020), causing air temperat-
ure trend bias in ERA5. However, almost upper air All data that support the findings of this study are
temperatures at ten Antarctica stations in ERA5 have included within the article (and any supplementary
relatively high correlations (>0.80), indicating that files).
ERA5 is an effective tool to investigate the climate
change in Antarctica (figure S7 and table S2).
The long-term surface air temperature trend, Acknowledgments
which showed the greatest warming over the Ross
Sea in spring and a relative warming trend over This work was supported by a JSPS Overseas Research
the Antarctic Peninsula in autumn and winter Fellowship (JSPS KAKENHI 20H04963, 19K14802)
(figures 3(a)–(d)), is consistent with that found by awarded to K.S. I.S. was supported by the Aus-
Jones et al (2019). The long term air temperature tralian Research Council (Grant No. DP160101997).
trends over the Peninsula is indicator of local scale We would like to thank two anonymous reviewers
variability compared to short period less than 30 years for very helpful comments. We thank Sev Kender,
(Gonzalez and Fortuny 2018, Jones et al 2019). In PhD, from Edanz Group (https://en-author-services.
fact, Jones et al (2019) showed that changes in ocean edanz.com/ac) for correcting a draft of this manu-
surface temperatures influence air temperatures over script.
coastal Antarctic stations in all seasons from 1957 to
2016. Therefore, skin temperature warming trends ORCID iDs
would be seen even in newer reanalysis data sets that
have an improved reproduction of tropical cyclones. Kazutoshi Sato https://orcid.org/0000-0003-0216-
In fact, Antarctic warming trends for long periods 8942
(> 60 years) were also seen in the other reanalysis Ian Simmonds https://orcid.org/0000-0002-4479-
data sets (e.g. ERA20C and JRA55), whereas the amp- 3255
litude of changes in Antarctic temperature was dif-
ferent among the reanalysis data sets (figures S1 and
S8(a)–(d)). References
In summary, we examined Antarctic skin tem-
perature changes since 1950 and their causes using Bozkurt D, Bromwich D H, Carrasco J, Hines K M, Maureira J C
and Rondanelli R 2020 Recent near-surface temperature
the reanalysis data from ERA5. These changes were trends in the Antarctic Peninsula from observed, reanalysis
explored over the entire record (1950–2020), as well and regional climate model data Adv. Atmos. Sci.
as in specific segments of the study interval. For 37 477–93
long segments (>30 years) starting before 1960, Bromwich D H, Nicolas J P, Monaghan A J, Lazzara M A,
Keller L M, Weidner G A and Wilson A B 2012 Central West
all Antarctic regions showed significant warming Antarctica among the most rapidly warming regions on
in autumn and winter. Conversely, the Antarctic Earth Nat. Geosci. 6 139–45
Peninsula showed significant warming trends in sum- Chiodo G, Polvani L M and Previdi M 2017 Large increase in
mer over long segments and cooling trends over short incident shortwave radiation due to the Ozone Hole offset
by high climatological albedo over the Antarctic J. Clim.
segments. The increase in downward longwave radi- 30 4883–90
ation related to increases in air temperatures play Ciasto L M, Simpkins G R and England M H 2015 Teleconnections
a major role in skin temperature warming in all between tropical Pacific SST anomalies and extratropical
regions; the same is true for the opposite, i.e. that Southern Hemisphere climate J. Clim. 28 56–65
Clem K R, Renwick J A and McGregor J 2017 Large-scale forcing
decreases in downward longwave radiation and air of the Amundsen Sea low and its influence on sea ice and
temperatures affect skin temperature cooling. The West Antarctic temperature J. Clim. 30 8405–24
circumpolar westerly flow associated with negative Clem K R, Renwick J A and McGregor J 2018 Autumn cooling of
SLP trends around Antarctica promotes northerly Western East Antarctcia linked to the Tropical Pacific
J. Geophys. Res. 123 89–107
warm and moist advection over the Antarctic Pen- Clem R K and Fogt L R 2013 Varying roles of ENSO and SAM on
insula and West Antarctica. Over the interior of East the Antarctic Peninsula climate in austral spring J. Geophys.
Antarctica, increases moisture advection enhance low Res. Atmos. 118 11481–92
level cloud cover, which leads to skin temperature Clem R K and Fogt L R 2015 South Pacific circulation changes
and their connection to the tropics and regional Antarctic
warming. Our results are consistent with those from warming in austral spring 1979–201.2 J. Geophys. Res.
the Arctic (Lee et al 2017) in that broad temporal 120 2773–92
and spatial changes in Antarctic surface temperat- Clem R K, Renwick A J, McGregor J and Fogt L R 2016 The
ures are strongly associated with variations in atmo- relative influence of ENSO and SAM on Antarctica
Peninsula climate J. Geophys. Res. 121 9324–41
spheric moisture loading and the subsequent impacts Dee D P et al 2011 The ERA-interim reanalysis: configuration and
of ‘greenhouse’ modification in downward longwave performance of the data assimilation system Q. J. R.
radiation. Meteorol. Soc. 137 553–97
9Environ. Res. Lett. 16 (2021) 064059 K Sato and I Simmonds
Ding Q and Steig E J 2013 Temperature change on the Antarctic Lenssen N J L, Schmidt G A, Hansen J E, Menne M J, Persin A,
Peninsula linked to the tropical Pacific J. Clim. Ruedy R and Zyss D 2019 Improvements in the GISTEMP
26 7570–85 uncertainty model J. Geophys. Res. 124 6307–26
Ding Q, Steig E J, Battisti D S and Kuttel M 2011 Winter warming Lesins G, Duck T J and Drummond J R 2012 Surface energy
in West Antarctica caused by central tropical Pacific balance framework for Arctic amplification of climate
warming Nat. Geosci. 4 398–403 change J. Clim. 25 8277–88
Ding Q, Steig J E, Battisti S D and Wallace M J 2012 Influence of Li X, Holland D M, Gerber E P and Yoo C 2014 Impacts of the
the Tropics on the Southern Annular Mode J. Clim. north and tropical Atlantic Ocean on the Antarctic
25 6330–48 Peninsula and sea ice Nature 505 538–42
Fogt R L and Marshall G J 2020 The Southern Annular Mode: Li X, Holland D, Gerber P and Yoo C 2015 Rossby waves mediate
variability, trends, and climate impacts across the Southern impacts of tropical oceans on West Antarctic atmospheric
Hemisphere Wiley Interdiscip. Rev.-Clim. Change 11 e652 circulation in austral winter J. Clim. 28 8151–64
Fogt R L, Wovrosh A J, Langen R A and Simmonds I 2012 The Liess S, Kumar A, Snyder K P, Kawale J, Steinhaeuser K,
characteristic variability and connection to the underlying Semazzi H M F, Ganguly R A, Samatova F N and Kumar V
synoptic activity of the Amundsen-Bellingshausen Seas Low 2014 Different modes of variability over the Tasman Sea:
J. Geophys. Res. 117 D07111 implications for regional climate J. Clim. 27 8466–86
Gonzalez S and Fortuny D 2018 How robust are the temperature Liu N, Jia Z, Chen H, Hua F and Li Y 2005 Southern high latitude
trends on the Antarctic Peninsula? Antarct. Sci. 30 322–8 climate anomalies associated with the Indian Ocean dipole
Gossart A, Helsen S, Lenaerts J T M, Vanden Broucke S, Van mode Chin. J. Ocean. Limnol. 24:2 125–8
Lipzig N P M and Souverijns N 2019 An evaluation of Marshall J G and Thompson J W 2016 The signatures of
surface climatology in state-of-the-art reanalyses over the large-scale patterns of atmospheric variability in Antarctic
Antarctic Ice Sheet J. Clim. 32 6899–915 surface temperature J. Geophys. Res. 121 3276–89
Grieger J, Leckebusch G C, Raible C C, Rudeva I and Simmonds I Nicolas J P and Bromwich D H 2014 New reconstruction of
2018 Subantarctic cyclones identified by 14 tracking Antarctic near-surface temperatures: multidecadal trends
methods, and their role for moisture transports into the and reliability of global reanalyses J. Clim. 27 8070–93
continent Tellus 70A 1454808 Nuncio M and Yuan X 2015 The influence of the Indian Ocean
Heinemann G, Glaw L and Willmes S 2019 A satellite-based dipole on Antarctic sea ice J. Clim. 28 2682–90
climatology of wind-induced surface temperature anomalies O’Donnell R, Lewis N, McIntyre S and Condon J 2010 Improved
for the Antarctic Remote Sens. 11 1539 methods for PCA-based reconstructions: case study using
Hersbach H et al 2020 The ERA5 global reanalysis Q. J. R. the Steig et al (2009) Antarctic temperature reconstruction
Meteorol. Soc. 146 1999–2049 J. Clim. 24 2099–115
Hillebrand F L, Bremer U F, Arigony-Neto J, Da Rosa C N, Pezza A B, Rashid H A and Simmonds I 2012 Climate links and
Mendes C W, Costi J Jr., De Freitas M W D and Schardong F recent extremes in Antarctic sea ice, high-latitude cyclones,
2020 Comparison between atmospheric reanalysis models Southern Annular Mode and ENSO Clim. Dyn.
ERA5 and ERA-interim at the North Antarctic Peninsula 38 57–73
Region Ann. Am. Assoc. Geogr. 111 1147–59 Poli P et al 2016 ERA-20C: an atmospheric reanalysis of the
Hosking J S, Orr A, Marshall G J, Turner J and Phillips T 2013 The twentieth century J. Clim. 29 4083–97
influence of the Amundsen-Bellingshausen Seas low on the Pritchard H D, Arthern R J, Vaughan D G and Edwards L A 2009
climate of West Antarctica and its representation in coupled Extensive dynamic thinning on the margins of the
climate model simulations J. Clim. 26 6633–48 Greenland and Antarctic ice sheets Nature 461 971–5
Huai B, Wang Y, Ding M, Zhang J and Dong X 2019 An assessment Pritchard H D and Vaughan D G 2007 Widespread acceleration of
of recent global atmospheric reanalyses for Antarctic near tidewater glaciers on the Antarctic Peninsula J. Geophys. Res.
surface air temperature Atmos. Res. 226 181–91 112 F03S29
Irving D and Simmonds I 2015 A novel approach to diagnosing Retamales-Muñoz G, Durán-Alarcón C and Mattar C 2019 Recent
Southern Hemisphere planetary wave activity and its land Surface temperature patterns in Antarctica using
influence on regional climate variability J. Clim. satellite and reanalysis data J. South Am. Earth Sci.
28 9041–57 95 102304
Irving D and Simmonds I 2016 A new method for identifying the Rudeva I and Simmonds I 2015 Variability and trends of global
Pacific–South American pattern and its influence on atmospheric frontal activity and links with large-scale
regional climate variability J. Clim. 29 6109–25 modes of variability J. Clim. 28 3311–30
Jones M E, Bromwich D H, Nicolas J P, Carrasco J, Plavcova E, Saha S et al 2010 The NCEP climate forecast system reanalysis
Zou X and Wang S H 2019 Sixty years of widespread Bull. Am. Meteorol. Soc. 91 2185–208
warming in the Southern Middle and High Latitudes Saha S et al 2014 The NCEP climate forecast system version 2
(1957–2016) J. Clim. 32 6875–98 J. Clim. 27 2185–208
Jun S Y, Kim J H, Choi J, Kim S J, Kim B M and An S I 2020 The Sato K, Inoue J, Simmonds I and Rudeva I 2021 Antarctic
internal origin of the west-east asymmetry of Antarctic Peninsula warm winters influenced by Tasman Sea
climate change Sci. Adv. 6 Eaas1490 temperatures Nat. Comms. 12 1497
Kobayashi S et al 2015 The JRA-55 reanalysis: general Sato K, Inoue J, Yamazaki A, Hirasawa N, Sugiura K and
specifications and basic characteristics J. Meteor. Soc. Japan Yamada K 2020 Antarctic radiosonde observations reduce
93 5–48 uncertainties and errors in reanalyses and forecasts over the
Kumar A, Yadav J and Mohan R 2021 Seasonal sea-ice variability southern ocean: an extreme cyclone case Adv. Atmos. Sci.
and its trend in the Weddell Sea sector of West Antarctica 37 431–40
Environ. Res. Lett. 16 024046 Schneider P D, Deser C and Okumura Y 2011 An assessment and
Kusahara K 2020 Interannual-to-Multidecadal responses of interpretation of the observed warming of West Antarctica
Antarctic Ice Shelf-Ocean interaction and coastal water in the austral spring Clim. Dyn. 38 323–47
masses during the twentieth century and the early Screen J A, Bracegirdle T J and Simmonds I 2018 Polar climate
twenty-first century to dynamic and thermodynamic forcing change as manifest in atmospheric circulation Curr. Clim.
J. Clim. 33 4941–73 Change Rep. 4 383–95
Lee S, Gong T, Feldstein S B, Screen J A and Simmonds I 2017 Screen J A and Simmonds I 2012 Half-century air temperature
Revisiting the cause of the 1989–2009 Arctic surface change above Antarctica: observed trends and spatial
warming using the surface energy budget: downward reconstructions J. Geophys. Res. 117 D16108
infrared radiation dominates the surface fluxes Geophys. Res. Simmonds I 2003 Modes of atmospheric variability over the
Lett. 44 10654–61 Southern Ocean J. Geophys. Res. 108 8078
10Environ. Res. Lett. 16 (2021) 064059 K Sato and I Simmonds
Simmonds I 2015 Comparing and contrasting the behaviour of Thompson D W J and Solomon S 2002 Interpretation of recent
Arctic and Antarctic sea ice over the 35 year period Southern Hemisphere climate change Science 296 895–9
1979–2013 Ann. Glaciol. 56 18–28 Thompson D W J, Solomon S, Kushner P J, England M H,
Simmonds I and Keay K 2000 Mean Southern Hemisphere Grise K M and Karoly D J 2011 Signatures of the Antarctic
extratropical cyclone behavior in the 40 year NCEP-NCAR ozone hole in Southern Hemisphere surface climate change
reanalysis J. Clim. 13 873–85 Nat. Geo. 4 741–9
Simmonds I, Keay K and Lim E P 2002 Synoptic activity in the Turner J, Colwell S R, Marshall G J, Lachlan-Cope T A,
seas around Antarctica Mon. Weather Rev. Carleton A M, Jones P D, Lagun V, Reid P A and Iagovkina S
131 272–88 2004 The SCAR READER project: toward a high-quality
Simmonds I and King J C 2004 Global and hemispheric climate database of mean Antarctic meteorological observations
variations affecting the Southern Ocean Antarc. Sci. J. Clim. 17 2890–8
16 401–13 Turner J, Lu H, White I, King J C, Phillips T, Hosking J S,
Simmonds I and Murray R J 1999 Southern extratropical cyclone Bracegirdle T J, Marshall G J, Mulvaney R and Deb P 2016
behavior in ECMWF analyses during the FROST special Absence of 21st century warming on Antarctic
observing periods Weather Forecast. 14 878–91 Peninsula consistent with natural variability Nature
Steig E J, Schneider D P, Rutherford S D, Mann M E, Comiso J C 535 411–5
and Shindell D T 2009 Warming of the Antarctic ice-sheet Turner J, Maksym T, Phillips T, Marshall G J and Meredith M P
surface since the 1957 International Geophysical Year Nature 2013 The impacts of changes in sea ice advance on the large
457 459–62 winter warming on the western Antarctic Peninsula
Tetzner D, Thomas E and Allen C 2019 A validation of ERA5 Int. J. Climatol. 33 852–61
reanalysis data in the southern Antarctic Yiu Y Y S and Maycock A C 2019 On the seasonality of the El
Peninsula-Ellsworth Land Region, and its implications for Niño teleconnection to the Amundsen sea region J. Clim.
ice core studies Geosciences 9 289 32 4829–45
11You can also read