Increased cyclone destruction potential in the Southern Indian Ocean - IOPscience
←
→
Page content transcription
If your browser does not render page correctly, please read the page content below
LETTER • OPEN ACCESS

Increased cyclone destruction potential in the Southern Indian Ocean
To cite this article: P J Vidya et al 2021 Environ. Res. Lett. 16 014027

View the article online for updates and enhancements.

                                This content was downloaded from IP address 46.4.80.155 on 19/04/2021 at 14:29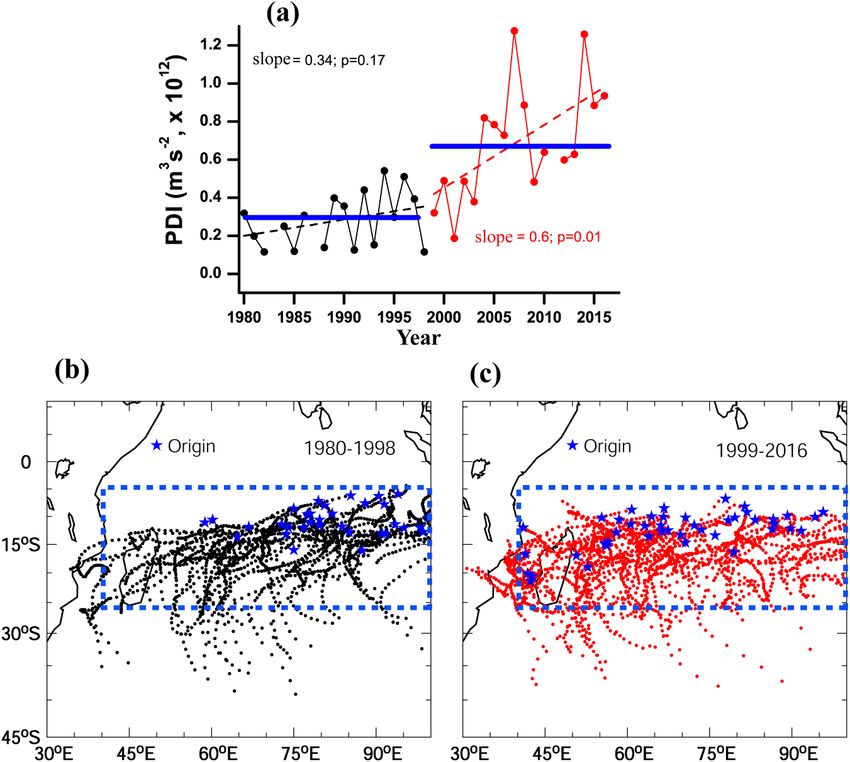
Environ. Res. Lett. 16 (2021) 014027                                                      https://doi.org/10.1088/1748-9326/abceed

                              LETTER

                              Increased cyclone destruction potential in the Southern Indian
OPEN ACCESS
                              Ocean
RECEIVED
14 April 2020                 P J Vidya1, M Ravichandran1, R Murtugudde2,3, M P Subeesh1, Sourav Chatterjee1, S Neetu4 and M Nuncio1
REVISED                       1
17 November 2020
                                  National Centre for Polar and Ocean Research (NCPOR), Ministry of Earth Sciences, Vasco-da-Gama, Goa 403 804, India
                              2
                                  Interdisciplinary Programme in Climate Studies, Indian Institute of Technology, Bombay, India
ACCEPTED FOR PUBLICATION      3
                                  ESSIC, University of Maryland, College Park, MD, United States of America
30 November 2020              4
                                  CSIR-National Institute of Oceanography, Dona Paula, Goa 403004, India
PUBLISHED
28 December 2020              E-mail: vidya@ncpor.res.in

                              Keywords: Southern Indian Ocean, Power Dissipation Index, tropical cyclones, slowdown of cyclones, sea surface temperature
Original content from
this work may be used         Supplementary material for this article is available online
under the terms of the
Creative Commons
Attribution 4.0 licence.
Any further distribution      Abstract
of this work must             The present study examines the role of the Southern Indian Ocean (SIO) warming on the cyclone
maintain attribution to
the author(s) and the title   destruction potential or Power Dissipation Index (PDI) during two contrasting periods of
of the work, journal
citation and DOI.             1980–1998 and 1999–2016. The PDI in the SIO during 1999–2016 is found to have doubled
                              compared to the same during 1980–1998. PDI was computed using the tropical cyclone track data
                              in the SIO region for cyclone category three and above. The increasing trend in PDI during the
                              latter period is primarily due to an increase in the intensity of cyclones and their duration. The
                              increasing PDI is associated with a sea surface temperature warming and an upper ocean heat
                              content increase as well as a significant slowdown in translation speeds. The increase in upper
                              ocean heat content during the recent decades enhances the intensification of cyclones and their
                              duration, which is consistent with the slowdown of cyclones. Analysis of the relevant atmospheric
                              parameters indicates that processes in the atmosphere did not play a major role in the recent
                              decades in increasing cyclone intensity. We show that in the SIO, ocean processes play a major role
                              in the PDI rise during the recent period. Any continued increase in PDI will cause more loss of life
                              and socioeconomic damage to the island countries such as Mozambique, Mauritius, Mascarene
                              Islands and Madagascar, as well as the coastal inhabitants along East Africa.

                              1. Introduction                                                    oceanic properties, a large number of tropical cyc-
                                                                                                 lones form in the Southwestern Indian Ocean, which
                              Tropical cyclones (TCs) (cyclones in the Indian                    also show a relation to the modes of coupled climate
                              Ocean), also called typhoons (in the Pacific) or                   variability (Burns et al 2016).
                              hurricanes (in the Atlantic), are among the most                        The loss of property and life have been well-
                              hazardous natural calamities that affect the coastal               documented in this region. For example, tropical cyc-
                              regions (Blake et al 2011). TCs are characterized by               lone ‘Idai’ (4–21 March 2019) was one of the most
                              intense circular storm centered around low atmo-                   severe tropical cyclones that affected the Southern
                              spheric pressure, with strong winds, and heavy rain-               Indian Ocean (SOI). Idai made landfall in Mozam-
                              fall causing loss of life and property damage. Vari-               bique, where more than 1300 people were killed, and
                              ability and change in the number, intensity and rate               more than 3 million people were directly affected. It
                              of intensification of the TCs are vital owing to their             is one of the costliest cyclones in the southwestern
                              observed response to global warming (Li et al 2010).               Indian Ocean, with total damage estimated at approx-
                              On the positive side, TCs contribute significantly to              imately $2.2 billion. Just after four weeks of cyclone
                              rainfall over the affected regions (Lyon and Camargo               Idai, another intense cyclone ‘Kenneth’ formed in the
                              2009, Pezza et al 2012). Cyclones are argued to be                 region during 21–29 April 2019, which also caused
                              a part of the poleward heat transport required by                  considerable socioeconomic damage. With the expec-
                              the equator-to-pole temperature gradient (Emanuel                  ted continuation of the Indian Ocean warming, and
                              2001, Uotila et al 2011). Due to its atmospheric and               its relation and feedback to the Pacific warming, the

                              © 2020 The Author(s). Published by IOP Publishing Ltd
Environ. Res. Lett. 16 (2021) 014027                                                                   P J Vidya et al

importance of understanding the factors influencing            Where V max is the maximum surface wind speed
the number and intensity of TCs in this region is obvi-    at each 6 h time interval (t) over the cyclone dura-
ous (Zhang et al 2019b).                                   tion (τ ). The annual PDI in each year is defined as
    Earlier studies (Emanuel 2005, Webster 2005)           the summation of all the cyclones (N) that occur dur-
have shown that cyclone frequency, and intensity are       ing the cyclone season (November–April). In order
directly linked to an increase in sea surface temperat-    to avoid the over-weighting of the contribution by
ures (SSTs) caused by natural modes of climate vari-       any particular cyclone, Emanuel (2007) proposed
ability and/or global warming. Zhang et al (2018) and      velocity-weighted duration (Dwti ) of a cyclone as fol-
Vidya et al (2020) have reported that the SIO SST and      lows,
upper ocean heat content have increased significantly
during the last two decades. This warming is mainly                                   ∫0τ Vmax dt
                                                                             Dwti =                              (2)
due to the increased advection of upper-ocean warm                                       Vsmax
water from the western Pacific through the Indone-             Where Vsmax is the lifetime peak intensity of the
sian Throughflow (ITF; Lee et al 2015, Dong and            cyclone. The average duration of all the cyclones in
Mcphaden 2016, Zhang et al 2018). The apparent sec-        each season is calculated as follows,
ular variability in the tropical Pacific warming contin-
                                                                                      1 ∑
ues to be debated (England et al 2014), especially in                                   N

terms of the relative warming rates of the eastern and                       Dwt =        Dwti                   (3)
                                                                                      N 1
western halves of this important region (Cane et al
1997, Kosaka and Xie 2013, England et al 2014, Zhang           The annual averaged intensity (in wind speed
et al 2018, Seager et al 2019). Increased advection of     cubed) during November–April in each year is calcu-
this warm western Pacific water into the SIO (Vidya        lated as follows,
et al 2020) can significantly contribute to the TC
                                                                                ∑N τi 3
characteristics in this region. Warmer oceanic regions                             ∫ V dt
can support the enhanced intensification of the cyc-                         I = 1∑0N max                  (4)
                                                                                    1 Dwti
lones by supplying more energy from the upper ocean
(Emanuel 2000, Wing et al 2007). However, our aim               The above parameters are calculated using the
is not to engage in a debate about the global warm-        best-track tropical cyclone data obtained from the
ing responses of the Pacific and Indian Oceans or the      Joint Typhoon Warning Center (JTWC; source:
relation between them, since the role of the southern      www.metoc.navy.mil/jtwc/jtwc.html?southern-hemi
ocean warming in the Indian Ocean warming may              sphere). The JTWC maintains an archive of trop-
also be an important consideration which has not           ical cyclone data, known as ‘best tracks’ and each
received as much attention (Jayasankar et al 2019b).       best-track data contains positions of tropical cyc-
Our main goal in this study is to examine the role of      lone locations and intensities (maximum sustained
SIO warming on the cyclone destruction potential or        surface winds) at every 6 h interval. We use the Saffir-
Power Dissipation Index (PDI) during two contrast-         Simpson scale to define tropical cyclone categories.
ing periods of 1980–1998 and 1999–2016. The choice         As per Saffir-Simpson scale, wind speeds ranging
of the dividing year for the two periods is motiv-         from 17 to 33 m s−1 are defined as a tropical storm
ated more by the proposed regime shift (Wanson and         (Cat-0), 33–43 m s−1 as category-1, 43–50 m s−1 as
Tsonis 2009) which has also served as the debating         category-2, 50–59 m s−1 as category-3, 59–70 m s−1
point for the so-called global warming hiatus. This        as category-4 and greater than 70 m s−1 as category-5
is discussed further in the Data and Method section        (Cat-5) tropical cyclones. Cyclones of category-3 and
below.                                                     above tend to cause more catastrophic devastation
                                                           over land. In addition, major oceanic and atmo-
2. Data and method                                         spheric responses occur only when the cyclone winds
                                                           become stronger than 59 m s−1 (category-3). Hence,
Most of the cyclones (~85%) in the SIO occur from          in the present study, we have considered only TCs
November to April (Mavume et al 2010). Hence,              with the intensity level of category-3 and above. Our
all the analyses in this study are performed for the       conclusions on the trends are not altered by consid-
period November–April and referred to as the ‘cyc-         ering all the categories.
lone season’. The PDI, a commonly used parameter to             Since a cyclone can impact far away regions from
depict the destructive potential of tropical cyclones,     its center, all the atmospheric variables are averaged
is defined as the cube of the 6 h maximum surface          over the region within a 1000 km radius from the cen-
wind speed integrated over the lifespan of the cyc-        ter of the cyclone track during the days of the cyc-
lones (Emanuel 2005). The PDI is computed using the        lone passage. Atmospheric variables such as relative
methodology provided by Emanuel (2007) as follows,         humidity at 600 hPa, winds at 850 hPa and 200 hPa,
                                                           geopotential height at 850 hPa and the mean sea level
                                τ                          pressure for the period 1980–2016 are obtained from
                      PDI = ∫ V3max dt              (1)    daily means of ERA-interim (Dee et al 2011) with a
                                0

                                              2
Environ. Res. Lett. 16 (2021) 014027 P J Vidya et al
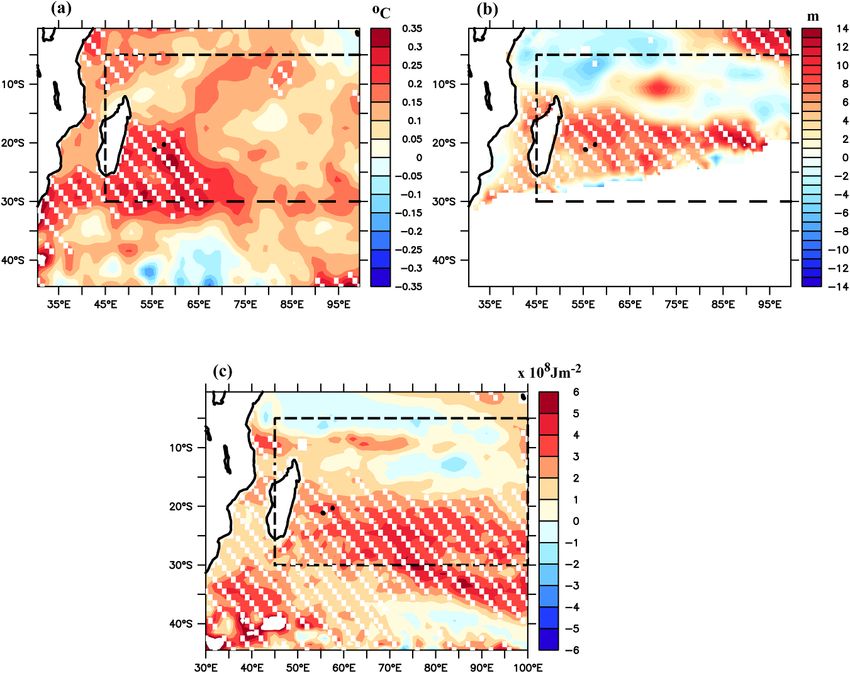
Figure 1. (a) Time series of the Power Dissipation Index (PDI); horizontal blue lines indicate the mean PDI for the respective
period. Cyclone tracks (category three and above) (b) during 1980–1998 and (c) during 1999–2016, in the Southern Indian
Ocean. Blue stars indicate the cyclone origins and the blue dashed box indicates the cyclogenesis (40◦ E–100◦ E and 5◦ S–25◦ S)
region. In (a), slope indicates the regression value and ‘p’ values indicate the significance of the trends. The missing years in (a)
indicate the absence of cyclones with category-3 and above.
spatial resolution of 0.75 × 0.75◦ . Winds at 850 hPa Where ρo is the reference density of seawater
are used to calculate relative vorticity. Vertical wind (1027 kg m−3 ), Cp is the heat capacity of the sea
shear (VWS) is calculated based on the wind speed water at constant pressure, h is the deepest layer
difference between 200 hPa and 850 hPa using the fol- of integration (200 m here), and T is the poten-
lowing equation: tial temperature. The monthly mean ocean potential
temperature with a spatial resolution of 1 × 1 is
Vertical Wind Shear (VWS) = acquired from the European Centre for Medium-
√
2 2 Range Weather Forecasts (ECMWF) Ocean Reana-
(U200hPa − U850hPa ) + (V200hPa − V850hPa )
lysis System 4 (ORAS4) (Balmaseda et al 2013).
(5)
The least-squares linear regression test has been per-
With the above, the annual mean of each para- formed to evaluate the trends. Significance of all the
meter (relative vorticity, relative humidity, and ver- trends are tested with two-tailed t-test at 95% con-
tical wind shear) for each year is calculated. fidence interval. Details of the statistical analysis are
Monthly mean SST is obtained from the Met given in table 1.
Office Hadley Centre’s sea ice and sea surface temper- In the present study, we have considered the cyc-
ature dataset (HadlSST1) for the period 1980–2016 lone characteristics in the SIO for two periods; 1980–
(Rayner et al 2003) with a spatial resolution of 1 × 1 . 1998 and 1999–2016. As mentioned in the Introduc-
The upper-ocean heat content (UOHC) in the upper tion, a regime shift in climate was proposed around
200 m is calculated using the equation 1999 by Wanson and Tsonis (2009), but a debate
has also raged about a potential slowdown in global
h
warming as also stated in the Introduction (Kosaka
UOHC = ρo Cp ∫ T (z) dz (6)
0 and Xie 2013a, England et al 2014, Zhang et al 2018).
3Environ. Res. Lett. 16 (2021) 014027 P J Vidya et al
Table 1. Represents the means of all variables during 1980–1998 and 1999–2016, and corresponding P values and T values. The values,
which are significant above 95% CL, is given in italics.
Variables 1980–1998 1999–2016 P value T value
SST (◦ C) 27.72 27.86 0.14 −1.5
PDI (×1012 m3 s−3 ) 0.28 0.65 0.00 −4.58
Number 4.11 4.61 0.44 −0.78
Intensity (ms−1 ) 51.29 55.27 0.00 −3.59
Duration (days) 6.008 9.88 0.00 −4.25
VWS (ms−1 ) 16.84 17.77 0.05 −2.02
R.H. (%) 53.64 53.04 0.65 0.46
Vorticity (×10−5 s−1 ) −0.54 −0.59 0.22 1.25
UOHC (×1010 J m−2 ) 7.47 7.52 0.03 −2.24
Figure 2. Time series of factors contributing to PDI. (a) Averaged intensity in m s−1 (cube root of intensity), (b) averaged cyclone
duration in days, and (c) cyclone count in the SIO during the cyclone season (November–April). The black line indicates the first
period and red line the second period. Slopes indicate the regression value and ‘p’ values indicate the significance of trends.
Missing years correspond to the absence of cyclones of category-3 and above.
Since the cyclone season in the SIO extends from (Vidya et al 2020). Re-emphasising that our goal is not
November of one year to April of the following year, to focus on the so-called Global Warming Hiatus, we
in the present study, we have considered the year just contrast the two periods for the cyclone charac-
starting from 1999 as the dividing line. As an aside, we teristics and their putative driving mechanisms dur-
note that some earlier studies (for example, Hu and ing the two periods.
Fedorov 2017, Zhang et al 2019a) have argued that
weakening of global warming trend ceased in 2012 3. Results and discussion
and a strong warming occurred during the period
2014–2016; these 3 years are the three warmest years The PDI in the SIO region (5◦ S–25◦ S and 40◦ E–
for our study period. However, SIO shows a similar 100◦ E) shows ~100% increase during the recent dec-
warming trend starting from 1998 to the end of 2016 ades (1999–2016) compared to the preceding two
4Environ. Res. Lett. 16 (2021) 014027 P J Vidya et al
Figure 3. Time series of annual mean (a) SST and (b) upper ocean heat content (UOHC) in the cyclogenesis region (40◦ E–100◦ E
and 5◦ S–25◦ S) and (c) cyclone translation speed calculated from the cyclone tracks. Black dotted lines indicate the trend during
1980–1998 and red dashed lines indicate the trend during 1999–2016. The slope indicates the regression value and ‘p’ values
indicate the significance of the trends.
decades (1980–1998) (figure 1(a)), i.e. almost a doub- (figure 2(c)) is observed during the recent decades.
ling. Although the trends are positive during both However, neither the duration nor the number of
the periods, the trend was not significant during the cyclones show any significant trend during the first
first period. The PDI was computed using the trop- period (figures 2(b) and (c)). Note again that the cyc-
ical cyclone trajectories shown in figures 1(b) and (c), lone PDI, the intensity and duration increased sig-
respectively. Note that an apparent westward shift in nificantly during 1999–2016 compared to 1980–1998
the average position of the cyclogenesis location is (table 1).
evident during the second period. The interannual Malan et al (2013) showed that in the SIO, a
variability is also much higher during the latter period stronger anticyclonic condition to the east of Mad-
compared to the first period, the reasons for which are agascar causes a decreasing trend in tropical cyc-
not the focus here. lones after the monstrous 1997–98 El Niňo event. Gir-
To understand the reason for the increase (doub- ishkumar and Ravichandran (2012) showed that in
ling) in PDI during the recent period, we examined the Bay of Bengal, positive SST anomalies during El
three important factors, viz., cyclone intensity (I), Niňo events cause atmospheric changes which result
duration (D), and frequency (N) which control the in a reduction in the number of cyclones. Consistent
PDI. Duration is the average lifespan of a cyclone cal- with the above studies, we also observe a strength-
culated based on velocity-weighted duration follow- ening anticyclonic pattern to the east of Madagascar
ing equations (2) and (3). Here, we assessed the indi- during recent decades (figure S1 (available online at
vidual variables to understand the importance of each stacks.iop.org/ERL/16/014027/mmedia)). Based on
component to the PDI during both the periods. Sim- figures 2(a) and (b), it can be argued that dur-
ilar to PDI (figure 1(a)), the intensity of cyclones also ing 1999–2016, the increasing trend in PDI is due
showed an increasing trend in both the periods, with a to positive trends in the intensity of the cyclones
stronger trend during 1999–2016 (figure 2(a)). A sig- and their duration. To elicit the reasons for the
nificant increasing trend in the duration (figure 2(b)) increase in cyclone intensity and duration from the
and a decreasing trend in the number of cyclones first to the second period, we further explore the
5Environ. Res. Lett. 16 (2021) 014027 P J Vidya et al
Figure 4. Spatial correlation between (a) PDI and UOHC during 1999–2016. Temporal correlation between, (b) intensity vs.
UOHC, (c) Intensity vs. duration, and (d) intensity vs. translation speed. Black contours in figure 4(a) indicate the 90%
confidence level.
oceanic and atmospheric factors that can influence spatial correlation analysis between UOHC and PDI
them. (figure 4(a)). The UOHC shows a significant pos-
itive correlation with the PDI in the cyclogenesis
3.1. Oceanic parameters and cyclone intensity region (figure 4(a)), indicating that PDI and UOHC
Figures 3(a) and (b) depict the annual mean SST are strongly related during the recent decades. In
and upper ocean heat content (UOHC) in the cyc- addition, the temporal correlation between UOHC
logenesis region (40◦ E–100◦ E; 5◦ S–25◦ S). SST and and intensity is also positive (r = 0.54, p = 0.03;
UOHC are the important oceanic parameters which figure 4(b)), implicating the increase in UOHC for
are directly linked to the cyclone intensity, and hence increased intensification of cyclones and thus the
the PDI (Emanuel et al 2004, Lin et al 2008, 2013). increases in PDI. This is mainly because, the increase
SST (figure 3(a)) and UOHC (figure 3(b)) show an in SST and UOHC help to intensify the cyclone by
increasing trend during the latter period, while trends the sustained supply of heat fluxes to the atmosphere
are not significant during the former. The mean (Emanuel 1987, Mawren and Reason 2017). Our res-
UOHC in the cyclogenesis region has increased by ults are consistent with the previous studies (Manatsa
~0.45 × 10⁹ J m−2 during the second period com- et al 2012, Malan et al 2013, Dilmahamod et al 2016,
pared to the first, and the difference is statistically Mawren and Reason 2017), which also showed an
significant (table 1). In addition, we also calculated increase in UOHC over the SIO for the post-1997 El
the annual mean translation speed during both the Niňo period. We further analyse how these increases
periods. The average translation speed during the first in cyclone intensity affect the cyclone duration and
period was 4.3 ± 0.5 m s−1 , while during the second translation speed.
period it slowed down to 2.7 ± 0.8 m s−1 . In con- Cyclone intensity vs. duration shows a positive
trast to the SST and UOHC, cyclone translation speed correlation as well (r = 0.45; p = 0.005; figure 4(c).
showed a significant decreasing trend across the two However, intensity vs. translation speed shows a neg-
periods (figure 3(c)). ative correlation (r = −0.48; p = 0.008; figure 4(d)).
To identify the exact mechanism for the increase This further confirms that the increase in intens-
in PDI during the recent decades, we perform a ity during the recent decades causes an increase in
6Environ. Res. Lett. 16 (2021) 014027 P J Vidya et al
Figure 5. Differences between 1999–2016 and 1980–1998 in (a) sea surface temperatures between 1999–2016 and 1980–1998, (b)
thermocline depth (D26), (c) upper ocean heat content. Black dashed rectangle indicates the cyclogenesis region. White dots
represent anomalies above the 90% significance level.
cyclone duration associated with a reduced transla- SIO is primarily due to warming of the upper ocean
tion speed. Thus the increased UOHC in the SIO even though we make no arguments for the processes
can be blamed for the increased cyclone intensity and that caused the warming itself. We do want to add
duration (Webster 2005, Malan et al 2013, Emanuel a caveat that the upper-level steering winds are also
2015) due to a more persistent energy availability argued to be important for the slowdown of the cyc-
from the ocean to the surface during the life cycle lones across the globe (Kossin 2018) which is not con-
of a cyclone (Mawren and Reason 2017). Bhatia et al sidered here.
(2019) report a recent increase in cyclone intensific- Recent studies (Liu et al 2015, Dong and
ation rates in the Atlantic basin associated with the Mcphaden 2016, Zhang et al 2018, Jyoti et al 2019,
warming there and our results are consistent with Vidya et al 2020) have indicated a significant warming
their findings. of the SIO since the end of the 20th century. Zhang
In addition, spatial maps of anomalies et al (2018) showed that an increased ITF during the
(second − first period) of SST (figure 5(a)), ther- recent decades is the major contributor to the warm-
mocline depth (figure 5(b)) and heat content in ing in the upper 700 m of the SIO. Intensification of
the upper 200 m (figure 5(c)) also display positive the trade winds over the tropical Pacific during the
changes to the east of Madagascar reaffirming the recent decades has been argued to cause an increase
significant warming of the upper ocean (SIO) across in the ITF (Liu et al 2015, Hu and Sprintall 2017) and
the decades. A deeper thermocline and a larger heat transport more heat from the western Pacific into
content in the western SIO during the latter period SIO. Lee et al (2015) showed that during the recent
impede SST cooling during the cyclone passage and period, Pacific Ocean heat content decreased with a
favour reduced cyclone translation speed and under- simultaneous increase in the SIO heat content. The
lie its intensification into stronger categories. abrupt increase (70% of the global ocean heat) in
The negative correlation between the cyclone the SIO heat content and cooling (reduced heat con-
intensity and translation speed (figure 4(c)) further tent) in the tropical Pacific was also blamed on the
supports our hypothesis. Hence, we believe that the ITF by Ueda et al (2015). The detailed mechanism of
increase in the intensity of the tropical cyclone in the the SIO warming since 1998 and its implications are
7Environ. Res. Lett. 16 (2021) 014027 P J Vidya et al
Figure 6. Time series of (a) vorticity at 850 hPa (10−5 s−1 ), (b) relative humidity at 600 hPa (%), and (c) vertical wind shear
(VWS; m s−1 ) averaged over the 1000 km from the center of the cyclone tracks. Black dotted lines indicate the trends during the
1980–1998 period, and red dashed lines indicate the trends during the 1999–2016 period. Slopes correspond to the regression
value, and ‘p’ values are the significance of the trends.
described in Vidya et al (2020). More recently, Jyoti variables are taken within a 1000 km radius from the
et al (2019) have shown that the resultant warming of center of the cyclones (along their tracks) during the
the SIO caused an increase in seal level rise which is same days of the cyclone passage. Minimum VWS,
37% faster in the SIO than the global mean sea-level maximum relative vorticity and relative humidity are
rise after the regime shift of 2000. Thus, warming of the main atmospheric dynamic and thermodynamic
the SIO during the latter period of our study results factors necessary for the formation of a cyclone (Mat-
in increasing trends in cyclone intensity and dura- suura et al 2003, Emanuel 2007). During the first
tion, which contribute to the total increase in PDI. As period, only the low level relative vorticity shows an
noted earlier, the Indian Ocean meridional overturn- increasing trend (slope = −0.44; p = 0.08), whereas
ing circulation can be expected to play a role in the relative humidity (slope = 0.14; p = 0.57) and VWS
tropical Indian Ocean warming as well, although the (slope = −0.01; p = 0.96) show no significant trends.
timescales of this direct link between the Southern However, during the latter period, none of the atmo-
Ocean and the tropical Indian Ocean remain to be spheric variables, i.e. relative vorticity (slope = −0.1;
quantified. p = 0.45), relative humidity (slope = 0.023; p = 0.88)
or VWS (slope = 0.07; p = 0.76), show any significant
3.2. Influence of atmospheric variables on cyclone trend. To further substantiate this, we also examine
intensity variations in atmospheric variables along the cyclone
In addition to the oceanic parameters, we also assess tracks during the two periods (figures S2 and S3). It
the atmospheric contribution to the increased cyc- is apparent that no significant differences in atmo-
lone intensity and duration from the first to the spheric parameters along the cyclone tracks occur in
second period. The vital atmospheric factors which either period. We can conclude from these that the
can influence the cyclone intensity are (a) low-level atmospheric processes likely did not directly contrib-
relative vorticity at 850 hPa (figure 6(a)), (b) high rel- ute to the increase in cyclone duration and intensity.
ative humidity (RH) at 600 hPa (figure 6(b)), and This also underscores our assertion that the cyclone
(c) minimum VWS (figure 6(c)) between 850 hPa PDI has increased in the recent decades because of the
and 200 hPa (Emanuel 2005). All the atmospheric increase in SST and heat content.
8Environ. Res. Lett. 16 (2021) 014027 P J Vidya et al
4. Conclusion for Polar and Ocean Research (NCPOR), Goa for
their support in this study. We sincerely thank the
PDI over the SIO during 1999–2016 has doubled three anonymous reviewers for their valuable com-
when compared to the decades of 1980–1998 period. ments and suggestions which improved the qual-
The motivation for splitting across 1998–1999 was ity of the manuscript significantly. RM gratefully
based on the proposed climate regime shift which acknowledges the Visiting Faculty position at the
also tends to coincide with the debate about a slow- Indian Institute of Technology, Bombay. All the
down in global warming and changes in the fre- data sets used in this study are freely available, and
quency of the so-called Central Pacific El Niño com- details are mentioned in the data and method sec-
pared to the canonical El Niño (Yeh et al 2009). tion. ORAS4 data was taken from http://apdrc.so
Focusing just on the changes in the cyclone proper- est.hawaii.edu/las/v6/dataset?catitem=16675. ERA-
ties across the two periods, we note an increase in interim data was taken from https://apps.ecmwf.int/d
PDI during the latter period, which we attribute to atasets/data/interim-full-daily/. The NCPOR Contri-
increased cyclone intensity and duration. Analysis of bution No. is J-80/2020-21 and the NIO Contribution
the relevant atmospheric variables clearly indicates No. is 6642.
that the processes in the atmosphere did not seem
to play a major role towards the cyclone intensific-
ation in the SIO. In contrast, increasing trends in
SST, UOHC and a decreasing trend in cyclone trans-
lation speed during the recent decades seem to be References
responsible for the increase in cyclone intensity and
Balmaseda M A, Mogensen K and Weaver A T 2013 Evaluation of
duration and subsequently the increase in the cyc- the ECMWF ocean reanalysis system ORAS4 Q. J. R.
lone PDI. An increase in SST and UOHC provide a Meteorol. Soc. 139 1132–61
more sustained supply of energy, causing a reduc- Bhatia K T, Vecchi G A, Knutson T R, Murakami H, Kossin J,
Dixon K W and Whitlock C E 2019 Recent increases in
tion in translation speed which results in the increase
tropical cyclone intensification rates Nat. Commun.
in cyclone duration and intensity. We show that the 10 635
warming of the SIO during the 1999–2016 period is Blake E S, Landsea C W and Gibney E J 2011 The deadliest,
associated with a deepened thermocline, which inhib- costliest, and most intense United States tropical cyclones
from 1851 to 2010 (and other frequently requested
its the deeper and colder waters from cooling the
hurricane facts) NOAA Technical Memorandum NWS
surface when a cyclone passes over the region. Our NHC-6 (Miami, FL: National Oceanic and Atmospheric
findings that the ocean warming and the increase in Administration, National Weather Service, National
upper ocean heat content are clearly important since Hurricane Center)
Burns J M, Subrahmanyam B, Nyadjro E S and Murty V S N 2016
the projected continuation of SIO warming can be
Tropical cyclone activity over the Southwest Tropical Indian
expected to sustain the increasing trend in PDI. This Ocean J. Geophys. Res. Ocean 121 6389–402
will affect the most climate-vulnerable Indian Ocean Cane M A, Clement A C, Kaplan A, Kushnir Y, Pozdnyakov D,
island nations as well as the countries along the east- Seager R, Zebiak S E and Murtugudde R 1997
Twentieth-century sea surface temperature trends Science
ern coast of Africa. This may cause more loss of life
275 957–60
and socioeconomic damages to the vulnerable island Dee D P et al 2011 The ERA-interim reanalysis: configuration and
countries such as Mozambique (over 30 million), performance of the data assimilation system Q. J. R.
Mauritius (1.3 million inhabitants), and Madagascar Meteorol. Soc. 137 553–97
Deepa J S, Gnanaseelan C, Mohapatra S, Chowdary J S,
(22 million inhabitants), which are located near the
Karmakar A, Kakatkar R and Parekh A 2019 The tropical
western side of the SIO. Notwithstanding the ongo- Indian Ocean decadal sea level response to the Pacific
ing debate about the relative role of the atmospheric decadal oscillation forcing Clim. Dyn. 52 5045–58
bridge vs. the oceanic tunnel in the low-frequency Dilmahamod A F, Hermes J C and Reason C J C 2016
Chlorophyll-a variability in the Seychelles-Chagos
variability of this region (Deepa et al 2019, Jayasankar
thermocline ridge: analysis of a coupled biophysical model
et al 2019a), the impact of the ocean warming on the J. Mar. Syst. 154 220–32
TC genesis and their life cycle and the PDI deserve Dong L and Mcphaden M J 2016 Interhemispheric SST gradient
careful attention. trends in the Indian ocean prior to and during the recent
global warming hiatus J. Clim. 29 9077–95
Emanuel K A 1987 The dependence of hurricane intensity on
Data availability statement climate Nature 326 483–5
Emanuel K A 2015 Effect of upper-ocean evolution on projected
All data that support the findings of this study are trends in tropical cyclone activity J. Clim. 28 8165–70
included within the article (and any supplementary Emanuel K 2000 A statistical analysis of tropical cyclone intensity
Mon. Weather Rev. 128 1139–52
information files).
Emanuel K 2001 Contribution of tropical cyclones to meridional
heat transport by the oceans J. Geophys. Res. Atmos.
Acknowledgments 106 771–14, 781
Emanuel K 2005 Increasing destructiveness of tropical cyclones
over the past 30 years Nature 436 686–8
Authors acknowledge the Ministry of Earth Sci- Emanuel K 2007 Environmental factors affecting tropical cyclone
ences, Govt. of India and Director, National Centre power dissipation J. Clim. 20 5497–509
9Environ. Res. Lett. 16 (2021) 014027 P J Vidya et al
Emanuel K, Desautels C, Holloway C and Korty R 2004 Matsuura T, Yumoto M and Iizuka S 2003 A mechanism of
Environmental control of tropical cyclone intensity J. Atmos. interdecadal variability of tropical cyclone activity over the
Sci. 61 843–58 western North Pacific Clim. Dyn. 21 105–17
England M H, Mcgregor S, Spence P, Meehl G A, Timmermann A, Mavume A, Rydberg L, Rouault M and Lutjeharms J 2010
Cai W, Gupta A S, Mcphaden M J, Purich A and Santoso A Climatology and landfall of tropical cyclones in the
2014 Recent intensification of wind-driven circulation in the South-West Indian Ocean West. Indian Ocean J. Mar. Sci.
Pacific and the ongoing warming hiatus Nat. Clim. Change 8 15–36
4 222–7 Mawren D and Reason C J C 2017 Variability of upper-ocean
Girishkumar M S and Ravichandran M 2012 The influences of characteristics and tropical cyclones in the South West
ENSO on tropical cyclone activity in the Bay of Bengal Indian Ocean J. Geophys. Res. Ocean 122 JC012028
during October–December J. Geophys. Res. Ocean Pezza A, van Rensch P and Cai W 2012 Severe heat waves in
117 C02033 Southern Australia: synoptic climatology and large scale
Hu S and Fedorov A V 2017 The extreme El Niño of 2015–2016 connections. Severe heat waves in Southern Australia:
and the end of global warming hiatus Geophys. Res. Lett. synoptic climatology and large scale connections Clim. Dyn.
44 3816–24 38 209–24
Hu S and Sprintall J 2017 Observed strengthening of interbasin Rayner N A, Parker D E, Horton E B, Folland C K, Alexander L V,
exchange via the Indonesian seas due to rainfall Rowell D P, Kent E C and Kaplan A 2003 Global analyses of
intensification Geophys. Res. Lett. 44 1448–56 sea surface temperature, sea ice, and night marine air
Jayasankar T, Eldho T I, Ghosh S and Murtugudde R 2019a temperature since the late nineteenth century J. Geophys.
Assessment of the interannual variability of local Res. Atmos. 108 4407
atmospheric and ITF contribution to the subsurface heat Seager R, Cane M, Henderson N, Lee D E, Abernathey R and
content of southern tropical Indian Ocean in GECCO2 and Zhang H 2019 Strengthening tropical Pacific zonal sea
ORAS4 using ROMS Glob. Planet. Change 181 102974 surface temperature gradient consistent with rising
Jayasankar T, Murtugudde R and Eldho T I 2019b The Indian greenhouse gases Nat. Clim. Change 9 517–22
Ocean deep meridional overturning circulation in three Ueda H, Kamae Y, Hayasaki M, Kitoh A and Watanabe S 2015
ocean reanalysis products Geophys. Res. Lett. 46 084244 Combined effects of recent Pacific cooling and Nat.
Jyoti J, Swapna P, Krishnan R and Naidu C V 2019 Pacific Commun. 6 1–8
modulation of accelerated south Indian Ocean sea level rise Uotila P, Vihma T, Pezza A B, Simmonds I, Keay K and Lynch A H
during the early 21st century Clim. Dyn. 53 4413–32 2011 Relationships between Antarctic cyclones and surface
Kosaka Y and Xie S 2013 Recent global-warming hiatus tied to conditions as derived from high-resolution numerical
equatorial Pacific surface cooling Nature 501 403–7 weather prediction data J. Geophys. Res. Atmos.
Kossin J P 2018 A global slowdown of tropical-cyclone translation 116 D07109
speed Nature 558 7708 Vidya P J, Ravichandran M, Subeesh M P, Chatterjee S and
Lee S K, Park W, Baringer M O, Gordon A L, Huber B and Liu Y Nuncio M 2020 Global warming hiatus contributed
2015 Pacific origin of the abrupt increase in Indian Ocean weakening of the Mascarene high in the southern Indian
heat content during the warming hiatus Nat. Geosci. 8 445–9 Ocean Sci. Rep. 10 16–19
Li T, Kwon M, Zhao M, Kug J S, Luo J J and Yu W 2010 Global Wanson K L and Tsonis A A 2009 Has the climate recently shifted?
warming shifts Pacific tropical cyclone location Geophys. Geophys. Res. Lett. 36 L06711
Res. Lett. 37 L21804 Webster P J 2005 Changes in tropical cyclone number, duration
Lin I I, Black P, Price J F, Yang C Y, Chen S S, Lien C C, Harr P, Chi and Intensity in a warming environment Science
N H, Wu C C and D’Asaro E A 2013 An ocean coupling 309 1844–6
potential intensity index for tropical cyclones Geophys. Res. Wing A A, Sobel A H and Camargo S J 2007 Relationship
Lett. 40 1878–82 between the potential and actual intensities of tropical
Lin I I, Wu C C, Pun I F and Ko D S 2008 Upper-ocean thermal cyclones on interannual time scales Geophys. Res. Lett.
structure and the Western North Pacific category 5 34 L08810
typhoons. Part I: ocean features and the category 5 Yeh S W, Kug J S, Dewitte B, Kwon M H, Kirtman B P and
typhoons’ intensification Mon. Weather Rev. 136 3288–306 Jin F F 2009 El Nı̃o in a changing climate Nature
Liu Q Y, Feng M, Wang D and Wijffels S 2015 Interannual 461 511–4
variability of the Indonesian throughflow transport: a revisit Zhang C, Li S, Luo F and Huang Z 2019a The global warming
based on 30 year expendable bathythermograph data J. hiatus has faded away: an analysis of 2014–2016 global
Geophys. Res. Ocean 120 8270–82 surface air temperatures Int. J. Climatol. 39 4853–68
Lyon B and Camargo S J 2009 The seasonally-varying influence of Zhang L, Han W, Karnauskas K B, Meehl G A, Hu A,
ENSO on rainfall and tropical cyclone activity in the Rosenbloom N and Shinoda T 2019b Indian Ocean
Philippines Clim. Dyn. 32 125–41 warming trend reduces Pacific warming response to
Malan N, Reason C J C and Loveday B R 2013 Variability in anthropogenic greenhouse gases: an interbasin thermostat
tropical cyclone heat potential over the Southwest Indian mechanism Geophys. Res. Lett. 46 084088
Ocean J. Geophys. Res. Ocean 118 6734–46 Zhang Y, Feng M, Du Y, Phillips H E, Bindoff N L and Mcphaden
Manatsa D, Reason C J C and Mukwada G 2012 On the M J 2018 Strengthened Indonesian throughflow drives
decoupling of the IODZM from southern Africa summer decadal warming in the southern Indian Ocean Geophys.
rainfall variability Int. J. Climatol. 32 727–46 Res. Lett. 45 6167–75
10You can also read