The True Price of a Flight Ticket - Produced for Natuur & Milieu - Natuur & Milieu
←
→
Page content transcription
If your browser does not render page correctly, please read the page content below
The True Price of a Flight Ticket
       Produced for Natuur & Milieu
                  17-Oct-2018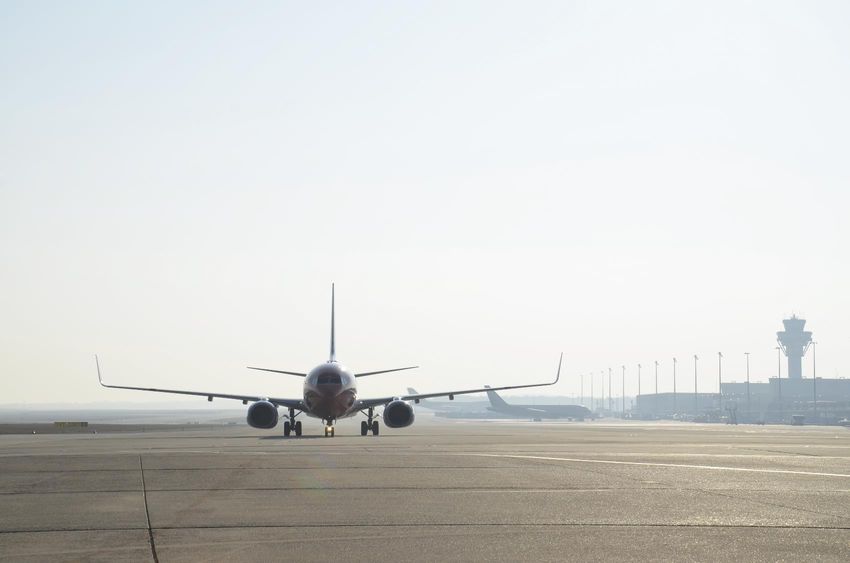
Executive Summary
The Netherlands has a relatively large aviation sector, with Schiphol Airport in particular attracting large
numbers of passengers from all over the world. Flying has become a cheap way to travel resulting in fast
growing passenger volumes. We have calculated that external costs that are not currently in a
passengers purchase of an air ticket from The Netherlands equal on average 63% of the price paid.
•   In this report we have calculated the True Price of a ticket for a one way flight                Price Paid
    from The Netherlands. The True Price is the fare a passenger would pay for a                         Fare                       € 176.0
    flight if all external costs, exempted taxes and subsidies are counted for.                 Ancillary Revenues                   € 19.0
•   The average price paid by a passenger in the Netherlands is €195. This includes        Average Price of a Flight Ticket         € 195.0
                                                                                                Exempted Charges
    an average of €19 of “ancillaries” (extra bags, onboard refreshments etc.).
                                                                                                  VAT Exempton                       € 37.0
    Average airline costs are €186 per passenger, which means these ancillaries
                                                                                                Fuel Tax Exemption                   € 31.7
    are crucial to providing a profit.
                                                                                                        Total                        € 68.6
•   Table 1 shows that the True Price of the average ticket from the Netherlands is                External Costs
    63% higher than the current actual price. Lifting the exemptions of VAT and                   Climate Change                     € 48.5
    fuel tax on flying would make the average ticket 35% more expensive. External                    Air Quality                     € 3.7
    costs caused by climate change, air quality effects and noise would make the                       Noise                         € 1.9
                                                                                                        Total                        € 54.1
    flight 28% more expensive. Note that potentially large external costs like land
                                                                                            True Price of a Flight Ticket           € 317.8
    take, ultra small particulates and subsidies to local airports are not included.
                                                                                          Table 1: Summary of Costs
    The True Price in this report is therefore intended as a conservative
    calculation.                                                                                                           Total
                                                                                                       VAT             € 823,202,108
•   When we multiply exempted taxes and external costs for all passengers
                                                                                           Fuel Tax (incl. added VAT) € 1,252,026,649
    travelling through a Dutch airport, the Dutch aviation sector is responsible for                  Total           € 2,075,228,757
    €5 billion of unaccounted for costs per year. The Dutch treasury misses € 2         Table 2: Estimates of missed revenues to Dutch Treasury
    billion annually due to not received VAT and fuel taxes.

2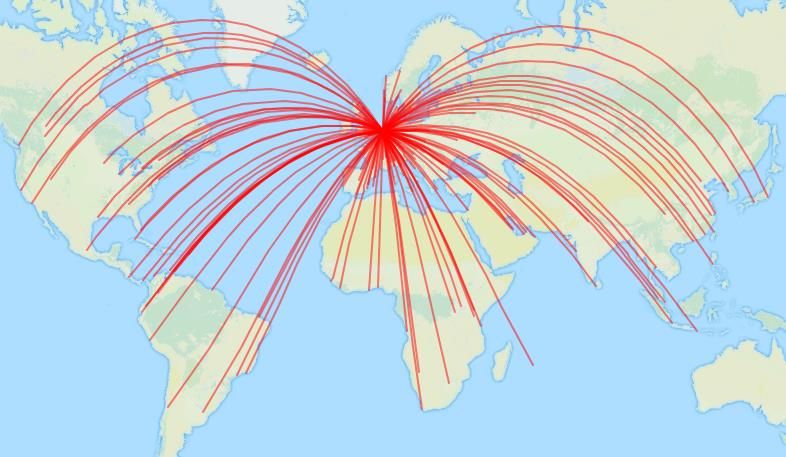
Summary of Unaccounted Costs – average ticket
Climate change, noise and tax exemption are currently the main unaccounted for costs.
                                                                                                                 350
•   Average Ticket Price Paid - €195, which includes an average €176 fare and €19
    ancillaries (extra bags, onboard refreshments etc.)

•   Climate change caused by CO2 – €49, Carbon Dioxide emissions created throughout                              300

    the flight and have an impact on global warming. Climate change costs are 25% of the                                             +63%
    average fare.
                                                                                                                 250                   Fuel Tax
•   Air quality damage caused by NOX, CO, PM, SOx – €4, aircraft emit pollution during
    landing and take off that cause damage to health and nature. Effects are calculated for                                            VAT Exempton

    the “LTO cycle” (the time in which an aircraft is arriving or departing an airport). Air                     200

                                                                                                Yield/Cost (€)
                                                                                                                                       Noise
    quality damage costs are 1.9% of the average fare.
                                                                                                                                       Air Quality
•   Noise – €2, The disturbance generated through the sound of aircraft engines or
                                                                                                                 150
    aircraft during the LTO cycle has a negative impact on physical and mental health,                                                 Climate Change

    stress, productivity and perception of quality of live. Air quality damage costs are 1.0%
                                                                                                                                       Ticket Price +
    of the average fare.                                                                                         100                   Ancillaries

•   Taxes exempted: VAT and fuel tax – €69, Aviation is currently exempt from VAT and
    fuel tax, and we have calculated the effect that putting these taxes on fares would
                                                                                                                 50
    have. (Note: This is not the same as the amount potentially collected by the Dutch
    treasury).

•   Some aspects not included in these calculations are: the cost of land take, emissions                         0

    from surface access/infrastructure, external costs in the manufacture of aircraft,
                                                                                                         Figure 1. True Price of an average one-way flight
    production of jet fuel, external costs of aviation-dependent industries (e.g. tourism),
    but also any economic benefits of aviation.                                                              from the Netherlands.

3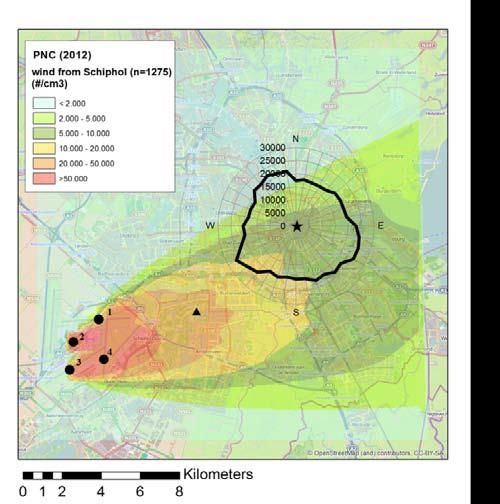
Summary of Unaccounted Costs – example tickets
The “long-haul” typical flight has the highest unaccounted for cost. In our example route (Amsterdam –
Bangkok) this was 69% of the current ticket price.

                            +69%                                            +37%                  +49%

         “Long haul”                                      “Regional”                    “Low cost”
            KLM                                        KLM Cityhopper                    Transavia
      Boeing 777-300ER                                   Embraer 190                  Boeing 737-800
     Amsterdam - Bangkok                              Amsterdam - London           Eindhoven to Malaga
    Figure 2. True Prices of three typical one-way flights from the Netherlands.

4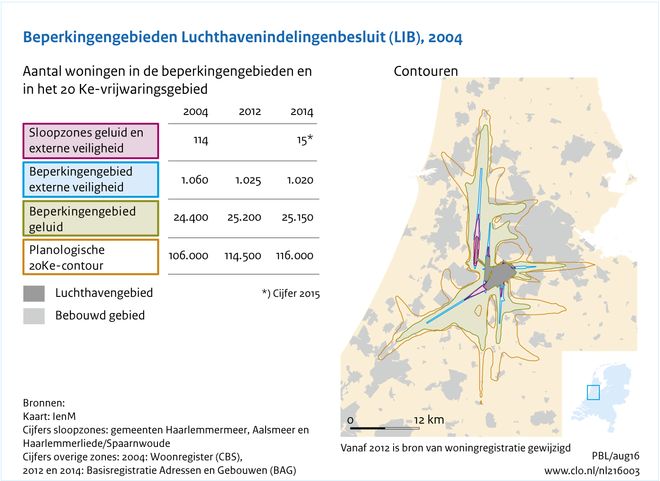
Background

    5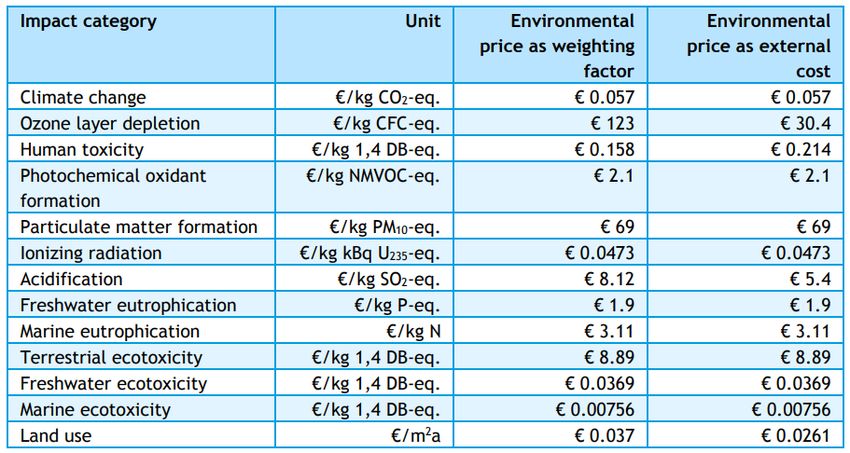
Introduction
Natuur & Milieu has commissioned Aviation Economics to undertake this report into the “true price” of
a flight ticket.

•   Airlines in Europe are primarily private-sector companies run to generate profits for shareholders, and are not state-sponsored
    entities for the wellbeing of the populace. This means that they are focussed on minimising financial cost and not typically
    accounting for any wider social costs that their operations may have.

•   The thesis of this report is that there is a “true price” of a flight ticket, taking into account all the significant external effects that air
    travel has but is not currently accounting for.

•   Many of these fall into the category of “environmental” or “health” costs (e.g. climate change, air quality, noise), but there are also
    tax exemptions, airport-airline discount agreements and subsidisations to consider.

•   We have used all the publicly available resources on these effects to as best as possible understand and monetise the true cost of a
    flight ticket.

Who We Are

•   Natuur & Milieu is a Dutch environmental organization committed to creating a healthy natural environment.

•   Aviation Economics is a specialist aviation consultancy based in the United Kingdom, providing advisory services to airports, airlines
    investors, governments and other organisations.

6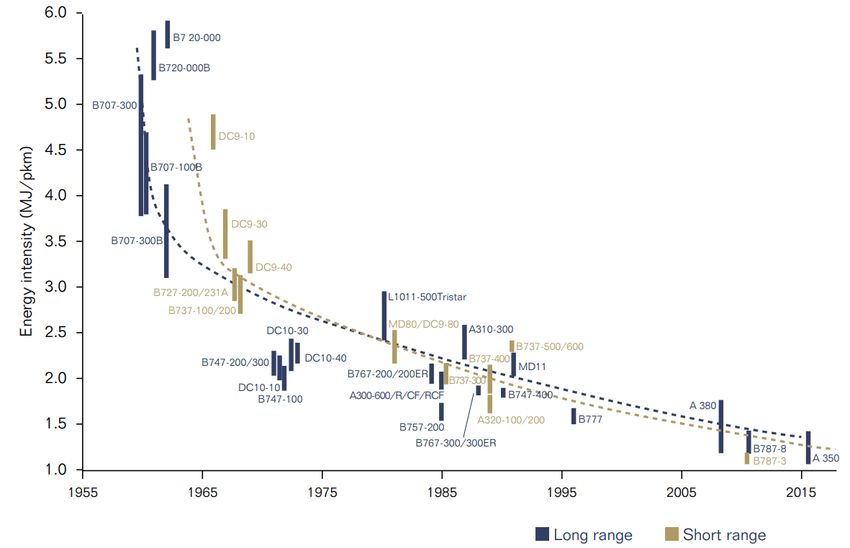
Air Transport in The Netherlands
The Netherlands is a key player in the world of aviation - with enough seats available for each citizen to
take 2.7 round trips in 2018

•     Much of this is reliant on the connecting power of the KLM network, with the total Air France-KLM
      group controlling 56% of “seats” (tickets available for sale to the public) from The Netherlands.

•     Amsterdam is by far the largest airport in the country, accounting for 89% of total seats from The
      Netherlands, and all of the country’s long haul flights. However, regional airports’ roles are
      increasing with the combined effect of capacity restrictions at Amsterdam, and the business model
      of low cost airlines searching for cheaper airports to operate from.

Figure 3 Seats from the Netherlands by Airport and Route Type                Figure 4 Seats from the Netherlands by airline

Source: RDCApex.com

7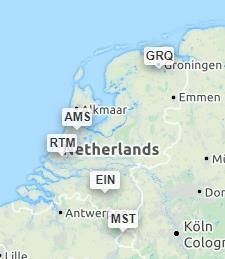
Importance/Burden of Amsterdam Hub
KLM operates a “hub-and-spoke” model at Amsterdam – which is an economic catalyst for the airline,
but at the cost of routing millions of air passengers through the country

•     A “hub-and-spoke” model uses the “hub” airport as a central point through which to transfer passengers on to other destinations
      (e.g. New York–Amsterdam–Istanbul). The larger a hub grows, the greater the number of city pairs that can be connected over it.

•     The existence of these transfer passengers effectively decreases the number of direct (or “point to point”) passengers required for
      a route to be financially viable, and therefore generally results in a much larger number of cities served from the hub airport.

•     While the exact external benefit is a subject for debate and not part of this study, Amsterdam is undeniably connected with more
      cities across the globe as a result of KLM’s presence at Schiphol Airport and use of the “hub and spoke” system.

•     The clear downside of this is that some external effects of these passengers’ air travel are burdened by the Netherlands as a result
      (e.g. through noise or emissions), even though the passengers may never leave the airport building.
                                             Figure 5. KLM network from Amsterdam in 2018

Sources: KLM, RDCApex.com

8
Aviation’s Environmental Performance
Air travel is a contributor to climate change, local air quality and noise problems around airports
• In the Netherlands the aviation sector is responsible for 12% of climate change emissions, and up to 10% for other pollutants
emitted in The Netherlands like NOx, SOx and particles. These percentages may increase over time as, while other industries are
able to electrify and/or use sustainable fuels, these technologies are unlikely to be viable for aviation until much later.
• Since the jet-age of the 1950s and 60s, aircraft technology has been improving consistently and significantly. While this has been
driven primarily by a desire to lower fuel burn (and therefore operating cost), as fuel burn is the main factor in the production of
most emissions, aviation has (perhaps unintentionally) become more environmentally friendly over time on a per passenger
basis. However this does also correspond with strong volume growth. Efficency has increased by 0,5 – 1,5 % per year due to
aircraft improvements and proces improvements. While growth in total flights is somewhat restricted (by capacity issues at major
airports) the number of passengers have increased fast as the average number of passengers per flight has increased over this
time. This has resulted in a higher fuel efficiency per passenger. The risk is that this process improvement has happened
inorganically and could be undone if airport capacity restrictions are relieved.
Source: Independent Transport Commission, European Environment Agency, International Energy Agency
9Aviation Efficiency Gain
Air travel has become more efficient due to larger airplanes and improved technology. Below graph
demonstrates the advances in aircraft technology and process efficiency (e.g. more passengers per
flight) over time.
Figure 6. Aircraft Efficiency Gains since 1955
Source: Independent Transport Commission, European Environment Agency, International Energy Agency
10Approach 11
Approach of True Price Analysis
Air Travel is a wide and varied market, with costs differing significantly by route, airline, aircraft type and
many other factors. As such we have split our analysis to calculate the true price of three example route
types and for an average flight from The Netherlands.

In this report we calculate the True Price of a one way flight from the Netherlands. The costs are split in three categories:
•     The actual fare of a one way ticket and costs covered by the airline.
•     Exempted taxes and received subsidies.
•     External costs:
       o     Climate change: costs of emissions of the total one way flight (so not only emissions in Dutch air space).
       o     Air quality and noise: The emission of NOx and noise cause damage to health and nature depending on the local situation.
             We have only calculated these costs caused in The Netherlands and in the arriving country.
       o     Not all external costs have been included as data is missing.

We have also determined the true price of the average one way flight from the Netherlands and for three typical flights.

-     Actual 2018 ticket prices: determined based on the RDC Apex database on fares and airline costs (fuel, maintenance, aircraft
      ownership etc.).

-     Climate costs and air quality costs: determined based on a “bottom-up” approach. Costs are determined for all departing flights
      from Dutch airports and divided by the total passengers that travel from a Dutch airport to reach a per-ticket figure.

-     Exempted taxes: determined based on actual ticket prices (VAT) and average fuel used (fuel tax).

Source: RDCApex.com

12
Stages of Flight
The diagram below demonstrates the key stages of flight and which environmental/health costs are
analysis
Cruise
Airport Airport
• Climate • Climate • Climate • Climate • Climate
Change Change Change Change Change
• Land Take • Land Take • Land Take • Land Take
• Air Quality • Air Quality
• Noise • Noise
Figure 7. Aircraft Flight Cycle
13Flights, passengers and travel classes
In this report we have made some assumptions about the market for air travel that are intended to
simplify the complex nature of airline operations and ticketing
Flights
• For The Netherlands In 2018 there are scheduled to be 534,906 passenger flight movements and 91,147,560 saleable seats, evenly
split between arriving and departing flights.
Passengers
• We have estimated that in 2018 there will be 39,516,539 departing passengers from The Netherlands. This is based on the above
capacity and assuming the same load factor (passengers/seats) achieved in 2017.
Transfer passengers
• As Schiphol is a major European hub, 37.8% of all passengers travelling via Schiphol are transfers. These passengers are effectively
counted double when considering external costs, as they both arrive and depart from the airport in a single one-way trip. For the
purposes of this report, a transfer passenger is treated as equivalent to two “point-to-point” passengers. This way the external
costs of the transfer passenger’s trip are fully accounted for.
Class of Travel
• Airlines rely on market segmentation as a key tool for maximising revenue. Mostly this occurs by offering different “classes” of
travel – namely economy, premium economy, business and first class. This occurs more on long-haul flights and with traditional
“full service” carriers (such as KLM). A short-haul low-cost flight, for example, will almost always offer just economy seats.
• Although the fares paid by these passengers may be vastly different, in this report we treat all passengers as equal. So that, the
external costs of a first class passenger are the same as those as a discounted economy passenger. However it is worth noting that
as premium seats require more space on the aircraft, they are a less efficient means of transporting passengers and therefore may
have greater external costs.
14True Price of three routes
We have used the below three routes to calculate true prices. These are routes we have defined as
“typical” for the categories of Long-haul, regional and low cost.
• Long-haul – Amsterdam (AMS) – Bangkok (BKK), 9,217km - Operated by KLM with a 425-seat Boeing 777-300ER
• Regional – Amsterdam (AMS) – London City (LCY), 336km - Operated by KLM Cityhopper with a 100-seat Embraer 190
• Low-cost – Eindhoven (EIN) – Malaga (AGP), 1,819km - Operated by Transavia with a 189-seat Boeing 737-800
o Note that the low cost route differs from the regional route primarily in its business model – fitting a large number of people
into a relatively efficient aircraft. Whereas a regional route typically operates with smaller aircraft and often with a higher
proportion of empty seats.
Source: RDCApex.com Figure 8. Route Map showing example routes
15Typical Operating Costs
16Airline Costs Accounted For
Airline costs are not necessarily directly attributed to the price a consumer pays for a ticket, however
breakeven is important to the long-term success of the route.
• All values are one-way and calculated using the RDCApex airline Figure 9. Airline Costs across the three route types
performance software. This uses information from a variety of sources
including airline financial reporting to calculate operating costs.
Operating costs are based on a 2018 operation.
• The weighting used to calculate the average flight are based on the
number of tickets within each category operated from The
Netherlands in 2018. These are:
o Long-haul – 29%
o Regional – 39%
o Low Cost – 32%
• Aircraft Ownership (Weighted Average Cost = €23.29) – This covers
the cost of owning or leasing the aircraft asset, plus any associated
insurance costs. For long-haul flights, larger aircraft must be operated,
and the cost is split over fewer flights. Hence the cost for long-haul
flights is greater than for short-haul.
• Maintenance (€15.86) – The cost required to keep the aircraft
airworthy with both regular and unplanned services. Once again larger
aircraft are more costly to maintain.
Source: RDCApex.com – Costs are calculated specific to the airlines and aircraft operating the route
17Costs Accounted for (continued)
• Crew (€20.91) – This covers both cockpit and cabin personnel. their charges to encourage low cost airlines to operate. The
European regulations stipulate that 1 cabin crew must be result of this can be seen in the relatively small cost of airport
provided for every 50 passengers, and airlines do not generally charges for the “low cost” flight in the chart on the previous
provide more than they are required to. Two cockpit crew are page. By contrast the “regional” flight takes a very high
required to fly an aircraft, and only on long-haul flights is a percentage cost of airport charges, as it operates between
relief crew required to allow the first to rest – where this will busy city airports and due to the short distance accrues fewer
generally be split among a greater number of passengers due costs in other segments.
to aircraft size. Therefore the only significant differentiator
• Navigation Fees (€10.12) – Alongside charges for operating at
between the three route types here is the length of the flight.
airports, airlines must pay to fly through the airspace of
• Fuel (€59.32) – While fuel burn varies somewhat depending whichever countries they operate over. While this is generally
on aircraft type (see CO2 analysis), generally larger aircraft connected to flight distance, note that the airspace over the
burn more fuel but equally carry more passengers to split that Atlantic Ocean is much cheaper than, for example, Germany.
cost between. Therefore by far the largest driver of fuel burn
• Handling (€5.40) – The fees payable to a service provider for
cost per passenger is the length of the flight, and this is
aircraft pushback, cleaning, passenger processing etc.
reflected in our results. (global price at time of writing)
• Catering (€2.50) – Fees payed to a catering provider, generally
• Airport Charges (€31.36) – Airports historically have
low on low cost or short distance flights due to absence of
generated most of their revenue from charging airlines for
complimentary meals.
operating from their site, generally in terms of landing fees
(i.e. use of the runway) and passenger service charges. Smaller • Indirect/Other (€16.98) – This covers overheads and support
airports now lean on non-aeronautical forms of revenue, such costs of running the airline, that may not be directly applicable
as duty free concessions and car parking, to generate revenue. to the route but are still relevant in terms of profitability.
This business model is dependant on high volumes of
passenger throughput, and therefore these airports lower
Source: RDCApex.com – Costs are calculated specific to the airlines and aircraft operating the route
18Airline Ticket Prices and Yields
Using a comprehensive database of airline fares on routes from Netherlands to across the globe, we
have calculated that the average economy fare is around €176 one-way
• Airlines do not make all their revenue through ticket sales
• Definitions:
alone, and we have calculated an average ancillary revenue
(onboard sales, extra luggage, etc.) of around €19 (sourced o Fare = The ticket price charged by an airline for a flight
from airline financial reports). seat (excluding baggage if this is separated)
• The weighted average yield of €195 (€176 fare + €19 o Yield = The revenue per passenger achieved by the
ancillaries), is slightly higher than our estimated weighted airline. The main differential from the fare is typically
average cost of €186. This implies a profit of around €9 per ancillaries such as extra baggage and onboard food
passenger, or a margin of 5.2%. and drink sales.
• Understandably the fares vary significantly by route type.
Figure 10. Estimation of Yield and Cost Implications for Profit by Route
Long-haul flights cover a greater distance (and flight time) Type
therefore these command higher prices. Low Cost flights by
their nature offer lower prices, even if the average sector
length is longer than for the regionals.
• In terms of profit margins, regional flights struggle to make a
decent profit as relatively high costs are matched with strong
competition (from surface travel and low cost airlines).
However these flights typically provide transfer feed to long-
haul flights so justify themselves in the wider context.
• The major low cost airlines generally are successful and
profitable, and this is reflected here.
Source: RDCApex.com
19Seasonality
Air travel is a highly seasonal business, and this is no more prevalent than in the costs associated with
flight tickets, where variances in fares between high and low seasons can be as much as 300%
Figure 11. Fares across 2017 for regional route (KLM AMS-LCY)
• On this page we have split out the fares achieved by month on
our three example routes. While the regional and long-haul
examples we have used are not overly seasonal, the variances
on the low-cost (Eindhoven to Malaga) route are substantial.
• In December 2017 Transavia achieved an average fare of €35 –
when just 2 months earlier it had been charging €140 (+300%).
• This means that, while low fares may not be seen to cover the
costs of air travel, this does tend to average out over the year.
Figure 12. Fares across 2017 for low-cost route (Transavia EIN-AGP) Figure 13. Fares across 2017 for long-haul route (KLM AMS-BKK)
RDCApex.com
20Environmental Costs
21Summary of All Environmental Costs
The environmental costs we consider in this report are climate change and air quality.
• Emissions are calculated based on burned fuel and official emission conversion factors…. Emissions are then valued with
environmental prices for The Netherlands derived from CE Delft Handboek Milieuprijzen. Environmental prices express the damage
in caused to society in euro per kg emitted.
• Climate change:
o For climate change costs we assume the pollutants are equally damaging regardless of where they are emitted and therefore
calculate for the whole flight. We also assume a radiative forcing multiplier of 2.
• Air quality
o The cost factors presented in the CE Delft report are mostly concerned with damage to the urban environment, where only a
fraction of a flight occurs. To account for this we have analysed the time aircraft typically spend in lower airspace (Emission Cost Factors
Our Emissions Cost Factors are all derived from those provided in the CE Delft “Environmental Prices
Handbook 2017” – with the key figures summarised in the table below
Table 3: Environmental prices for the European Union
(Source: CE Delft Environmental Prices Handbook 2017)
23Climate Change - Calculations
Our approach to calculating CO2 involves a bottom-up methodology, using data on all flights to/from the
Netherlands in 2018 and established cost factors
• We have produced an estimate of Netherlands passenger air transport fuel burn for 2018. While information on fuel uplift from Dutch
airports is available, this includes other forms of aviation such as freight and private aviation.
• Data on all scheduled flights to/from The Netherlands in 2018 is sourced from RDCApex.com/OAG.
• This has then been combined with a comprehensive database
of aircraft fuel burn rates (multiple sources - primarily aircraft
manufacturers), with assumptions made on the LTO
(landing/take-off) cycle based on flight distance.
Total Fuelburn (tonnes) 3,135,580 Aviation Economics
• CO2 factor: conversion from ton kerosene to kg CO2, used by CO2 Emissions Factor 3.157 ICAO
CE Delft and across the aviation industry. Total CO2 emitted (tonnes) 9,899,025
Cost of CO2e/tonne (€) € 94.00 CE Delft
• Applying a CO2 per tonne of fuel burned factor, a multiplier Adjustment for inflation 1.03 Statbureau.org
for radiative forcing and the average climate change cost of CO2e Cost € 958,423,606
CO2 from CE Delft (adjusted for inflation), we have calculated Radiative Forcing Multiplier 2 CE Delft
Total CO2e Effect € 1,916,847,211
that €1.9b is the estimated total cost of CO2 produced by
NL Annual Passengers 39,516,539 Statistics Netherlands
scheduled passenger flights leaving The Netherlands.
CO2 Cost per Passenger € 48.51
• Cost factors sourced from CE Delft : €94/ tonCO2. Table 4: Climate Change Cost Calculations
• Dividing this by the total number of passengers estimated to
fly from The Netherlands in 2018 produces an average cost
per one-way passenger of €49 for the average one-way flight
from a Dutch airport in 2018.
Source: RDCApex.com and CE Delft
24Climate Change Costs - Results
We have calculated that the average cost of Climate Change for a passenger departing from (or arriving
to) The Netherlands at €49 per passenger
• Costs vary significantly by route type – it is unsurprising that long-haul flights generate a much greater amount of CO2, as the
pollutant is strongly correlated with fuel burn.
• Meanwhile, the costs associated for the shorter flights are relatively lower. Given the sector lengths, the low cost flight burns a
relatively low amount of CO2e per passenger – this is because the low cost airline strategy of filling aircraft with more passengers
is a more efficient strategy in terms of fuel burn, and therefore also CO2e burn.
Figure 14. Climate Change Costs for three route types
Source: RDCApex.com and CE Delft
25EU Emissions Trading Scheme
The EU’s Emissions Trading Scheme currently covers all flights within the European Economic Area (EEA)
and requires these to monitor, report and verify carbon emissions
• The current situation with the Emissions Trading Scheme in aviation is complex and the availability of information to the public on
trading and auctions is limited.
• In essence, a large number of emissions “allowances” have been allocated to existing airlines based upon their operations in the
previous year (a number are also kept available for new entrants, so as not to form a significant barrier to market entry).
Additional allowances are available at auction and operators are also free to trade their allowances – providing an incentive for
those most able to reduce their emissions to do so and trade excess allowances to an operator who may not be able to decrease
emissions so easily.
• At present, the cost of these carbon emission allowances is relatively low. This is because the process is still in its relative infancy
and the EU does not intend to cause any economic shocks with its introduction. At present, estimates suggest carbon trading could
be costing around €0.25/passenger for short-haul flights and €1.13/passenger for long-haul flights.
• Over time, the number of allowances available will gradually decrease. This (alongside demand growth) increases the value of the
remaining allowances, and therefore there is increased incentive for operators to decrease emissions. This is one of the key ways
in which the aviation industry is being challenged to meet carbon emissions targets.
• Due to the complexities, lack of transparency and present low cost described above, we have elected not to attempt to put a fixed
figure on the cost of emissions trading on the average airline ticket from The Netherlands.
26Air Quality- overview
NOx has the largest effect on air quality costs. The costs of (ultra small) particles is yet unknown.
• Aviation influences air quality around airports with emissions including NOx, SOx, CO, NMVOC, particulates and ultra
small particulates. The time that an aircraft spends in “lower airspace” (i.e.Air Quality - NOx Our approach to calculating air quality involves a bottom-up methodology, using data on all flights to/from the Netherlands in 2018. Total NOx emissions (based on all landings and take-offs on Dutch airports in 2018): • Data on all scheduled flights to/from The Netherlands in 2018 is sourced from RDCApex.com/OAG. • We have used Flight Radar data to average the time that aircraft spend in “lower airspace” (i.e.
Air Quality – ultra small particles
We have not included ultra small particles (PM2.5, PM10 etc.) as the research is insufficient at present
to draw monetizable conclusions

•    A study by TNO concluded that Schiphol is a source of ultra small particles in areas of Amsterdam and Amstelveen (TNO
     2014 Ultra particulate matter around Schiphol). The health damage caused remains unknown and is currently
     researched by RIVM.

                                       Figure 15. TNO 2014 Ultra small particles around Schiphol

29
Air quality costs per flight
We have calculated that the average cost of air quality for a passenger departing from (or arriving to)
The Netherlands at €3.69 per passenger
• Costs vary significantly a little by route type – the larger aircraft (i.e. long-haul) generally emit more pollutants, and although there
are more passengers on board to split this between – it is not enough to bring down to the levels of smaller aircraft.
• Regional and low cost flights on smaller aircraft perform noticeably better.
• There are a number of other emissions which have not been included here, such as CO, SO2, NMVOC and particulates. The reason
these are not included in our calculations is due to comparatively small impact (in the case of CO, SO2 and NMVOC) and due to a
lack of data availability on emissions levels from aircraft.
Figure 16. Air Quality costs for three route types
Source: Flightradar24.com and CE Delft
30Noise
• Individual aircraft have become more quiet over the years.
However due to the high growth in the number of flights, people
are generally exposed on a more continuous basis than in the
past.
• People that are continuously exposed to noise can generate
mental and physical problems, become less content with quality
of life and occasionally use more drugs for sleeping and relaxation
(GGD 2014).
• Methodology is based on 2010 data of the Planbureau voor de
Leefomgeving on the number of people effected by noise around
Schiphol and regional airports. Source (CE Delft, Externe en
Infrastructuur kosten verkeer 2014). The total number of persons
effected will be higher today.
• CE Delft Environmental Prices Handbook 2017 puts the cost of
noise for populations living in various noise contours (50db or
greater) for aviation. By applying this to the number of residents
in the contours we have arrived at an annual cost of €76 billion. Figure 17. Schiphol Noise Contours
31Noise - calculation
Number of houses within contours around airports:
• Luchthavenindelingbesluit Schiphol (LIB, 2017) determines the areas with development limitations around
Schiphol Airport due to safety and noise.
• Planbureau voor de Leefomgeving provides data on the number of households in contours around Schiphol
and regional airports. We have adjusted population figures with 10% due to increase of houses within the
Lib 4 and Lib 5 nopise areas.
Cost of noise of Dutch airports
• CE Delft Environmental Prices Handbook 2017 report puts the cost of noise for populations living in various
noise contours (50db or greater) for aviation.
• By applying this to the number of residents in the contours around Dutch airports we have arrived at an
annual cost of €76 million.
• Dividing this among the 39.5million passengers gives a figure of €1.93 per passenger. Note that this is only
per departing passenger so effectively counts as the cost of both the departing and arriving flight. But this
also does not consider the noise impact at the opposite end of the route.
dB Range Cost/dB/person Population Total Cost Avg. Cost/Person
50-55 € 52 222,484 € 25,340,401 € 114
55-60 € 103 60,894 € 37,724,708 € 620 Total Cost € 76,126,049
60-65 € 103 8,665 € 9,827,529 € 1,134 Passengers 39,516,539
65+ € 196 999 € 3,233,412 € 3,237 Cost/Passenger € 1.93
Total 293,041 € 76,126,049 € 260
Table 7: Noise Cost Calculations
32Noise Costs - Results
We have calculated costs of €1.93 per passenger in terms of noise from flights arriving at or departing
from Amsterdam Schiphol Airport
• We have estimated the variation in noise costs for the various aircraft types by splitting the cost by the number of aircraft
movements (take-offs and landings), and then by the number of passengers on board.
• Clearly this favours operating larger aircraft less frequently, and therefore the long-haul flight. However the trade-off between
operating more, quieter aircraft or fewer but louder aircraft is not a topic that is very well understood (and indeed may simply be a
matter of subjectivity or situation dependent).
33Landtake
Landtake of the airport is not only determined by the airpot itself but also by the areas around the
airport that cannot or less be used for housing, businesses, recreation, nature etc.
• In the Luchthavenindelingsbesluit Schiphol (LIB) the areas around the
airport have been divided in LIB 1 t/m 5 based on noise and safety
exposure.
• LIB 1 & 2 - Demolition zone due to safety and/or noise (>71dB(A) Lden)
• LIB 3 - No additional new houses possible
• LIB 4 - New houses in principle NOT allowed (responsibility of local
authotities) (58db(A) Lden)
• LIB 5 - Growth allowed but limited (48 dB(A) Lden)
• In the RIVM ‘Monitoring Luchtvaartgeluid 2009’, 10,2% of the surfaces
of the provinces of Zuid-Holland, Noord-Holland and Utrecht are within
58 and 48 – 58 Lden noise contour. The cost due to restrictions on
development in the area is not possible to calculated in this report and
requires addiotional research.
Figure 18. Schiphol Land Take Contours
34Other Unaccounted Costs
35VAT Exemptions
Aviation is not subject VAT (Value Added Tax) in most countries, including the Netherlands, as a means
to protect airlines and encourage international trade
• Some countries charge VAT on domestic tickets, however due to its size the Netherlands does not currently have domestic flights.
Others use alternative forms of taxation, such as the UK’s Air Passenger Duty (APD). These can only apply to departing passengers.
• We are assuming Netherlands VAT (21%) on
Average Fare € 176.04 RDCApex.com
both departing flights only, as a proxy for NL VAT Rate 21% Government of the Netherlands
calculating that which would be applicable to Applicable VAT per passenger € 36.97
NL Annual Passengers 39,516,539 Statistics Netherlands
The Netherlands. However in practice with Total Applicable VAT € 1,460,869,577
internet bookings and connecting flights, the Table 8: VAT Exemption Calculations
situation is far more complex.
• We have taken the pure fare (€176), rather
than yield (as this includes ancillary purchases,
which may or may not be taxed depending on
how and where they are purchased).
• Note that this is not the same as the amount
that could be claimed by the Dutch treasury.
This is explained further on the next page.
Source: RDCApex.com and CE Delft Figure 19. VAT Exemptions for three route types
36VAT Claimable by the Dutch Treasury
The figures produced on the previous page are representative of the total amount of VAT a flight could
be subject to, not necessarily the amount that could be claimed by the Dutch Treasury.
• This amount is more complicated to calculate, since at present suitable legislation is not in place to outline what a country can
claim on a flight ticket, which typically covers travel between (and through the airspace of) multiple countries.
• The nearest precedent is that which applies to rail and coach travel in the EU – that VAT is claimed on the percentage of the total
distance that is travelled in each country. However, this is wholly impractical for air travel due to the number of countries
potentially involved (our Amsterdam-Bangkok route for example, travels through the airspace of 15 countries) and the daily
variation of routing that occurs for reasons such as weather and congestion.
• Therefore for VAT to be claimed on flight tickets a more simple approach would be required, and has been suggested on previous
occasions. This would be on a simple “point-of-departure” approach. For example on a flight from Amsterdam to London, the
Dutch government would be able to claim all the VAT. On the reverse flight the VAT would be claimed by the UK.
• What would still be left to decide is how return flights are handled, who has jurisdiction over a connecting flight, transiting flight
(e.g. a refuelling stop where some passengers do not deplane) or a multiple-city itinerary.
• The calculations on the previous page assumed that each individual sector is treated as its own ticket, and therefore all departing
flights from The Netherlands are applicable for VAT by The Netherlands only.
• A more likely approach would be based upon the first
departure point of a (one-way) trip. As Schiphol handles a Total
large volume of transfer passengers, this would disadvantage VAT € 823,202,108
Fuel Tax (incl. added VAT) € 1,252,026,649
The Netherlands significantly and lead to around 56% of the
Total € 2,075,228,757
revenues calculated on the previous page.
Table 9: Estimates of missed revenues to Dutch Treasury
37Fuel Tax Exemptions
As with flight tickets, aviation fuel is currently not taxed, although it is not forbidden by the 1944
Chicago Convention it is not a common practice across the world
Total Fuelburn (tonnes) 3,135,580 Aviation Economics
• We have applied the minimum fuel tax rate of 33 Fuel Price ($/USG) 2.1 IATA
cent/ltr on kerosene as determined by the European Conversion Rate (USG/tonne) 264.17
Union. Conversion Rate (EUR/USD) 0.86 XE.com
Total Cost of Fuel (€) € 1,495,956,908
• We have also applied the Netherlands VAT rate Tax Rate (€/ltr) € 0.33 Government of the Netherlands
(21%) on top of this tax. Conversion Rate (USG/ltr) 3.79
VAT Rate 21% Government of the Netherlands
• This gives a figure of €1.25billion, or €32 per Total Applicable Fuel Tax (€) € 1,252,026,649
passenger. NL Passenegrs 39,516,539 Statistics Netherlands
Fuel Tax per Passenger (€) € 31.68
Table 10: Fuel Tax Exemption Calculations
Source: RDCApex.com and CE Delft Figure 20. Fuel Tax Exemptions for three route types
38Airport Incentives and Local Subsidies
In this report we are also looking at the assistance that airlines obtain from their relationships with the
airports that they operate from, however data availability is very poor
• Traditionally airlines pay airports to operate flights in the form of landing charges and passenger charges, and this is how airports
turn a profit. However with the increase in low cost airlines operating from smaller airports across Europe, the relationships have
begun to change.
• A smaller airport cannot make money handling occasional regional flights, and instead will seek to generate volume in whatever
ways it can. The volume can then be profited from by charging for car parking, food, beverages and other concessions while the
passenger uses the airport. Therefore it is in the airports interest to offer these airlines a discount (and sometimes a “marketing
incentive” on top) in order to benefit from these airlines’ traffic generating potential in the long-term.
• States with airport ownerships sometimes also participate in this, as they can subsidise the airport’s losses and seek benefits
beyond simply making a long-term profit (in terms of connectivity and wider economic prosperity). However if this happens in the
Netherlands, the information does not appear to be in the public domain.
• In practice this means that passengers are often not paying for the cost of using the airport in their flight ticket.
• None of the six airports (with scheduled passenger services) in the Netherlands have formal incentive agreements to reduce
airport charges for airlines. While private commercial agreements may exist between particular airports and airlines, these are
likely to affect only a small minority of flights.
39Results and Findings
40“Long-haul” Route
The long-haul example route (KLM Amsterdam to Bangkok) has the highest unaccounted for cost, at 69%
of the current ticket price
• The long distance means the route has the highest
amount of fuel burn as a proportion of cost,
meaning unaccounted climate change costs are
very high – at 32%.
+69%
• VAT exemption accounts for 20%, and Fuel tax a
further 15%.
Figure 21. True Price of Long-Haul Ticket
41“Regional” Route
The Regional route (KLM Amsterdam to London) shows the least amount of unaccounted external cost
(37%) primarily due to the shorter sector length
• Noise and air qualityare important factors for this
route as the short sector length means that the
flight spends more time in the LTO (Landing/Take-
Off) Phase, and effectively performs more landings +37%
and take-offs each day. However these still account
for just 3% and 2% respectively,
• Climate change is a large contributor once again,
albeit at a lower proportion of the ticket price here
of 10%.
Figure 22. True Price of Regional Ticket
42“Low Cost” Route
The Low Cost Route (Transavia Eindhoven to Malaga) has unaccounted costs equal to 49% of the current
ticket price
• Climate Change accounts for 18%, while VAT
exemptions account for 17%.
• The flight is relatively efficient due to the high
+49%
number of passengers to spread the costs among.
This leads to low costs in the noise and air quality
categories.
Figure 23. True Price of Low Cost Ticket
43Weighted Average
The average or typical route from the Netherlands has unaccounted costs equal to 63% of the current
ticket price
350
• Climate Change costs account for 25% of the
current ticket price.
300
• VAT and Fuel Tax exemptions account for 19%
+63%
and 13% respectively.
• The remaining costs of noise and air quality 250 Fuel Tax
equate to 1% and 2% of the ticket price
VAT Exempton
respectively.
200
Yield/Cost (€)
Noise
Air Quality
150
Climate Change
Ticket Price +
100 Ancillaries
50
0
Figure 24. True Price of Weighted AverageTicket
44Conclusions
45Conclusions
In this report we have attempted to quantify the True Price of a flight ticket. We have calculated the
external costs not counted for in a passengers purchase of an air ticket, taxes exempted and subsidies
provided. Our results shows that on average these costs are equal to 63% of the current ticket price from
the Netherlands
• Our other primary conclusions are:
o Climate change (CO2) is a factor, equal to 25% of the current ticket price. However, this number varies significantly by the
type of flight undertaken, with our regional and long-haul example flights showing 10% and 32% of the ticket price
respectively.
o Emissions effecting local air quality are a much lower contributor to the unaccounted costs. On the weighted average flight
from the Netherlands these are equal to 2% of the current ticket price. The main reason for this is the limited time that
aircraft spend at low altitude over urban areas relative to other phases of the flight.
o The costs of aircraft noise equate to 1% of the current ticket price.
o Unaccounted costs through VAT exemptions potentially equal 19% of the current ticket price. Fuel tax set at the EU
minimum of 33ct/ltr would raise the ticket price by 16% (after VAT).
Total Cost Cost/Passenger
Climate Change € 1,916,847,211 € 48.51
Air Quality € 291,496,064 € 3.69
Noise € 76,126,049 € 1.93
VAT Exempton € 1,460,869,577 € 36.97
Fuel Tax Exemption € 1,252,026,649 € 31.68
Total € 4,997,365,550 € 126.46
Table 11: Total and Per Passenger Cost Breakdown
46Key Sources • CE Delft – “Environmental Prices Handbook 2017” • CE Delft – “Estimated revenues of VAT and fuel tax on aviation” • CE Delft – “External Costs of Transport in Europe” • CE Delft – “Externe en infrastructuur – kosten van verkeet” (for Land Take – Dutch only) • Flightradar24.com • ICAO Aircraft Emissions Databank • Independent Transport Commission – “The Sustainability of UK Aviation” • RDCApex.com 47
Contact Information

Nottingham                      Dan Irvine
The Hub                         t: +44 (0) 115 852 3043
40 Friar Lane                   e: dan.irvine@aviationeconomics.com
Nottingham
NG1 6DQ
t: +44 (0) 115 852 3040
e: info@aviationeconomics.com   Peter Hind
                                m: +44 (0) 7740 477 882
                                t: +44 (0) 115 852 3050
London                          e: peter.hind@aviationeconomics.com
37-41 Gower Street
London
WC1E 6HH
United Kingdom
                                Joanna Hunt
                                m: +44 (0) 7764 318 428
t: +44 (0) 20 7299 7727
                                t: +44 (0) 115 852 3040
e: info@Aviationeconomics.com
                                e: joanna.hunt@aviationeconomics.com

48
You can also read