THE VALUE OF SOLAR IN THE REPUBLIC OF IRELAND - A report to Irish Solar Energy Association - Irish Solar Energy ...
←
→
Page content transcription
If your browser does not render page correctly, please read the page content below
THE VALUE OF SOLAR IN THE
REPUBLIC OF IRELAND
A report to Irish Solar Energy Association
FEBRUARY 2021

AFRY is an international
engineering, design and
advisory company.

We support our clients to
progress in sustainability
and digitalisation.

We are 17,000 devoted
experts within the fields of
infrastructure, industry and
energy, operating across
the word to create
sustainable solution for
future generations.

Making Future

THE VALUE OF SOLAR IN THE REPUBLIC OF IRELAND

CONTACT DETAILS

                     Tom Ingelse
                     tom.ingelse@afry.com
                     +44 7384 215979

                     Andy Kelly
                     andy.kelly@afry.com
                     ++44 (0)7824 145092

AFRY Management Consulting provides leading-edge consulting and advisory services covering
the whole value chain in energy, forest and bio-based industries. Our energy practice is the
leading provider of strategic, commercial, regulatory and policy advice to European energy
markets. Our energy team of over 250 specialists offers unparalleled expertise in the rapidly
changing energy markets across Europe, the Middle East, Asia, Africa and the Americas.

                         Copyright ©2021 AFRY Management Consulting Limited
                                                    All rights reserved
No part of this publication may be reproduced, stored in a retrieval system or transmitted in any form or by any
means electronic, mechanical, photocopying, recording or otherwise without the prior written permission of AFRY
Management Consulting Ltd (“AFRY”).
This report is provided to the legal entity identified on the front cover for its internal use only. This report may not be
provided, in whole or in part, to any other party without the prior written permission of an authorised representative of
AFRY. In such circumstances additional fees may be applicable and the other party may be required to enter into
either a Release and Non-Reliance Agreement or a Reliance Agreement with AFRY.

                                                       Important
This document contains confidential and commercially sensitive information. Should any requests for
disclosure of information contained in this document be received (whether pursuant to; the Freedom of
Information Act 2000, the Freedom of Information Act 2003 (Ireland), the Freedom of Information Act
2000 (Northern Ireland), or otherwise), we request that we be notified in writing of the details of such
request and that we be consulted and our comments taken into account before any action is taken.
                                                       Disclaimer

While AFRY considers that the information and opinions given in this work are sound, all parties must rely upon their
own skill and judgement when making use of it. AFRY does not make any representation or warranty, expressed or
implied, as to the accuracy or completeness of the information contained in this report and assumes no responsibility
for the accuracy or completeness of such information. AFRY will not assume any liability to anyone for any loss or
damage arising out of the provision of this report.
The report contains projections that are based on assumptions that are subject to uncertainties and contingencies.
Because of the subjective judgements and inherent uncertainties of projections, and because events frequently do not
occur as expected, there can be no assurance that the projections contained herein will be realised and actual results
may be different from projected results. Hence the projections supplied are not to be regarded as firm predictions of
the future, but rather as illustrations of what might happen. Parties are advised to base their actions on an awareness
of the range of such projections, and to note that the range necessarily broadens in the latter years of the projections.

AFRY MANAGEMENT CONSULTING                                                                                February 2021
                                                                                                         2020/41X403417/A
                                                                                                                         3
THE VALUE OF SOLAR IN THE REPUBLIC OF IRELAND

                                   TABLE OF CONTENTS

1    EXECUTIVE SUMMARY                                                                        6
    1.1   Lower overall societal costs                                                        7
    1.2   Lower carbon emissions                                                              7
    1.3   A more secure electricity system                                                    7
    1.4   Recommendations                                                                     7

2    INTRODUCTION                                                                           10
    2.1 Background                                                                           10
          2.1.1   PSO costs of supporting future renewables capacity                         10
          2.1.2   PSO costs of supporting existing renewables capacity                       12
          2.1.3   Costs of meeting electricity demand                                        12
          2.1.4   Level of carbon emissions from power generation                            12
          2.1.5   Curtailment and constraint payments                                        13
          2.1.6   DS3 and network reinforcements                                             13

    2.2 Structure of this report                                                             13
    2.3 Conventions                                                                          13
          2.3.1   Sources                                                                    14

3    METHODOLOGY                                                                            15
    3.1 Approach to assessing the value of solar                                             15
          3.1.1   Scenarios modelled in the study                                            15
          3.1.2   Calculating PSO costs of supporting future renewables capacity             16
          3.1.3   Calculating PSO costs of supporting existing renewables capacity           17
          3.1.4   Calculating costs of meeting electricity demand                            17
          3.1.5   Calculating level of carbon emissions                                      18
          3.1.6   Calculating curtailment                                                    18

    3.2 Key scenario inputs                                                                  18
    3.3 BID3 POWER MARKET MODEL                                                              19

4    RESULTS                                                                                20
    4.1 PSO costs of supporting future renewables capacity                                   21
          4.1.1   Sensitivity – assuming different strike prices                             23

    4.2 PSO costs of supporting existing renewables capacity                                 24
    4.3 Costs of meeting electricity demand                                                  25
          4.3.1   Comparing the increase in cost of meeting demand with the decrease in
                  PSO costs of supporting renewables                                    26

    4.4 Level of carbon emissions from power generation                                      27
    4.5 Curtailment and constraint payments                                                  28
    4.6 Other qualitative aspects considered                                                 29

AFRY MANAGEMENT CONSULTING                                                         February 2021
                                                                                2020/41X403417/A
                                                                                              4
THE VALUE OF SOLAR IN THE REPUBLIC OF IRELAND
4.6.1 The DS3 programme 29
4.6.2 Network reinforcements 29
5 CONCLUSIONS 31
ANNEX A KEY INPUTS 33
A.1 Fuel and carbon prices 33
A.2 Demand 34
A.3 Capacity and generation mix 35
A.4 Strike prices 36
A.4.1 LCOE per technology 36
A.4.2 Strike prices per technology 36
A.5 System constraints 38
A.6 Potential impact of changing key inputs 39
ANNEX B BID3 POWER MARKET MODEL 40
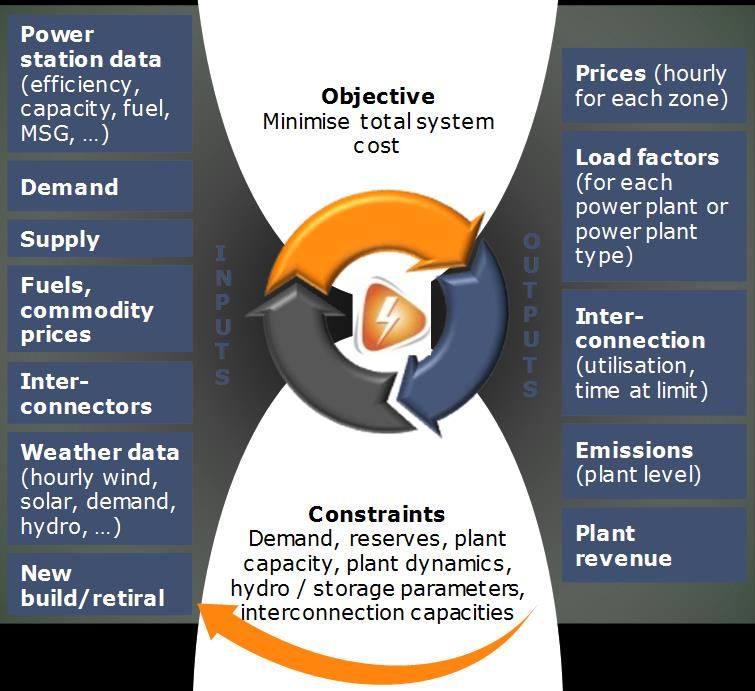
B.1 What is the role of BID3 in AFRY’s energy system? 40
B.2 How does BID3 work? 40
AFRY MANAGEMENT CONSULTING February 2021
2020/41X403417/A
5
THE VALUE OF SOLAR IN THE REPUBLIC OF IRELAND

 1         Executive Summary
   While comparisons of RESS1 auction bids across different technologies are
   important, they do not tell the whole story of which renewables
   technologies are most appropriate to build. Future deployment based
   purely on auction bids may lead only to further onshore wind being built
   in Ireland. However, a more balanced mix of new wind and solar leads to:
   (1) lower societal costs; (2) lower carbon emissions; and (3) more secure
   system.

           Ireland has adopted a 70% renewables penetration target for 20302 with
           further decarbonisation ambition to 2050 in light of the Paris Agreement. In
           order to stimulate further investment in renewable generation, Ireland has
           introduced the Renewable Electricity Support Scheme (RESS), a technology
           neutral two-way Contract-for-Difference (CfD) scheme that is paid for via the
           Public Service Obligation (PSO). The result of the first RESS auction
           notwithstanding, it is widely accepted that the levelized cost of solar is
           higher than that of onshore wind in the all-island Single Electricity Market
           (SEM). In turn, cost-reflective RESS auction bid prices will generally favour
           onshore wind, resulting in the view that onshore wind naturally provides the
           most attractive way to decarbonize the Irish power system.

           However, decisions on which renewable technology to build for achieving the
           renewable penetration targets should not depend on relative auction bids
           alone. While auction bids are important, they do not tell the whole story. For
           example, solar and wind projects with the same strike price would not
           necessarily expect to receive the same level of RESS support, as their
           respective captured wholesale price may be quite different. This means solar
           projects with a higher strike price than onshore wind may have the same or
           lower cost of support. Other aspects to consider are: (1) PSO costs of
           supporting future renewable capacity under RESS; (2) PSO costs of
           supporting existing REFIT renewable capacity; (3) costs of meeting electricity
           demand; (4) level of overall emissions; (5) curtailment and constraint
           payments; (6) DS3; and (7) network reinforcements.

           1
               DECC, Renewable Energy Support Scheme, 20 December 2019.
           2
               DECC, Ireland’s National Energy and Climate Plan 2021-2030, 15 June 2020.

AFRY MANAGEMENT CONSULTING                                                           February 2021
                                                                                    2020/41X403417/A
                                                                                                  6
THE VALUE OF SOLAR IN THE REPUBLIC OF IRELAND

           This study finds that achieving the 2030 RES-E ambitions through a more
           balanced mix of new wind and solar leads to a number of benefits to society
           in the Republic of Ireland when compared to a scenario that relies more
           heavily on new wind developments alone.

           1.1          Lower overall societal costs
           This study finds that a more balanced mix of new wind and solar
           substantially reduces total annual societal costs in Ireland (Exhibit 1.1). That
           is, a more balanced mix of new wind and solar avoids some of the increases
           in PSO costs of supporting future and existing renewables that would
           otherwise occur, which also more than offsets the relatively higher cost of
           meeting demand. The positive net effect to society is expected to be greater
           than the levels illustrated in Exhibit 1.1, were the lower levels of balancing
           costs, constraint payments and network reinforcement costs also quantified3.

           As part of this finding, this study shows that solar can achieve a high strike
           price in the next auction and still provide lower cost to consumers than
           onshore wind, even when a more balanced mix of wind and solar is built.

           1.2          Lower carbon emissions
           This study also shows that a more balanced mix of new wind and solar leads
           to lower carbon emissions from power generation in Ireland (Exhibit 1.2). By
           replacing some wind with the same amount of solar in MWh, annual
           emissions can further reduce by 7% in 2030 and 8% in 2035.The key driver
           behind this finding is the daytime generation profile of solar displacing more
           carbon intensive thermal plants.

           1.3          A more secure electricity system
           This study shows that a more balanced mix of new wind and solar results in
           significantly lower levels of renewable curtailment in Ireland (Exhibit 1.3).
           Hence, there will be less need for redispatch of thermal plant to replace
           curtailed volume, and therefore constraint payments will be lower. This also
           means there is less balancing to be done, as there will be less reliance on the
           relatively more variable wind generation.

           1.4          Recommendations
           This study shows that a more diverse mix of renewable generation would
           provide improved outcomes. Relying solely on strike price comparisons in
           next RESS auctions may not allow for this to be realised, and therefore some
           form of mechanism could be employed to provide a more equitable
           comparison. For example, as with the first RESS auction (RESS-1), a
           preference category for solar could be included in future auctions to ensure
           some solar. The Evaluation Correction Factor (ECF) could also be used in the
           determination of successful projects, for example by assigning an ECF to
           solar in RESS auctions below 1.0 to reflect some of the identified benefits.

           3
               Quantifying these elements is outside the scope of this study

AFRY MANAGEMENT CONSULTING                                                        February 2021
                                                                                  2020/41X403417/A
                                                                                                7
THE VALUE OF SOLAR IN THE REPUBLIC OF IRELAND
Exhibit 1.1 – Annual societal cost differential between the Lower/Higher Solar Ambition and the No Solar Ambition scenario in
the Republic of Ireland (€m, real 2019 money)
A more balanced mix of wind and solar substantially reduces societal cost, particularly due to lower costs of supporting future renewables.
€m
150
100
Cost of meeting
demand
50
Cost of supporting
0 existing renewables
capacity
-50 Cost of supporting
future renewables
-100 capacity
Cost of overall
-150 emissions from
power generation
-200 Net cost
-250
2025 2030 2035 2025 2030 2035
Difference between Lower Solar Ambition Difference between Higher Solar Ambition
and No Solar Ambition and No Solar Ambition
AFRY MANAGEMENT CONSULTING February 2021
2020/41X403417/A
8THE VALUE OF SOLAR IN THE REPUBLIC OF IRELAND
Exhibit 1.2 – Total emissions from the power generation sector Exhibit 1.3 – Total renewable curtailment in the Republic of
by hour of the day in 2030 in the Republic of Ireland (ktCO2) Ireland (TWh)
A more balanced mix of new wind and solar significantly reduces A more balanced mix of wind and solar better reflects the shape of
emissions by replacing higher emitting thermal generation across the demand, which means system constraints are binding less often.
day.
ktCO2 TWh Offshore Wind Onshore Wind Solar PV
200 Lower Solar 5
Ambition
No Solar
Ambition
4
160
Higher
Solar
Ambition
3
120
2
80
1
40
0
2025
2025
2030
2030
2035
2030
2035
2025
2035
0 No Solar Lower Solar Higher Solar
1 2 3 4 5 6 7 8 9 10 11 12 13 14 15 16 17 18 19 20 21 22 23 24 Ambition Ambition Ambition
AFRY MANAGEMENT CONSULTING February 2021
2020/41X403417/A
9THE VALUE OF SOLAR IN THE REPUBLIC OF IRELAND
2 Introduction
This study has been commissioned by the Irish Solar Energy Association
(ISEA) to assess some of the potential ‘hidden’ benefits of solar to Irish
society.
2.1 Background
Ireland has adopted a 70% renewables penetration target for 2030, with
Northern Ireland likely to introduce its own targets in 2021. In order to
stimulate investment in renewable generation, Ireland has introduced the
Renewable Electricity Support Scheme (RESS), a technology neutral two-way
Contract-for-Difference (CfD) scheme that is paid for via the Public Service
Obligation (PSO). The result of the first RESS auction notwithstanding, it is
widely accepted that the Levelized Cost of Electricity (LCOE) of solar in the
all-island Single Electricity Market (SEM) is higher than that of onshore
wind4. In turn, cost-reflective RESS auction bid prices will generally favour
onshore wind, resulting in the view that onshore wind naturally provides the
most attractive way to decarbonise the Irish power system.
While respective auction bids are important, auction bids do not tell the
whole story of which renewables technologies are most appropriate to build.
The following subsections discuss the ‘hidden’ benefits to society that should
also be considered, namely impacts on:
PSO costs of supporting future renewables capacity;
PSO costs of supporting existing renewables capacity;
costs of meeting electricity demand;
overall level of carbon emissions;
constraint payments; and
the DS3 programme and network reinforcements.
2.1.1 PSO costs of supporting future renewables capacity
Rather than only looking at the respective CfD strike price that may be
expected from solar or wind projects competing in the RESS auctions, the
total PSO cost of supporting these renewable projects should be considered.
Besides strike prices, the other aspect to consider is the capture prices, as
4
BEIS, Electricity Generation Costs 2020, August 2020.
AFRY MANAGEMENT CONSULTING February 2021
2020/41X403417/A
10THE VALUE OF SOLAR IN THE REPUBLIC OF IRELAND
the cost of support is determined by the difference between the respective
capture price5 and strike price.
Capture prices for wind and solar are not expected to be the same in the
Irish market, as shown in Exhibit 2.1. Due to the high level of wind already
on the system and the typical hours when wind generation is high (often
overnight when demand is low), hourly power prices tend to be low when
wind generation is high. By contrast, because there is very little solar on the
system and solar generates during the day when demand tends to be higher,
hourly power prices tend also to be higher when solar generation occurs.
Exhibit 2.1 – Capture prices for wind and solar in the SEM in 2020
(€/MWh, nominal money)
While average solar capture prices were at the same level as average baseload prices through
2020, average wind cannibalisation was more than 10% in 2020.
€/MWh
Capture price Wholesale electricity price
40
+0.1%
35 -11%
30
25
20
15
10
5
0
Wind capture price Solar capture price
Notes: This is based on metered generation from December 2019 to November 2020.
If a renewables penetration of 70% is to be reached by increasing already
high levels of wind capacity even further, the likely downward impact on
wholesale prices captured by RESS-supported wind will be significant.
For the purposes of this study, we looked at a range of future outcomes of
wind and solar in the SEM, spanning both Northern Ireland and the Republic
of Ireland, to assess how these may affect these capture prices for future
supported renewables, and thereby the PSO cost of these renewables in the
Republic of Ireland.
5
Capture prices refers to the average price a generator expects to receive from the
wholesale market, as determined by their hourly generation profile and the hourly profile
of prices in the market.
AFRY MANAGEMENT CONSULTING February 2021
2020/41X403417/A
11THE VALUE OF SOLAR IN THE REPUBLIC OF IRELAND
2.1.2 PSO costs of supporting existing renewables capacity
The second key aspect is the PSO costs of payments to existing REFIT-
supported renewable projects.
Due to their very low marginal cost of production, increasing levels of
renewables leads to downward pressure on wholesale electricity prices.
Delivering a renewables penetration of 70% by relying substantially on
further wind capacity alone would increase this downward price impact even
further when compared to a more balanced deployment, and the downward
impact on capture prices for REFIT-supported wind will also be significant.
Mitigation of the reduction in wholesale and wind capture prices would help
to reduce the PSO costs of supporting REFIT-supported wind.
2.1.3 Costs of meeting electricity demand
As Ireland increases its renewables penetration, electricity prices will see
significant downward pressure, and thereby the costs of satisfying electricity
demand at wholesale electricity prices.
Due to the complementary nature of wind and solar6, wholesale electricity
prices are not expected to decline as much in scenarios that reflect a greater
proportion of solar generation than when only wind would be added to the
system. This is because wind and solar typically generate at different times;
wind generation usually is highest during the night and in the winter,
whereas solar generation only happens during the day and is highest in the
summer.
2.1.4 Level of carbon emissions from power generation
The third aspect considered relates to the overall level of emissions from
power generation in Ireland. An increase in the renewable penetration to
70% will greatly reduce carbon emissions from current levels (c. 40%)
However, this report shows that adding a more balanced mix of wind and
solar capacity has the potential to reduce carbon emissions by more than by
solely adding more wind capacity. Wind often generates when demand is
already relatively low (e.g. overnight), and adding further wind generation at
these times tends to displace relatively more efficient thermal generation. In
contrast, solar generation will often more readily displace less efficient, and
therefore higher emitting, thermal generation during the day, when levels of
demand are high and the required thermal generation is therefore higher.
With the cost of carbon emissions under the EU ETS already above €30/tCO2
and expected to rise further, this could represent a significant advantage
that is not captured solely by comparing auction strike prices.
6
Heide, Dominik, et al. "Seasonal optimal mix of wind and solar power in a future, highly
renewable Europe." Renewable Energy 35.11, 2010.
AFRY MANAGEMENT CONSULTING February 2021
2020/41X403417/A
12THE VALUE OF SOLAR IN THE REPUBLIC OF IRELAND
2.1.5 Curtailment and constraint payments
The relatively isolated nature of the all-island system combined with already
high levels of renewables penetration makes curtailment a major issue in the
SEM. The SEM currently has a 65% system non-synchronous penetration
(SNSP) limit; this limit means that no more than 65% of system demand in
any period can be met by non-synchronous generation, which today
generally refers to wind, solar and generation imported on the
interconnectors.7
When renewable generation is curtailed, an amount of thermal generation
must be redispatched to compensate for the reduction, occasionally at
significant cost. These costs, known as constraint payments, are projected to
be €286m for 2020/218.
Increasing the renewables penetration by adding increasing amounts of wind
generation to the system will increase curtailment significantly, and
potentially by more than if a mix of wind and solar were added. Scenarios
resulting in 70% renewable penetration in 2030 which reflect a higher level
of solar generation would lead to lower curtailment, and thus be expected to
mitigate the level of constraint payments in the future.
2.1.6 DS3 and network reinforcements
Besides the aspects addressed above, there are more potential benefits to
society of having a blend of new wind and solar. In this study, we will also
discuss in a qualitative basis how DS3 and network reinforcements may be
affected by the choice of future renewable deployment.
2.2 Structure of this report
The remainder of this report is structured so that Section 3 describes the
methodology, particularly the approach to assessing the value of solar.
Section 4 discusses the results of this study. Last, Section 5 ends with
concluding remarks of this study.
Besides that, Annex A and Annex B provide further information on key
scenario inputs and AFRY’s proprietary power market model, BID3,
respectively.
2.3 Conventions
all monetary values quoted in this report are in euro in real 2019 prices,
unless otherwise stated; and
annual data relates to calendar years running from 1 January to 31
December, unless otherwise identified.
7
Note that a trial of 70% SNSP limit has commenced in January 2021.
8
SEM-Committee, Imperfections Charge October 2020 – September 2021 and Reforecast
Report October 2018 – September 2019, 27 August 2020.
AFRY MANAGEMENT CONSULTING February 2021
2020/41X403417/A
13THE VALUE OF SOLAR IN THE REPUBLIC OF IRELAND
2.3.1 Sources
Unless otherwise attributed the source for all tables, figures and charts is
AFRY Management Consulting.
AFRY MANAGEMENT CONSULTING February 2021
2020/41X403417/A
14THE VALUE OF SOLAR IN THE REPUBLIC OF IRELAND
3 Methodology
This chapter sets out the approach to assessing the value of the various
impacts of solar generation on the society in the Republic of Ireland as
outlined above, which is done by means of a counterfactual analysis. The
chapter also briefly touches upon key scenario inputs and BID3, which is
AFRY’s proprietary power market model.
3.1 Approach to assessing the value of solar
This study uses counterfactual analysis to investigate the potential value of
solar’s ‘hidden’ benefits to the society in the Republic of Ireland. The basis of
this analysis is to posit a counterfactual scenario of what the power system
would look like if all incremental renewables generation to 2035 were wind
and how outcomes would compare if a range of outcomes on the levels of
solar and wind were developed instead.
All scenarios modelled in this study result in an overall renewable
penetration of 70% by 2030 in the SEM, and differ only in the volume of
solar and wind capacity deployed to achieve this. By keeping all other
variables constant, the impact of building varying outcomes of wind and
solar rather than solely wind is isolated.
3.1.1 Scenarios modelled in the study
This study considers three alternative scenarios for the make-up of the SEM.
Under each of these scenarios, the overall level of renewable penetration in
2030 is 70% in the SEM (i.e. in both Northern Ireland and the Republic of
Ireland), however the make-up of the scenarios differ as follows:
1. No Solar Ambition (NSA), which represents a counterfactual scenario
without any further new solar beyond current levels9;
2. Lower Solar Ambition (LSA), which assumes a total of 2.5GW solar is
installed in the SEM by 2030; and
9
This scenario includes the 796.3MW solar awarded contracts through RESS-1
auction on 4 August 2020.
AFRY MANAGEMENT CONSULTING February 2021
2020/41X403417/A
15THE VALUE OF SOLAR IN THE REPUBLIC OF IRELAND
3. Higher Solar Ambition (HSA), which assumes a total of 5GW solar is
installed in the SEM by 2030.
The three scenarios differ only by generation capacity mix, as demonstrated
in Exhibit 3.1.
Exhibit 3.1 – Wind and solar generation mix per scenario (TWh)
TWh
40
35
30 Future solar
25 Future onshore
20 Future offshore
15 RESS-1 solar
RESS-1 onshore
10
Existing solar
5
Existing onshore
0
NSA
HSA
NSA
HSA
NSA
HSA
LSA
LSA
LSA
2025 2030 2035
Notes: In all three scenarios, RESS-1 capacity is expected to develop as planned and 1GW of offshore wind capacity is
expected by 2030.
The capacities set out above are not forecasts of future renewables capacity.
They are designed to provide an appropriate and relatively conservative set
of assumptions intended to answer the question about the hidden value of
solar. The selected capacities are a product of a number of constraining
assumptions (e.g. meeting rather than surpassing demand). If other use
cases accelerate (e.g. offshore wind being utilised for hydrogen, or greater
demand for electrification than this model contains), then the overall
technology mix may look very different but the dynamics brought out by this
analysis would be expected to hold true (i.e. the value of some diversification
of renewable capacity provided by solar).
3.1.2 Calculating PSO costs of supporting future renewables
capacity
The cost in any given hour for supporting all future RESS-supported capacity
(incl. RESS-1) in Ireland can be estimated as the sum of the payments from
and to the supported renewable generators for each onshore wind, offshore
wind and solar technologies.
For a given technology in a given hour, the cost / (benefit) to the PSO Levy
from RESS supported capacity (i.e. the payments to / (from) the generators)
will be equal to the CfD strike price minus the prevailing hourly wholesale
AFRY MANAGEMENT CONSULTING February 2021
2020/41X403417/A
16THE VALUE OF SOLAR IN THE REPUBLIC OF IRELAND
price multiplied by the metered generation (i.e. net of curtailment) of the
technology.
This is then summed across all hours in a year to give the costs relating to
each technology. Aggregating across all of the technologies gives the total
RESS cost in a year, which can be compared between the three scenarios for
the years in question and between onshore wind and solar PV.
3.1.2.1 CfD strike prices
The CfD strike price is an assumption that has a significant impact on the
overall results of the analysis, which is discussed in Annex A.4. The strike
prices for RESS-1 naturally apply to the RESS-1 capacity; the average strike
price of RESS-1 and 2025 apply to capacity built up to and including 2025;
the average strike price for 2025 and 2030 applies to capacity built between
2026 and 2030; and the average strike price for 2030 and 2035 applies to
capacity built to 2035.
Given the importance of the choice of strike prices on the outcome of these
results, two more extreme approaches are also investigated:
Rapid Cost Change – assumes the strike price for each year are
specifically used for all future capacity in the given year (e.g. 2030 strike
prices are used for all future capacity built up to 2030).
No Cost Change – assumes the strike prices remains at 2025 levels.
3.1.3 Calculating PSO costs of supporting existing renewables
capacity
The cost to the PSO Levy of supporting REFIT-supported onshore wind is the
difference between Total Market Revenue (TMR) and Total REFIT Payment
(TRP) provided TRP is larger than TMR over the course of a year:
TMR includes energy market revenues, capacity payments and constraint
payments, although for the purposes of this study the latter two will be
considered to be zero.
TRP is calculated as the product of metered generation and the sum of
the Technology Reference Price and Balancing Payment. In this study, all
REFIT capacity follows the rules of REFIT2 and REFIT3. A reference price
of €70/MWh and a balancing payment of €9.90/MWh have been assumed
for wind in real 2019 money.
Thus, the annual PSO cost for supporting REFIT onshore wind can be
estimated as the difference between the technology-specific wholesale
capture price and the sum of the Technology Reference Price and Balancing
Payment multiplied by the metered generation (i.e. net of curtailment) of the
technology.
3.1.4 Calculating costs of meeting electricity demand
Combining modelled hourly wholesale electricity prices and hourly electricity
demand in Ireland creates the overall cost of Irish electricity demand on an
hourly level. This hourly cost can be aggregated by year and can
AFRY MANAGEMENT CONSULTING February 2021
2020/41X403417/A
17THE VALUE OF SOLAR IN THE REPUBLIC OF IRELAND
subsequently be compared between the scenarios. The assumed demand is
presented in Annex A.
3.1.5 Calculating level of carbon emissions
Because our modelling generates an hourly dispatch schedule and also
requires plant efficiencies, we can calculate hourly carbon emissions by
applying known emissions factors to the fuel projected to be consumed by all
thermal plant in Ireland.
This can be represented as both the carbon intensity of generation as well as
the absolute volume of carbon emissions, with differences between the
scenarios derived thence. Furthermore, multiplying the absolute volume of
carbon emissions by the assumed future carbon price10 provides a cost for
these emissions.
3.1.6 Calculating curtailment
AFRY’s balancing market modelling captures the balancing actions by the
TSO, under which the TSOs instruct plants to move away from their expected
generation level, or final physical notifications in order to:
maintain the supply and demand balance in the market as a whole
(‘energy actions’); and
ensure that the system is secure (i.e. address system issues that would
still exist even if the market had perfectly balanced) by addressing
system operator constraints (‘non-energy actions’), which result in a net
zero energy change to the system.
The level of curtailment depends heavily on the (developments of the)
system constraints, particularly the SNSP limit. This study assumes that
system constraints will improve in line with expectations by EirGrid and
SONI. These assumptions are presented in Annex A.5.
The total cost of constraint payments is fundamentally driven by the volume
of redispatch generation required and the price of the redispatch actions. A
material driver of the volume of redispatch actions is the extent of
curtailment of intermittent renewables generation. When wind and/or solar
generation are curtailed, synchronous, typically thermal, generation must be
redispatched to compensate for the reduction. Therefore, the level of
curtailment of all renewables is directionally an important driver of the level
of constraint payments in each scenario.11
3.2 Key scenario inputs
Besides the generation mix, key scenario inputs do not differ per scenario
and have been taken from publicly available third party sources, such as
10
Future carbon prices are informed by National Grid’s 2020 Future Energy Scenarios, as
described in more detail in Annex A.
11
It is beyond the scope of this study to assess the specific redispatch costs associated
with the different levels if curtailment seen in the modelled scenarios.
AFRY MANAGEMENT CONSULTING February 2021
2020/41X403417/A
18THE VALUE OF SOLAR IN THE REPUBLIC OF IRELAND
EirGrid, BEIS and National Grid. More information on these key inputs can be
found in Annex A.
3.3 BID3 POWER MARKET MODEL
AFRY’s proprietary power market modelling software, BID3, is used to model
the ex-ante and balancing markets of the SEM. It provides a simulation of all
the major power market metrics on an hourly basis, such as electricity
prices, dispatch and redispatch of power plants and flows across
interconnectors. Annex B provides a brief description of BID3 and how it has
been used to obtain the required outputs for this analysis.
AFRY MANAGEMENT CONSULTING February 2021
2020/41X403417/A
19THE VALUE OF SOLAR IN THE REPUBLIC OF IRELAND
4 Results
In this chapter, we find that a more balanced mix of new wind and solar
leads to: (1) a reduction in the increase of PSO costs for supporting both
future and existing renewables; (2) higher costs of meeting electricity
demand; (3) lower overall carbon emissions; (4) reduction in curtailment
and thereby constraint payments; and (5) a more secure system
When a mix of new solar and wind is added to the system, net annual
societal costs could reduce by as much as €106 million in 2035 in
comparison to when only new wind is added (Exhibit 4.1).
Exhibit 4.1 – Annual societal cost differential between the Lower/Higher Solar
Ambition and the No Solar Ambition scenario in Ireland (€m, real 2019 money)
Adding a mix of new wind and solar may reduce annual societal costs substantially.
€m
150 Cost of meeting
100 demand
50 Cost of supporting
0 future renewables
capacity
-50 Cost of supporting
existing renewables
-100
capacity
-150 Cost of overall
emissions from power
-200 generation
-250 Net cost
LSA HSA LSA HSA LSA HSA
2025 2030 2035
Notes: The cost of emissions from the power sector reflects the cost based on the assumed carbon prices in this study;
however, the cost of emissions could have been greater if it would have been based on the social cost of emissions. In
addition, the cost of supporting existing renewables is shown until 2030, as REFIT support lasts until the early 2030s.
AFRY MANAGEMENT CONSULTING February 2021
2020/41X403417/A
20THE VALUE OF SOLAR IN THE REPUBLIC OF IRELAND
The subsequent sections will go into more detail of each of the components
shown in the stack above, and will discuss how different mixes of wind and
solar affect constraint payments, the DS3 programme and network
reinforcements.
4.1 PSO costs of supporting future renewables capacity
The PSO cost of future renewable capacity in the Republic of Ireland is
presented in Exhibit 4.2.
PSO costs for supporting future renewable capacity rapidly increase when
only new wind is added to the system (i.e. the NSA scenario). The main
reason for this is because further adding more wind to the system to achieve
a renewables penetration of 70% results in substantially increased
cannibalisation of wind capture prices. Much lower capture prices therefore
result in higher levels of support being paid. This is particularly the case
because of the high level of wind already on the system, and because the
hours when wind generation are high are often when demand is low (e.g.
overnight). Consequently, wholesale electricity prices tend to be low at times
when wind is generating, and this issue would evidently increase further by
only building more wind.
In contrast, both the LSA and HSA scenarios avoid some of the increase in
PSO costs. This stems from the fact that a more balanced mix of new wind
and solar avoids the more rapid decline in wind capture prices seen when
only new wind would be built.
Exhibit 4.2 – PSO cost of supporting future renewables (€m, real 2019 money)
A more balanced mix of new wind and solar mitigates the material increase in PSO costs.
€m
Payment from generators Payment to generators Net cost
800
700
600
500 Solar
400 Offshore
300
200 Onshore
100
0
-100
-200
NSA LSA HSA NSA LSA HSA NSA LSA HSA
2025 2030 2035
AFRY MANAGEMENT CONSULTING February 2021
2020/41X403417/A
21THE VALUE OF SOLAR IN THE REPUBLIC OF IRELAND
To further support the above, the two underlying drivers of these support
costs are shown below, namely the average strike prices across the portfolio
of future renewables (Exhibit 4.3) and the capture prices of the future
renewables (Exhibit 4.4). The unit cost of supporting future renewable
generation is essentially the difference between these two values.
The average strike prices across the portfolio of future solar are higher than
onshore wind, although this difference becomes smaller over time. These
average strike prices are a cumulative representation that reflects the year
when it is assumed capacity starts receiving support. The underlying annual
strike prices have been set out in Annex A.4. The average strike prices of
solar remain higher than onshore wind principally due to the high annual
strike prices of solar in the early years.
However, by choosing the renewable technology based on the RESS strike
price alone, one neglects that wind and solar capture prices are different.
The difference in wind and solar capture prices increase over time, although
this difference is reduced when more solar is built.
As a side note, onshore wind capture prices are higher with a more balanced
mix of wind and solar. Naturally, this is a benefit for onshore wind projects
that do not or no longer receive support.
Exhibit 4.3 – Average strike prices across Exhibit 4.4 – Annual capture prices of
the portfolio of future renewables supported future renewables (€/MWh,
(€/MWh, real 2019 money) real 2019 money)
The average strike price of the solar portfolio The difference in wind and solar capture
is higher than onshore wind, although this prices increase over time, although much
difference becomes smaller over time. more limited when more solar is built.
€/MWh €/MWh
80
70
Solar
60 Onshore Solar
15 13 11 32 26
50 18
26 22
15
Onshore
40
30
20
10
0
NSA
HSA
NSA
HSA
NSA
HSA
LSA
LSA
LSA
NSA
HSA
NSA
HSA
NSA
HSA
LSA
LSA
LSA
2025 2030 2035 2025 2030 2035
AFRY MANAGEMENT CONSULTING February 2021
2020/41X403417/A
22THE VALUE OF SOLAR IN THE REPUBLIC OF IRELAND
Based on the strike prices and the capture prices, the support cost can be
considered per unit of generation, shown in Exhibit 4.5. This demonstrates
that solar can achieve a high strike price in the next auction and still provide
lower cost to consumers than onshore wind, even under the HSA scenario.
For example, if the ambition is to reach 2.5GW of solar in the SEM by 2030,
in order for the support cost per MWh of solar to be equal to that of onshore
wind, the strike price of solar can be €13/MWh higher than the assumed
strike price used in this study. This chart also shows that there is still a
spread of €8/MWh between the support costs of onshore wind and solar
under the HSA scenario, which indicates that even more solar capacity may
provide further overall benefits to society.
Exhibit 4.5 – Discounted support cost per unit of generation over the supported
period for the forthcoming auction (€/MWh, real 2019 money)
Solar can achieve a high strike price in the next auction and still provide lower cost to
consumers than onshore wind, even under the HSA scenario.
€/MWh
24
20
Onshore wind
16
13 8
12
Solar PV
8
4
0
NSA LSA HSA
Notes: The assumed hurdle rates are 4.2% for wind and 5.0% for solar PV in accordance with the underlying LCOE
assumptions from the 2020 Generation Cost Update by BEIS.
4.1.1 Sensitivity – assuming different strike prices
Because the strike prices are a key input assumption with material
uncertainty, we have also assessed what happens to the PSO cost for future
renewable capacity when different strike prices are assumed. Exhibit 4.6
compares the differential in PSO costs of future renewable capacity between
the HSA scenario and the LSA scenario. For each year, the assumed strike
prices are compared with two additional sets of strike prices: No Cost
Change (NCC); and Rapid Cost Change (RCC). Further details on NCC and
RCC can be found in Section 3.1.2.1.
Even if strike prices remain at 2025 levels (i.e. NCC), future renewable
capacity has a much lower PSO cost when a mix of new solar and wind is
AFRY MANAGEMENT CONSULTING February 2021
2020/41X403417/A
23THE VALUE OF SOLAR IN THE REPUBLIC OF IRELAND
added to the system. In fact, even in the case of No Cost Change, the finding
holds that a more balanced mix of wind and solar leads to an overall
decrease in societal costs.
Exhibit 4.6 – Difference in PSO costs of future capacity between the Higher Solar
Ambition and No Solar Ambition with strike price sensitivities (€m, real 2019 money)
€m
250
200 No Cost
Change
150
Assumed
strike prices
100
Rapid Cost
Change
50
0
2025 2030 2035
4.2 PSO costs of supporting existing renewables
capacity
Projections for the PSO costs of payments to REFIT-supported renewables
are shown in Exhibit 4.7. Naturally, the PSO costs of supporting existing
renewables are also affected by the choice of renewables built in the future,
as this affects the resulting level of wholesale prices. Similar to PSO costs for
future renewable capacity, REFIT-supported renewables have a higher PSO
cost per MWh when only wind is built to achieve a renewable penetration of
70%, as a consequence of the higher rate of wind cannibalisation.
AFRY MANAGEMENT CONSULTING February 2021
2020/41X403417/A
24THE VALUE OF SOLAR IN THE REPUBLIC OF IRELAND
Exhibit 4.7 – PSO cost of supporting existing renewables (€m, real 2019 money)
PSO costs of REFIT-supported renewables reduce by as much as 5% in 2030 by supplementing
wind with more solar.
€m
250
200
150
100
50
0
NSA LSA HSA NSA LSA HSA
2025 2030
4.3 Costs of meeting electricity demand
To understand the cost of satisfying electricity demand at wholesale
electricity prices, the wholesale electricity prices projections for the SEM
(Exhibit 4.8) should be investigated as well as the cost of electricity demand
in the Republic of Ireland itself (Exhibit 4.9).
In all scenarios modelled for this study, wholesale electricity prices tend to
follow a very similar path. From 2025 to 2030 in all scenarios, the renewable
penetration increases from 55% to 70% pushing down the wholesale
electricity prices, albeit the impact is somewhat mitigated by increasing
carbon and fuel prices. From 2025 to 2035 in all scenarios, the carbon price
continues to rise, whilst renewable penetration remains at 70%, resulting in
an increase in the wholesale electricity price.
A more balanced mix of wind and solar better reflects the shape in demand,
which generally results in higher wholesale prices. Under the NSA scenario,
wholesale prices are particularly often depressed at times of high wind
generation (often overnight when demand is low). In contrary, under the
NSA and even more so under the HSA scenario, the solar PV generates
during the day when demand tends to be relatively high. As such, solar
generation replaces generators that are higher up in the merit order, and
consequently solar generation will not depress the electricity price as much
as wind does. In other words, solar is not the marginal price setting
technology very often and is not expected to become so unless much greater
volumes of solar are added to the system.
Naturally, as electricity prices are higher when a mix of new solar and wind
are added to the system than when only new wind is added, the cost of
AFRY MANAGEMENT CONSULTING February 2021
2020/41X403417/A
25THE VALUE OF SOLAR IN THE REPUBLIC OF IRELAND
meeting electricity demand is also higher. However, overall this increase in
cost of meeting electricity demand is more than offset by the avoided
increase in support cost for renewables, particularly the future renewable
capacity (both solar and wind). Furthermore, the higher prices may provide
more robust investment signals, especially when the system would also be
less reliant on one particular technology in the case when comparing the NSA
scenario with the HSA scenario.
Exhibit 4.8 – Wholesale electricity prices Exhibit 4.9 – Cost of electricity demand
in the SEM (€/MWh, real 2019 money) in Ireland (€b, real 2019 money)
€/MWh €b
70 3.0
60 2.5
50
2.0
40
1.5
30
1.0
20
10 0.5
0 0.0
NSA
NSA
HSA
NSA
HSA
HSA
NSA
HSA
NSA
HSA
NSA
HSA
LSA
LSA
LSA
LSA
LSA
LSA
2025 2030 2035 2025 2030 2035
Notes: As demand increases, the cost of electricity
demand also increases in contrary to the decrease in
wholesale electricity prices.
4.3.1 Comparing the increase in cost of meeting demand with
the decrease in PSO costs of supporting renewables
While higher wholesale prices reduce the PSO costs of supporting future and
existing renewables capacity, it also increases the cost of meeting electricity
demand. There are two key reasons why there is a net benefit when
comparing these components in the HSA over the NSA scenario:
1. From NSA to HSA, future onshore wind is replaced by future solar PV,
which is fully considered in the PSO cost assessment. As such, any shift in
wholesale prices will be captured in the PSO costs difference. Even at a
higher strike price for solar of €90/MWh through to 2035, there would still
be a net benefit. While a solar strike price of €90/MWh is extreme, the
sensitivity in Section 4.1.1 provides a more realistic range of strike price
outcomes and the consequence it has on the associated PSO costs.
2. The HSA scenario is more self-sufficient than the NSA. In comparison to
the NSA, the HSA: (1) has less exports and less curtailment (i.e. when
wind generation would be setting the price); but (2) also has less imports
during the day (i.e. the price is lower when demand is high). As such, the
upward impact on total costs of meeting demand is more moderate when
weighted by hourly demand.
AFRY MANAGEMENT CONSULTING February 2021
2020/41X403417/A
26THE VALUE OF SOLAR IN THE REPUBLIC OF IRELAND
4.4 Level of carbon emissions from power generation
The total projected carbon emissions from the electricity generation sector
by year and by hour of the day in the Republic of Ireland are presented in,
Exhibit 4.10 and Exhibit 4.11. Although each scenario reflects the same
renewable penetration of 70% (post curtailment), achieving this by adding a
mix of solar and wind is more effective in terms of decarbonisation than by
only adding new wind to the system. As shown, annual emissions can reduce
by as much as 8% by 2035 when comparing the NSA scenario with the HSA
scenario. Substituting some new wind with solar significantly reduces
emissions, as solar is able to replace thermal generation during the day time,
when higher levels of demand mean less efficient thermal generation would
otherwise be operating, while night time emissions only slightly increase.
The key driver behind lower emissions from power generation in these
scenarios is the complementary nature of wind and solar generation in
representing the shape of demand (i.e. the system is more self-sufficient).
That is, solar replaces thermal generation during the day when demand is
usually high. Thus solar also reduces the need for imports that would be
required with wind generation alone. In contrast, the material proportion of
new wind generation occurs at times when less thermal generation can be
displaced (e.g. overnight). This wind generation ends up being exported or
curtailed, particularly because there is already a high level of wind.
Exhibit 4.10 – Total annual emissions Exhibit 4.11 – Total emissions from the
from the power generation sector in power generation sector by hour of the
Ireland (MtCO2) day in Ireland in 2030 (ktCO2)
Annual emissions can reduce by as much as A more balanced mix of wind and solar
8% by 2035 when comparing the NSA significantly reduces emissions by replacing
scenario with the HSA scenario. day time thermal, while night time emissions
only slightly increase.
MtCO2 ktCO2
8 200
NSA
7 LSA
6 160
HSA
5
4 120
3
80
2
1
40
0
NSA
HSA
NSA
HSA
NSA
HSA
LSA
LSA
LSA
0
2025 2030 2035 1 3 5 7 9 11 13 15 17 19 21 23
AFRY MANAGEMENT CONSULTING February 2021
2020/41X403417/A
27THE VALUE OF SOLAR IN THE REPUBLIC OF IRELAND
4.5 Curtailment and constraint payments
Exhibit 4.12 and Exhibit 4.13 present curtailment projections for onshore
wind, offshore wind and solar PV as a percentage of available resource and in
TWh, respectively across the modelled scenarios in the Republic of Ireland.
In all scenarios, curtailment for each technology broadly follows a similar
trend. Onshore wind curtailment increases from 2025 to 2030 following an
increase in renewable penetration from 55% to 70%, and remains at broadly
the same level from 2030 to 2050 as the onshore wind penetration remains
the same. Offshore wind curtailment also increases from 2025 to 2030
following an increase in renewable penetration from 55% to 70%, but
declines from 2030 to 2035 because the relative offshore wind penetration
declines. Solar curtailment only increases slightly, which simply reflects the
moderate level of solar on the system relative to wind.
Comparing scenarios, it is evident that wind and solar generation profiles
work in a complementary fashion, in the sense that adding a mix of new
wind and solar leads to lower level of curtailment than when only new wind is
added to the system. This is because a more balanced mix of wind and solar
better reflects the shape of demand, which means system constraints are
binding less often. More specifically, the solar displaces day-time thermal
generation when demand is high, whereas wind typically generates most
during low demand periods (e.g. overnight) when thermal cannot be
displaced due to system constraints.
Given that less redispatch is required when curtailment is lower, constraint
payments are also expected to be lower when a more balanced mix of new
wind and solar is added to the system.
Exhibit 4.12 – Renewable curtailment in Exhibit 4.13 – Renewable curtailment in
Ireland (% of available resource) Ireland (TWh)
AFRY MANAGEMENT CONSULTING February 2021
2020/41X403417/A
28THE VALUE OF SOLAR IN THE REPUBLIC OF IRELAND
4.6 Other qualitative aspects considered
Besides the aspects discussed above, there are other aspects that are out of
the scope of this study to quantify, but are worthy of note.
4.6.1 The DS3 programme
In order to achieve a renewable penetration of 70% by 2030, improvements
to the system are required. This is where the DS3(+) programme comes
in12, to Deliver a Secure and Sustainable Electricity System; increasing
reliability and predictability. However, there are a number of uncertainties
around these system improvements. For example, whether these system
improvements are technically feasible, whether RoCoF has to increase again
and whether more interconnection is required.
Given that there is such a strong reliance on the uncertain improvements to
system constraints in order to deliver the growth in renewable penetration,
any chance to remove pressure from the reliance on these improvements
should be taken into consideration.
Section 4.5 describes that a more balanced mix of wind and solar can reduce
curtailment and that this more balanced mix better reflects the shape of
demand. In other words, by means of more efficient use of the
complementary nature of wind and solar, a more balanced mix of wind and
solar may make the system more reliable, relieving some pressure from the
DS3+ programme.
Furthermore, with a more balanced mix of wind and solar, the ancillary
services (i.e. DS3 System Services) will also have more volume available
from thermal generation, particularly balancing products. The reason for this
is because solar would displace the thermal generation during the day, which
can now be used as reliable sources for ancillary services.
Moreover, solar generation is easier to predict than wind generation given
that wind generation is much more variable than solar. As wind is the
primary source of electricity generation, the system is heavily reliant on the
predictions of wind generation. As such, a more balanced mix of wind and
solar means less reliance on wind forecasts, and the system may also require
less balancing. Hence, the system becomes more secure when a mix of new
wind and solar is added to the system rather than only adding new wind to
the system.
4.6.2 Network reinforcements
The need for deep transmission reinforcements is fundamentally driven by
the distance of new power generation units from the existing grid. Depending
on where future wind and solar developments take place, there is potential
for a mix of wind and solar to require fewer costly transmission
reinforcements than if solely wind generation is developed. That is, if wind
and solar are built in the same region, there will be less imports to that
12
EirGrid, DS3 programme, 2011 and ongoing.
AFRY MANAGEMENT CONSULTING February 2021
2020/41X403417/A
29THE VALUE OF SOLAR IN THE REPUBLIC OF IRELAND
region due to the complementary nature of wind and solar. This would even
be more the case if wind and solar would be co-located.
AFRY MANAGEMENT CONSULTING February 2021
2020/41X403417/A
30THE VALUE OF SOLAR IN THE REPUBLIC OF IRELAND
5 Conclusions
For Irish policy makers, by choosing the renewable technology based on
the RESS strike price alone, important aspects are neglected.
Furthermore, pursuing the 2030 renewable ambitions by procuring a
balance of new wind and solar to leverage the complementary nature of
wind and solar generation seems to appear as a win-win for all
stakeholders. This study showed that a more balanced mix of new wind
and solar leads to: (1) overall lower societal costs; (2) lower carbon
emissions; and (3) a more secure system.
Deciding which renewable technology to build for achieving the renewable
penetration targets should not depend on auction bids alone. While auction
bids are important, they do not tell the whole story. Other aspects to
consider are: (1) PSO costs of supporting future renewables capacity; (2)
PSO costs of existing REFIT capacity; (3) costs of electricity demand; (4)
emissions; (5) constraint payments; (6) DS3; and (7) network
reinforcements.
A more balanced blend of new wind and new solar
results in lower societal costs
This study showed that a more balanced mix of new wind and solar
substantially reduces annual societal costs in Ireland. That is, a more
balanced mix of new wind and solar avoids material increases in PSO costs of
supporting future and existing renewables that would otherwise occur, which
also more than offsets the relatively higher cost of meeting demand.
As part of this finding, this study showed that solar can achieve a high strike
price in the next auction and still provide lower cost to consumers than
onshore wind, even when a more balanced mix of wind and solar is built.
AFRY MANAGEMENT CONSULTING February 2021
2020/41X403417/A
31THE VALUE OF SOLAR IN THE REPUBLIC OF IRELAND
A more balanced blend of new wind and new solar
results in lower carbon emissions
This study also showed that a more balanced mix of new wind and solar
leads to lower carbon emissions from power generation in Ireland. By
replacing some wind with the same amount of solar in MWh, annual
emissions can further reduce by 7% in 2030 and 8% in 2035.The key driver
behind this finding is the daytime generation profile of solar displacing more
carbon intensive thermal plants.
A more balanced blend of new wind and new solar
results in a more secure system
Finally, this study showed that a more balanced mix of new wind and solar
results in significantly lower levels of renewable curtailment in Ireland.
Hence, there will be less need for redispatch, and therefore constraint
payments will be lower. This also means there is less balancing to be done,
as there will be less reliance on the more variable wind generation.
Discussion
The findings in this study are the result of modelling of alternative scenarios
with assumptions based on third party sources. If these key input
assumptions would differ, they could have an impact on the overall level of
benefits identified in the study, although it is expected that the key
conclusion of the benefit of some diversification would hold. The potential
impact of changes to the key input assumptions are addressed in Annex A.6,
which covers fuel and carbon prices; electricity demand growth; RESS
auction bid prices; and improvements to operational system constraints.
Recommendations
While this study does not seek to answer the question of determining the
optimal future generation mix, the analysis illustrates that a more diverse
mix of renewable generation would provide improved outcomes. Relying
solely on strike price comparisons in the forthcoming RESS auctions may not
allow for this to be realised, and therefore some form of mechanism could be
employed to provide a more equitable comparison.
For example, as with the first RESS auction (RESS-1), a preference category
for solar could be included in future auctions to ensure some solar is
procured in order to capture some of the benefits. Alternatively, setting the
Evaluation Correction Factor (ECF) for solar below 1.0 could be another way
to capture some of the benefits, in the determination of successful projects
based on resulting Deemed Offer Prices (i.e. project-specific offer price
multiplied by technology-specific ECF).
AFRY MANAGEMENT CONSULTING February 2021
2020/41X403417/A
32THE VALUE OF SOLAR IN THE REPUBLIC OF IRELAND
Annex A Key inputs
A.1 Fuel and carbon prices
Fuel and carbon prices have been taken from National Grid’s 2020 Future
Energy Scenarios study using the Base case (Exhibit A.1)13.
Exhibit A.1 – Fuel and carbon prices (Gas (NBP) in p/therm; carbon (EU ETS) in
€/tCO2; oil (Brent) in $/bbl; coal (ARA CIF) in $/tonne; all in real 2019 money)
90
Coal
80 Oil
70 Carbon
60
Gas
50
40
30
20
10
0
2030
2025
2035
13
National Grid, Future Energy Scenarios 2020, July 2020.
AFRY MANAGEMENT CONSULTING February 2021
2020/41X403417/A
33You can also read