London Area REGIONAL INFRASTRUCTURE PLAN August 25th, 2017 - Hydro One
←
→
Page content transcription
If your browser does not render page correctly, please read the page content below

LONDON!!!!!!!!!!!!!!!!!! – Regional Infrastructure Plan   09 January 2017

London Area
REGIONAL INFRASTRUCTURE PLAN

August 25th, 2017
London Area – Regional Infrastructure Plan                                        25 August 2017

                                        [This page is intentionally left blank]

                                                                                              2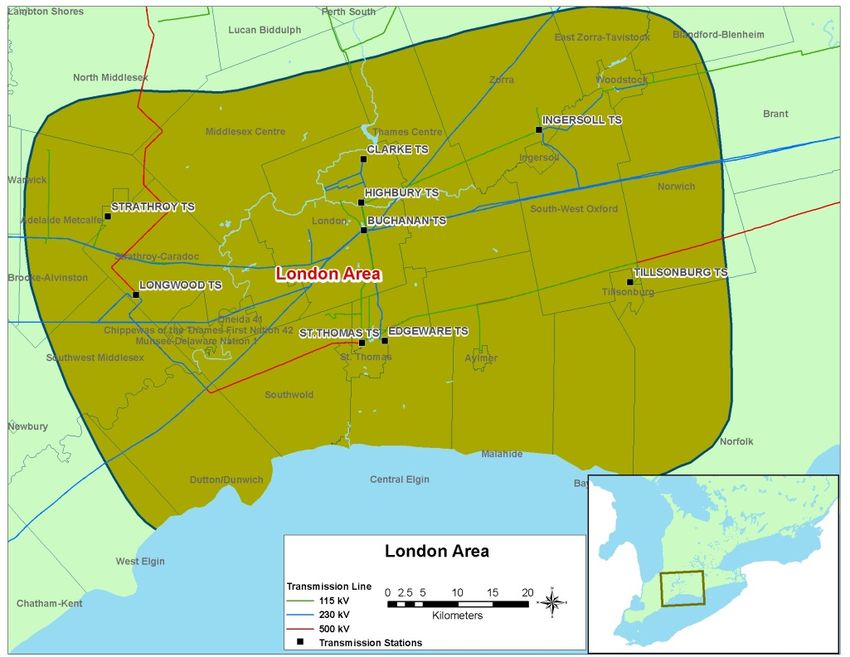
London Area – Regional Infrastructure Plan   25 August 2017

Prepared by:
Hydro One Networks Inc. (Lead Transmitter)

With support from:

          Organizations
   Independent Electricity System
            Operator

                Entegrus Inc.

       Erie Thames Power Lines
             Corporation

           London Hydro Inc.

         St. Thomas Energy Inc.

         Tillsonburg Hydro Inc.

       Hydro One Networks Inc.
            (Distribution)

                                                         3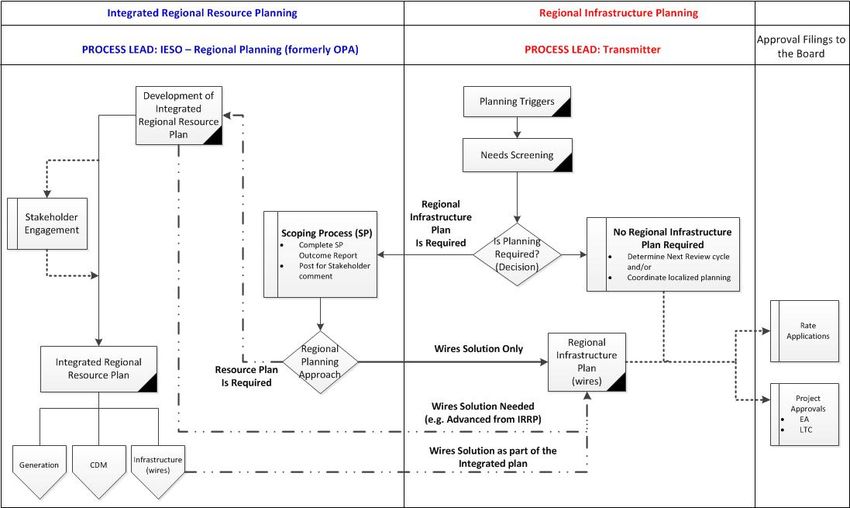
London Area – Regional Infrastructure Plan                                                     25 August 2017

DISCLAIMER
This Regional Infrastructure Plan (“RIP”) report was prepared for the purpose of developing an electricity
infrastructure plan to address all near and mid-term needs identified in previous planning phases and also
any additional needs identified based on new and/or updated information provided by the RIP Working
Group.

The preferred solution(s) that have been identified in this report may be re-evaluated based on the
findings of further analysis. The load forecast and results reported in this RIP report are based on the
information provided and assumptions made by the participants of the RIP Working Group.

Working Group participants, their respective affiliated organizations, and Hydro One Networks Inc.
(collectively, “the Authors”) make no representations or warranties (express, implied, statutory or
otherwise) as to the RIP report or its contents, including, without limitation, the accuracy or completeness
of the information therein and shall not, under any circumstances whatsoever, be liable to each other, or to
any third party for whom the RIP report was prepared (“the Intended Third Parties”), or to any other third
party reading or receiving the RIP report (“the Other Third Parties”), for any direct, indirect or
consequential loss or damages or for any punitive, incidental or special damages or any loss of profit, loss
of contract, loss of opportunity or loss of goodwill resulting from or in any way related to the reliance on,
acceptance or use of the RIP report or its contents by any person or entity, including, but not limited to,
the aforementioned persons and entities.

                                                                                                           4
London Area – Regional Infrastructure Plan 25 August 2017
[This page is intentionally left blank]
5London Area – Regional Infrastructure Plan 25 August 2017
EXECUTIVE SUMMARY
THIS REGIONAL INFRASTRUCTURE PLAN (“RIP”) WAS PREPARED BY HYDRO
ONE NETWORKS INC. (“HYDRO ONE”) AND THE WORKING GROUP IN
ACCORDANCE WITH THE ONTARIO TRANSMISSION SYSTEM CODE
REQUIREMENTS. IT IDENT IFIES INVESTMENTS IN TRANSMISSION
FACILIT IES, DISTRIBUT ION FACILIT IES, OR BOTH, THAT SHOULD BE
DEVELOPED AND IMPLEMENTED TO MEET THE ELECTRICIT Y
INFRASTRUCTURE NEEDS OF THE LONDON AREA REGION.
The participants of the RIP Working Group included members from the following organizations:
• Hydro One Networks Inc. (Distribution)
• Independent Electricity System Operator
• Entegrus Inc.
• Erie Thames Power Lines Corporation
• London Hydro Inc.
• St. Thomas Energy Inc.
• Tillsonburg Hydro Inc.
• Hydro One Networks Inc. (Transmission)
This RIP is the final phase of the OEB’s mandated regional planning process for the London Area Region
which consists of the Strathroy Sub-Region, Greater London Sub-Region, Woodstock Sub-Region,
Aylmer-Tillsonburg Sub-Region, and the St. Thomas Sub-Region. It follows the completion of the
London Area Region’s Needs Assessment (“NA”) in April 2015, the London Area Region Scoping
Assessment (“SA”) in August 2015, the Strathroy TS Transformer Capacity Local Plan (“LP”) in
September 2016, the Greater London Sub-Region Integrated Regional Resource Plan (“IRRP”) in January
2017, and the Woodstock Sub-Region Restoration Local Plan (“LP”) in May 2017.
This RIP provides a consolidated summary of needs and recommended plans for the entire London Area
Region. Needs which are to be addressed include:
• Load restoration in Woodstock Sub-Region
• Load restoration in Greater London Sub-Region
• Voltage constraints, thermal constrains and delivery point performance in Aylmer-Tillsonburg
Sub-Region
The major infrastructure investments planned for the region over the near and mid-term, as identified in
the regional planning process are given below.
6London Area – Regional Infrastructure Plan 25 August 2017
No. Project I/S Date Estimated Cost 1
Distribution System Upgrades in
1 2023 $1.8-4M ($180/kW)
the Greater London Sub-Region
Wonderland TS Reinvestment:
2 2022 $15-20M
Replace transformer T5
As per the Regional Planning process, the Regional Plan will be reviewed and/or updated at least once
every five years. Should there be a need that emerges due to a change in load forecast or any other reason,
the next regional planning cycle will be started earlier to address the need.
1
Costs presented are preliminary estimate and may change resulting from clarification of scope and through detailed
cost estimating.
7London Area – Regional Infrastructure Plan 25 August 2017
TABLE OF CONTENTS
Disclaimer......................................................................................................................................................................4
Executive Summary .......................................................................................................................................................6
Table of Contents...........................................................................................................................................................8
List of Figures................................................................................................................................................................9
List of Tables .................................................................................................................................................................9
1. Introduction .......................................................................................................................................................... 11
1.1 Scope and Objectives ................................................................................................................................. 12
1.2 Structure..................................................................................................................................................... 13
2. Regional Planning Process ................................................................................................................................... 14
2.1 Overview ................................................................................................................................................... 14
2.2 Regional Planning Process......................................................................................................................... 14
2.3 RIP Methodology....................................................................................................................................... 17
3. Regional Characteristics ....................................................................................................................................... 18
4. Transmission Projects COMPLTED or Currently Underway .............................................................................. 21
5. Forecast And Study Assumptions......................................................................................................................... 23
5.1 Historical Demand ..................................................................................................................................... 23
5.2 Contribution of CDM and DG ................................................................................................................... 23
5.3 Gross and Net Demand Forecast ............................................................................................................... 23
5.4 Other Study Assumptions .......................................................................................................................... 24
6. Adequacy of Facilities .......................................................................................................................................... 25
6.1 Transmission Line Facilities ...................................................................................................................... 25
6.2 Step-Down Transformation Facilities ........................................................................................................ 27
6.3 System Reliability and Load Restoration................................................................................................... 28
6.4 Voltage....................................................................................................................................................... 28
6.5 Customer Delivery Point Performance ...................................................................................................... 29
6.6 End-of-Life Equipment Replacements ...................................................................................................... 31
7. Regional needs & Plans ........................................................................................................................................ 32
7.1 Load Restoration ........................................................................................................................................ 32
7.1.1 Woodstock Sub-Region: Loss of M31W/M32W...................................................................................... 32
7.1.2 Greater London Sub-Region: Loss of W36/W37 or W24L/W43L ............................................................ 33
7.2 Aylmer-Tillsonburg Sub-Region: Voltage/Thermal Constraint & Delivery Point Performance ............... 35
7.2.1 Voltage Constraints ................................................................................................................................... 35
7.2.2 Thermal Constraints................................................................................................................................... 37
7.2.3 Customer Delivery Point Performance ...................................................................................................... 38
7.2.4 Aylmer-Tillsonburg Sub-Region Recommended Plan .............................................................................. 38
7.3 Long Term Regional Plan .......................................................................................................................... 39
8. Conclusion and Next Steps ................................................................................................................................... 40
9. References ............................................................................................................................................................ 42
Appendices .................................................................................................................................................................. 43
Appendix A: Stations in the London Area Region ............................................................................................... 43
Appendix B: Non-Coincident Load Forecast 2016-2025 ..................................................................................... 44
Appendix C: Coincident Load Forecast 2016-2025 ............................................................................................. 47
Appendix D: List of Acronyms ............................................................................................................................ 48
8London Area – Regional Infrastructure Plan 25 August 2017
List of Figures
Figure 1-1 London Area Region ................................................................................................................. 12
Figure 2-1 Regional Planning Process Flowchart ....................................................................................... 16
Figure 2-2 RIP Methodology ...................................................................................................................... 17
Figure 3-1 London Area Region – Supply Areas........................................................................................ 19
Figure 3-2 London Area Region Single Line Diagram............................................................................... 20
Figure 5-1 London Area Region Coincident Net Load Forecast ................................................................ 24
Figure 7-1 Existing Single Line Diagram of Aylmer-Tillsonburg Sub-Region.......................................... 36
Figure 7-2 Single Line Diagram of Aylmer-Tillsonburg Sub-Region After Reconfiguration.................... 37
List of Tables
Table 3-1 Sub-Region Details ..................................................................................................................... 18
Table 6-1 230 kV and 115 kV circuits network in the London Area .......................................................... 26
Table 6-2 Transformation Capacities in the Sub-Regions .......................................................................... 27
Table 6-3 Pre-Contingency Voltage Limits ................................................................................................ 28
Table 6-4 Post-Contingency Voltage Change Limits ................................................................................. 29
Table 7-1 Identified Near-Term Needs in London Region ......................................................................... 32
Table 8-1 Regional Plans – Needs Identified in the Regional Planning Process ........................................ 40
Table 8-2 Regional Plans – Projects, Lead Responsibility, and Planned In-Service Dates ........................ 40
9London Area – Regional Infrastructure Plan 25 August 2017
[This page is intentionally left blank]
10London Area – Regional Infrastructure Plan 25 August 2017
1. INTRODUCTION
THIS REPORT PRESENTS THE REGIONAL INFRASTRUCTURE PLAN
(“R IP”) TO ADDRESS THE ELECTR ICITY NEEDS OF THE LONDON AREA
REGION.
The report was prepared by Hydro One Networks Inc. (“Hydro One”) and documents the results of the
study with input and consultation with Independent Electricity System Operator, Entegrus Inc., Erie
Thames Power Lines Corporation, London Hydro Inc., St. Thomas Energy Inc., Tillsonburg Hydro Inc.,
and Hydro One Networks Inc. (Distribution) in accordance with the Regional Planning process
established by the Ontario Energy Board (“OEB”) in 2013.
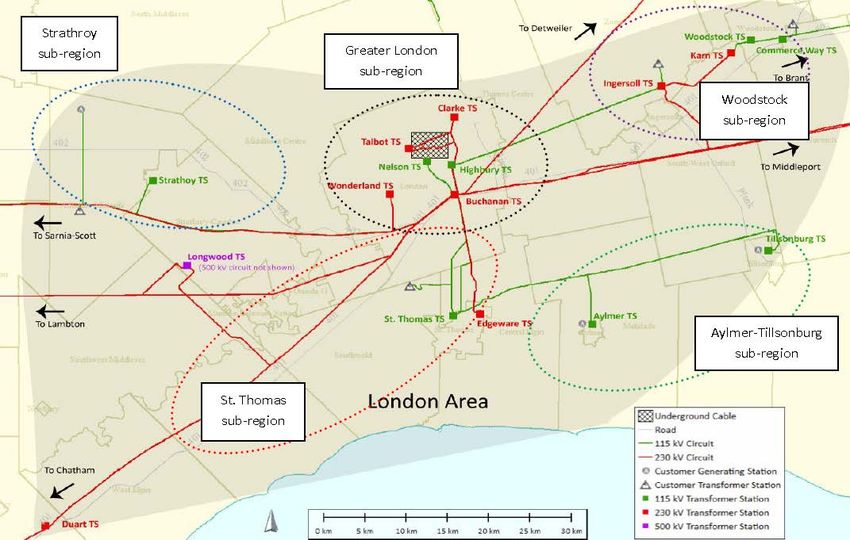
The London Area is located in South Western Ontario and includes all or part of the following Counties,
and Cities: Oxford County, Middlesex County, Elgin County, Norfolk County, the City of Woodstock,
the City of London, and the City of St. Thomas. For electricity planning purposes, the planning region is
defined by electricity infrastructure boundaries, not municipal boundaries.
The region also includes the following First Nations: Chippewas of the Thames, Oneida Nation of the
Thames, and Munsee-Delaware Nation.
Electrical supply to the London Area is provided through a network of 230 kV and 115 kV circuits
supplied by 500/230 kV autotransformers at Longwood Transformer Station (TS) and 230/115 kV
autotransformers at Buchanan TS and Karn TS. There are fifteen Hydro One step-down TS’s, four direct
transmission connected load customers and three transmission connected generators in the London Area.
The distribution system consists of voltage levels 27.6 kV and 4.16kV.The boundaries of the Region are
shown in Figure 1-1 below.
Within the current regional planning cycle, four regional assessments have been conducted for the
London Area Region. The findings of these studies are an input to the RIP and the studies are as follows:
1. IESO’s Greater London Sub-Region Integrated Regional Resource Plan – January, 2017
2. Hydro One’s Woodstock Sub-Region Restoration Local Plan - May, 2017
3. Hydro One’s Strathroy TS Transformer Capacity Local Plan – September, 2016
4. Hydro One’s London Area Region Needs Assessment Report – April, 2015
11London Area – Regional Infrastructure Plan 25 August 2017
Figure 1-1 London Area Region
1.1 Scope and Objectives
This RIP report examines the needs in the London Area Region and its objectives are to:
• Confirm supply needs identified in previous planning phases;
• Identify new supply needs that may have emerged since previous planning phases (e.g., Needs
Assessment, Scoping Assessment, Local Plan, and/or Integrated Regional Resource Plan);
• Assess and develop wires plans to address these needs;
• Provide the status of wires planning currently underway or completed for specific needs;
• Identify investments in transmission and distribution facilities or both that should be developed
and implemented on a coordinated basis to meet the electricity infrastructure needs within the
region.
The RIP reviews factors such as the load forecast, transmission and distribution system capability along
with any updates with respect to local plans, conservation and demand management (“CDM”), renewable
and non-renewable generation development, and other electricity system and local drivers that may
impact the need and alternatives under consideration.
12London Area – Regional Infrastructure Plan 25 August 2017
The scope of this RIP is as follows:
• A consolidated report of the needs and relevant plans to address near and mid-term needs (2016-
2025) identified in previous planning phases (Needs Assessment, Scoping Assessment, Local
Plan or Integrated Regional Resource Plan);
• Identification of any new needs over the 2016-2025 period and a wires plan to address them;
• Consideration of long-term needs identified in the Greater London Sub-Region IRRP
As per the Regional Planning process, the Regional Plan for the region will be reviewed and/or updated at
least every five years. Should there be a need that emerges due to a change in load forecast or any other
reason, the next regional planning cycle will be started earlier to address the need.
1.2 Structure
The rest of the report is organized as follows:
• Section 2 provides an overview of the regional planning process
• Section 3 describes the regional characteristics
• Section 4 describes major High Voltage transmission work completed over the last ten years
• Section 5 describes the load forecast and study assumptions used in this assessment
• Section 6 describes the results of the adequacy assessment of the transmission facilities and
identifies the regional needs
• Section 7 describes the needs and provides the alternatives and preferred solutions
• Section 8 provides the conclusion and next steps
13London Area – Regional Infrastructure Plan 25 August 2017
2. REGIONAL PLANNING PROCESS
2.1 Overview
Planning for the electricity system in Ontario is performed at essentially three levels: bulk system
planning, regional system planning, and distribution system planning. These levels differ in the facilities
that are considered and the scope of impact on the electricity system. Planning at the bulk system level
typically looks at issues that impact the system on a provincial level, while planning at the regional and
distribution levels looks at issues on a more regional or localized level.
Regional planning evaluates supply and reliability issues at a regional or local area level. Therefore,
it largely considers the 115kV and 230kV portions of the power system that supply various parts of
the province.
2.2 Regional Planning Process
A structured regional planning process was established by the Ontario Energy Board (“OEB”) in 2013
through amendments to the Transmission System Code (“TSC”) and Distribution System Code (“DSC”).
The process consists of four phases: the Needs Assessment 2 (“NA”), the Scoping Assessment (“SA”), the
Integrated Regional Resource Plan (“IRRP”), and the Regional Infrastructure Plan (“RIP”).
The regional planning process begins with the NA phase, which is led by the transmitter to determine if
there are regional needs. The NA phase identifies the needs and the Working Group determines whether
further regional coordination is necessary to address them. If no further regional coordination is required,
and needs are local in nature, an assessment is undertaken for any necessary investments directly by the
LDCs (or customers) and the transmitter through a Local Plan (“LP”). These needs are local in nature and
can be best addressed by a straight forward wires solution. The Working Group recommends a LP
undertaking when needs are a) local in nature b) limited to investments in wires (transmission or
distribution) solutions c) do not require upstream transmission investments d) do not require plan level
stakeholder engagement and e) do not require other approvals such as Leave to Construct (S92) approval
or Environmental Approval.
In situations where identified needs require coordination at the regional or sub-regional levels, the IESO
initiates the SA phase. During this phase, the IESO, in collaboration with the transmitter and impacted
LDCs, reviews the information collected as part of the NA phase, along with additional information on
potential non-wires alternatives, and makes a decision on the most appropriate regional planning
approach. If there are needs that do not require regional coordination, the Working Group can recommend
them to be undertaken as part of the LP approach discussed above. Otherwise, the approach is to complete
either a RIP, which is led by the transmitter, or an IRRP, which is led by the IESO. If more than one sub-
2
Also referred to as Needs Screening.
14London Area – Regional Infrastructure Plan 25 August 2017
region was identified in the NA phase, it is possible that a different approach could be taken for different
sub-regions.
The IRRP phase will generally assess infrastructure (wires) versus resource (CDM and Distributed
Generation) options at a higher or more macro level, but sufficient to permit a comparison of options. If
the IRRP phase identifies that infrastructure options may be most appropriate to meet a need, the RIP
phase will conduct detailed planning to identify and assess the specific wires alternatives and recommend
a preferred wires solution. Similarly, resource options that the IRRP identifies as best suited to meet a
need are then further planned in greater detail by the IESO. The IRRP phase also includes IESO led
stakeholder engagement with municipalities and establishes a Local Advisory Committee (“LAC”) in the
region or sub-region.
The RIP phase is the final stage of the regional planning process and involves: confirmation of previously
identified needs; identification of any new needs that may have emerged since the start of the planning
cycle; and development of a wires plan to address the needs where a wires solution would be the best
overall approach. This phase is led and coordinated by the transmitter and the deliverable of this stage is a
comprehensive report of a wires plan for the region. Once completed, this report can be referenced in rate
filing submissions or as part of LDC rate applications with a planning status letter provided by the
transmitter. Reflecting the timelines provisions of the RIP, plan level stakeholder engagement is not
undertaken at this stage. However, stakeholder engagement at a project specific level will be conducted as
part of the project approval requirement.
To efficiently manage the regional planning process, Hydro One has been undertaking wires planning
activities in collaboration with the IESO and LDCs for the region as part of and/or in parallel with:
• Planning activities that were already underway in the region prior to the new regional planning
process taking effect;
• The NA, SA, and LP phases of regional planning;
• Participating in and conducting wires planning as part of the IRRP for the region or sub-region.
Figure 2-1 illustrates the various phases of the regional planning process (NA, SA, IRRP, and RIP) and
their respective phase trigger, lead, and outcome.
15London Area – Regional Infrastructure Plan 25 August 2017
Figure 2-1 Regional Planning Process Flowchart
16London Area – Regional Infrastructure Plan 25 August 2017
2.3 RIP Methodology
The RIP phase consists of a four step process (see Figure 2-2) as follows:
1. Data Gathering: The first step of the process is the review of planning assessment data collected in the
previous stages of the regional planning process. Hydro One collects the following information and
reviews it with the Working Group to reconfirm or update the information as required:
• Net peak demand forecast at the transformer station level. This includes the effect of any
distributed generation (“DG”) or CDM programs;
• Existing area network and capabilities including any bulk system power flow assumptions;
• Other data and assumptions as applicable such as asset conditions, load transfer capabilities, and
previously committed transmission and distribution system plans.
2. Technical Assessment: The second step is a technical assessment to review the adequacy of the
regional system including any previously identified needs. Additional near and mid-term needs may
be identified at this stage.
3. Alternative Development: The third step is the development of wires options to address the needs and
to come up with a preferred alternative based on an assessment of technical considerations,
feasibility, environmental impact, and costs.
4. Implementation Plan: The fourth and last step is the development of the implementation plan for the
preferred alternative.
Figure 2-2 RIP Methodology
17London Area – Regional Infrastructure Plan 25 August 2017
3. REGIONAL CHARACTERISTICS
THE LONDON AREA IS LOCATED IN SOUTH WESTERN ONTARIO AND INCLUDES ALL OR
PART OF OXFORD COUNTY, MIDDLESEX COUNTY, ELGIN COUNTY, NORFOLK COUNTY,
THE CITY OF WOODSTOCK, THE CITY OF LONDON, AND THE CITY OF ST. THOMAS. THE
REGION ALSO INCLUDES THE FOLLOWING FIRST NATIONS: CHIPPEWAS OF THE THAMES,
ONEIDA NATION OF THE THAMES, AND MUNSEE-DELAWARE NATION. LONDON AREA
REGION IS DIVIDED INTO FIVE SUB-REGIONS: STATHROY SUB-REGION, GREATER
LONDON SUB-REGION, WOODSTOCK SUB-REGION, AYLMER-TILLSONBURG SUB-REGION,
AND THE ST. THOMAS SUB-REGION.
Electrical supply to the London Area Region is provided through a network of 230 kV and 115 kV
circuits supplied by 500/230 kV autotransformers at Longwood Transformer Station (TS) and 230/115 kV
autotransformers at Buchanan TS and Karn TS. There are fifteen Hydro One step-down TS’, four direct
transmission connected load customers and three transmission connected generators. The region is
summer-peaking and has a peak demand of approximately 1,250 MW including direct transmission
connected customers. A map of the London Area Region (highlighting the sub-regions) and a single line
diagram of the transmission system are shown in Figure 3-1 and Figure 3.2.
Table 3-1 Sub-Region Details
Voltage
Sub-Region Station Name (DESN) Supply Circuits Connected Customers
Level (kV)
Strathroy Sub- • Hydro One Distribution
Strathroy TS (T7/T8) 230/27.6 W2S, S2N
Region • Entegrus
Longwood TS (T13/T14) 230/27.6 L24L, L26L • Hydro One Distribution
Greater London Talbot TS (T1/T2, T3/T4) 230/27.6 W36, W37 • London Hydro
Sub-Region • Hydro One Distribution
Clark TS (T3/T4) 230/27.6 W36, W37
Wonderland TS (T5/T6) 230/27.6 N21W, N22W
Buchanan TS (T13/T14) 230/27.6 W42L, W43L
Nelson TS (T1/T2) 115/13.8 W5N, W6NL
Highbury TS (T3/T4) 115/27.6 W6NL, W9L
Woodstock Sub- Ingersoll TS (T5/T6) 230/27.6 M31W, M32W • Hydro One Distribution
Region • Erie Thames Powerlines
Woodstock TS (T1/T2) 115/27.6 K7, K12
Commerceway TS (T1/T2) 115/27.6 K7, K12
Aylmer Sub- Aylmer TS (T2/T3) 115/27.6 WT1A, W8T, T11T • Hydro One Distribution,
Region • Erie Thames Powerlines
Tillsonburg TS (T1/T3) 115/27.6 WT1T, W8T, T11T • Tillsonburg Hydro
Station is planned for
St.Thomas Sub-
St. Thomas TS 115/27.6kV W3T, W4T, T11T decommissioning, no remaining
Region
customers connected.
• Hydro One Distribution
Edgeware TS 230/27.6kV W45LS, W44LC • St. Thomas Energy
• London Hydro
18London Area – Regional Infrastructure Plan 25 August 2017
Figure 3-1 London Area Region – Supply Areas
19London Area – Regional Infrastructure Plan 25 August 2017
Figure 3-2 London Area Region Single Line Diagram
20London Area – Regional Infrastructure Plan 25 August 2017
4. TRANSMISSION PROJECTS COMPLETED OR
CURRENTLY UNDERWAY
OVER THE LAST 10 YEARS A NUMBER OF TRANSMISSION PROJECTS HAVE
BEEN PLANNED AND COMPLETED BY HYDRO ONE, OR ARE UNDERWAY,
AIMED AT IMPROVING THE SUPPLY TO THE LONDON AREA REGION.
A brief listing of the major projects completed over the last 10 years is given below:
• Talbot TS Expansion (2007) – Expansion of the existing Talbot TS and construction of a second
50/83 MVA 230/27.6 kV transformer station to alleviate load from existing transformer stations
in the area, which were loaded beyond its capacity and provide additional capacity for the load
growth in the London area.
• Highbury TS Transformer Replacement (2009) – Like-for-like replacement of 50/83 MVA
115/27.6 kV transformer T4 that was over 60 years old and nearing end-of-life.
• Commerce Way TS (2010) – Construction of a new 50/83 MVA 115/27.6 kV Commerce Way
transformer station to alleviate load from Woodstock TS, which was loaded beyond its capacity
and provide additional capacity for the load growth in the Woodstock area.
• Strathroy TS Transformer Replacement (2012) – Like-for-like replacement of 25/42 MVA
115/27.6 kV transformer T2 due to failure.
• Ingersoll TS Transformer Replacement (2012) – Like-for-like replacement of 75/125 MVA
230/27.6 kV transformers T5 & T6 that were approximately 35 years old. The transformers were
identified to have a design weakness and were replaced to mitigate the risk of failures, improve
restoration time and maintain system performance.
• Woodstock TS Transformer Replacement (2014) – Like-for-like replacement of 50/83 MVA
115/27.6 kV transformers T1 & T2 that were approximately 50 years old and were nearing end-
of-life.
The following development projects are expected to be placed in-service within the next 10 years:
1. Aylmer TS: is located in Southwestern Ontario and is comprised of two 11/15 MVA, 110-28 kV
transformers (T2 & T3) and two 27.6 kV feeder breaker positions M1, M2. The station is
supplied by a single 115kV line WT1A and it supplies Erie Thames Powerlines Corp. and Hydro
One Distribution at 27.6 kV.
The deteriorating asset condition of a significant portion of station equipment, including
transformers (T2 & T3) and LV switchyard, qualifies it as a candidate for a complete station
rebuild. To address the urgent need, the existing station will be replaced with a new DESN with
two 25/33/42 MVA transformers. The replacement work also includes all 28kV LV switching
facilities, the addition of two new feeder positions, and an upgrade to associated protection and
control systems.
This project is currently under execution and planned to be completed before end of 2017.
21London Area – Regional Infrastructure Plan 25 August 2017
2. Strathroy TS: is located in Middlesex County in Southwestern Ontario and is comprised of two
25/33/42 MVA 110-28 kV transformers (T1 & T2) and four 27.6 kV feeder breaker positions.
Strathroy TS supplies Entegrus Powerlines Inc. and Hydro One Distribution at 27.6 kV.
Due to deteriorating asset condition, Hydro One has planned to replace the T1 transformer with
similar type 42MVA transformer, replace all LV switching facilities, and upgrade associated
protection and control facilities and AC/DC station ancillary infrastructure.
This project is currently under execution and planned to be completed in 2017.
3. Nelson TS: is located in the City of London in Southwestern Ontario and is comprised of two
DESN stations (the “T1/T2 DESN” and the “T3/T4 DESN”) which are both supplied from the
115 kV circuits W5N and W6NL. The T1/T2 DESN consists of two 18/27/33 MVA, 115/ 13.8
kV transformers with two LV yards (outdoor and indoor), and the T3/T4 DESN consists of two
60/80/100 MVA, 115/ 13.8 kV transformers with two LV yards (both indoor). The T1/T2 DESN
supplies about 17 MW of 13.8kV load in the London downtown area and the T3/T4 DESN
supplies approximately 31 MW of 13.8 kV load, also in the London downtown area.
The deteriorating asset condition of a significant portion of station equipment, including
transformers (T1 & T2) and LV switchyard, qualifies it as a candidate for a complete station
rebuild. In addition, London Hydro has requested that Hydro One rebuild the LV at 27.6kV
rather than at 13.8kV so that the station can be integrated into London Hydro's 27.6kV
distribution system to provide load support. As a result, Hydro one is building a new station
within the existing Nelson TS yard. The new station will consist of two new 115/27.6 kV, 50/83
MVA DESNs and new LV switchyard with 8 feeder positions and 2 capacitor bank positions. All
associated protection and control systems and station ancillary infrastructure will be upgraded.
The work will also involve decommissioning of the existing DESN substation consisting of T1
and T2 transformers and the 13.8kV air insulated outdoor switchyard.
This project is currently under execution and planned to be completed in 2018.
22London Area – Regional Infrastructure Plan 25 August 2017
5. FORECAST AND STUDY ASSUMPTIONS
THE FORECASTS REFLECT THE EXPECTED PEAK DEMAND AT EACH STATION UNDER
EXTREME WEATHER CONDITIONS, BASED ON FACTORS SUCH AS POPULATION,
HOUSEHOLD AND ECONOMIC GROWTH, CONSISTENT WITH MUNICIPAL PLANNING
ASSUMPTIONS.
5.1 Historical Demand
The London Area regional peak load has been relatively constant over the past 5 years (approximate
decline of -0.4%).
5.2 Contribution of CDM and DG
In developing the planning forecast, the following process was used to assess the London Region:
• First, “gross demand” is established. Gross demand reflects the forecast developed and provided
by the area LDCs and is influenced by a number of factors such as economic, household and
population growth.
• Second, “net demand” is derived by reducing the gross demand by expected savings from
improved building codes and equipment standards, customer response to time-of-use pricing,
projected province-wide CDM programs, committed and forecast DG . This information is
provided by the IESO.
5.3 Gross and Net Demand Forecast
Prior to the RIP’s kick-off, the Working Group was asked to confirm the load forecasts for all stations in
the Region provided for previous assessments. The RIP’s load forecast was updated according the revised
load forecasts provided by the LDCs.
The load in the London Area Region including CDM targets and DG contributions is expected to remain
relatively constant over the study period (approximate growth rate of -0.3%). The growth rate varies
across the region but an overall coincident net load forecast in the region is illustrated in Figure 5-1. The
gross and net non-coincident and coincident load forecast, adjusted for extreme weather, CDM, and DG,
for each station in the region are provided in Appendix B and C.
23London Area – Regional Infrastructure Plan 25 August 2017
Regional Load Growth
1200
1150
1100
Load (MW)
1050
1000
950
900
2015 2016 2017 2018 2019 2020 2021 2022 2023
Figure 5-1 London Area Region Coincident Net Load Forecast
5.4 Other Study Assumptions
Further assumptions are as follows:
• The study period for the RIP assessment is 2016 – 2023.
• Summer is the critical period with respect to line and transformer loadings. The assessment is
therefore based on extreme summer peak loads.
• Station capacity adequacy is assessed by comparing the peak load with the station’s normal
planning supply capacity assuming a 90% lagging power factor for stations having no low-
voltage capacitor banks and 95% lagging power factor for stations having low-voltage capacitor
banks. Normal planning supply capacity for transformer stations in this region is determined by
the summer 10-Day Limited Time Rating (“LTR”).
24London Area – Regional Infrastructure Plan 25 August 2017
6. ADEQUACY OF FACILITIES
THIS SECTION REVIEWS THE ADEQUACY OF THE EXISTING
TRANSMISS ION AND STEP DOWN TRANSFORMATION STATION
FACILITIES SUPP LYING THE LONDON AREA REGION AND LISTS THE
FACILITIES REQUIRING REINFORCEMENT OVER THE NEAR AND M ID-
TERM PER IOD.
Within the current regional planning cycle, four regional assessments have been conducted for the
London Area Region. The findings of these studies are an input to the RIP and the studies are as follows:
[1]
1. IESO’s Greater London Sub-Region Integrated Regional Resource Plan – January, 2017
[2]
2. Hydro One’s Woodstock Sub-Region Restoration Local Plan - May, 2017
[3]
3. Hydro One’s Strathroy TS Transformer Capacity Local Plan – September, 2016
[4]
4. Hydro One’s London Area Region Needs Assessment Report – April, 2015
The IRRP, NA, and LP studies identified a number of regional needs based on the forecast load demand
over the near to mid-term. Based on the regional growth rate referred to in Section 5, this RIP reviewed
the loading on transmission lines and stations in the London Area Region assuming the new Nelson TS
DESN will be in-service by the end of 2018, and the new Aylmer TS DESN will be in-service by the end
of 2017. Further detailed description and status of plans to meet these needs is provided in Section 7.
6.1 Transmission Line Facilities
Electrical supply to the London Area is provided through a network of 230 kV and 115 kV circuits
supplied by 500/230 kV autotransformers at Longwood Transformer Station (TS) and 230/115 kV
autotransformers at Buchanan TS and Karn TS. The main features of the electrical supply system in the
London Area are as follows:
• Longwood TS is the major transmission station that connects the 500kV network to the 230kV
system via two 500/230 kV autotransformers.
• Buchanan TS and Karn TS are the transmission stations that connect the 230kV network to the
115kV system via 230/115 kV autotransformers.
• Fifteen step-down transformer stations supply the London Area load: Aylmer TS, Buchanan TS,
Clarke TS, Commerceway TS, Edgeware TS, Highbury TS, Ingersoll TS, Longwood TS, Nelson
TS, Strathroy TS, St. Thomas TS, Talbot TS, Tillsonburg TS, Wonderland TS, and Woodstock
TS.
• Four Customer Transformer Stations (CTS) are supplied in the London Area: Ford Talbotville
CTS, Enbridge Keyser CTS, Lafarge Woodstock CTS, and Toyota Woodstock CTS.
• There are 3 existing transmission connected generating stations in the London Area as follows:
25London Area – Regional Infrastructure Plan 25 August 2017
o Suncor Adelaide GS is a 40 MW wind farm connected to 115 kV circuit west of
Strathroy TS
o Erie Shores Wind Farm GS is a 99 MW wind farm connected to 115kV circuit near
Tillsonburg TS
o Silver Creek GS is a 10 MW solar generator connected to 115kV circuit near Aylmer TS
The 500kV system is part of the bulk system planning conducted by the IESO and is not studied as
part of this RIP
Table 6-1 provides 230 kV and 115 kV circuit network that supplies to the London Area.
Table 6-1 230 kV and 115 kV circuits network in the London Area
Voltage Circuit Designations Location
230 kV N21W, N22W Scott TS to Buchanan TS
W42L, W43L Longwood TS to Buchanan TS
W44LC Longwood TS to Chatham TS to Buchanan TS
W45LS Longwood TS to Spence SS to Buchanan TS
W36, W37 Buchanan TS to Talbot TS
D4W, D5W Buchanan TS to Detweiler TS
M31W, M32W Buchanan TS to Ingersoll TS to Middleport TS
M33W Buchanan TS to Brantford TS
115 kV W2S Buchanan TS to Strathroy TS
W5N Buchanan TS to Nelson TS
W6NL Buchanan TS to Highbury TS to Nelson TS
W9L Buchanan TS to Highbury TS
W7, W12 Buchanan TS to CTS
WW1C Buchanan TS to CTS
W8T Buchanan TS to Cranberry JCT
T11T
WT1T Erie Shore Wind Farm JCT to Tillsonburg TS
W3T, W4T Buchanan TS to St. Thomas TS
WT1A Aylmer TS to Lyons JCT
K7, K12 Karn TS to Commerce Way TS
The 115 kV circuit W8T from Buchanan TS to Edgeware JCT exceeds its planning rating under pre-
contingency conditions in the near term based on the gross load forecast. Such thermal overload is
deferred to the medium term based on the net load forecast. The transmission line constraint is further
described in section 7.2.2 of this report. The remaining 115 kV and 230 kV circuits supplying the
London Area are adequate over the study period for the loss of a single element in the area.
26London Area – Regional Infrastructure Plan 25 August 2017
6.2 Step-Down Transformation Facilities
There are a total of fifteen step-down transmission connected transformer stations in the London Area
Region. The stations have been grouped based on the geographical area and supply configuration. The
station loading and the associated station capacity and the need date in each sub-region is provided in
Table 6-3 below. The findings of the transformation capacity assessment are as follows:
• As confirmed in the “Strathroy TS Transformer Capacity Local Plan (LP)”, based on the limited
time rating (“LTR”) of the station, the transformation capacity is adequate in Strathroy Sub-Region
over the study period.
• As confirmed in the “Greater London Sub-Region Integrated Regional Resource Plan (IRRP)”,
based on the LTR of the stations, the transformation capacity is adequate in Greater London Sub-
Region over the study period.
• Based on the LTR of the load stations, the transformation capacity is adequate in Woodstock Sub-
Region, Aylmer-Tillsonburg Sub-Region and the St. Thomas Sub-Region over the study period.
Table 6-2 Transformation Capacities in the Sub-Regions
Sub-Region Station LTR (MW) 2015 Non Coincident Peak (MW) Need Date
Strathroy Sub-Region Strathroy TS 50 45 -3
Longwood TS 128 33 -3
Greater London Sub- Talbot TS 290 268 -3
Region
Clark TS 110 106 -3
Wonderland TS 99 109 4 -3
Buchanan TS 183 143 -3
Nelson TS 105 5 23 -3
Highbury TS 114 93 -3
Ingersoll TS 167 75 -3
Woodstock Sub-
Region Woodstock TS 87 56 -3
Commerceway TS 112 33 -3
Aylmer Sub-Region Aylmer TS 55 6 21 -3
Tillsonburg TS 109 88 -3
St.Thomas Sub-Region St.Thomas TS 50 0 -3
Edgeware TS 191 113 -3
3
Adequate over the study period
4
Peak loading at Wonderland TS is forecasted to reduce to within its 10-day LTR rating by 2017
5
Nelson TS LTR reflects the Station Rebuild Project under execution - planned to be completed in 2018
6
Aylmer TS LTR reflects the Transformer Replacement Project under execution - planned to be completed in 2017
27London Area – Regional Infrastructure Plan 25 August 2017
The non-coincident and coincident load forecast for all stations in the Region is given in Appendix C and
Appendix D, respectively.
6.3 System Reliability and Load Restoration
In case of incidents on the transmission system, ORTAC provides the load restoration requirements
relative to the amount of load affected. Planned system configuration must not exceed 600 MW of load
curtailment/rejection. In all other cases, the following restoration times are provided for load to be
restored for the outages caused by design contingencies.
• All loads must be restored within 8 hours.
• Load interrupted in excess of 150 MW must be restored within 4 hours.
• Load interrupted in excess of 250 MW must be restored within 30 minutes.
In the London Area Region it is expected that all loads can be restored within the ORTAC load
restoration requirements with exception of:
• Loss of M31W/M32W – Woodstock Sub-Region
• Loss of W36/W37 or W42L/W43L – Greater London Sub-Region
The load restoration constraints are further described in section 7.1 of this report.
6.4 Voltage
Under pre-contingency conditions with all facilities in service, ORTAC provides requirements for
acceptable system voltages. The table below indicates the maximum and minimum voltages generally
applicable. These values are obtained from Chapter 4 of the IESO “Market Rules” and CSA standards for
distribution voltages below 50 kV.
Table 6-3 Pre-Contingency Voltage Limits
Nominal Bus Voltage (kV) 500 230 115 Transformer Station Low
Voltage Bus
Maximum Continuous (kV) 550 250 127* 106%
Minimum Continuous (kV) 490 220 113 98%
*Certain buses can be assigned specific maximum and minimum voltages as required for operations. In
northern Ontario, the maximum continuous voltage for the 115 kV system can be as high as 132 kV.
With all planned facilities in service pre-contingency, ORTAC provides requirements for system voltage
changes in the period immediately following a contingency as indicated in Table 6-4.
28London Area – Regional Infrastructure Plan 25 August 2017
Table 6-4 Post-Contingency Voltage Change Limits
Transformer Station
Nominal Bus Voltage (kV) 500 230 115 Low Voltage Bus
44 27.6 13.8
% voltage change before tap changer 10% 10% 10% 10%
action
% voltage change after tap changer 10% 10% 10% 5%
action
AND within the range
Maximum* (kV) 550 250 127 112% of nominal
Minimum* (kV) 470 207 108 88% of nominal
*The maximum and minimum voltage ranges are applicable following a contingency. After the system is
re-dispatched and generation and power flows are adjusted the system must return to within the maximum
and minimum continuous voltages.
The Aylmer-Tillsonburg Sub-Region is normally supplied by a single 115 kV transmission circuit W8T
which is approximately 60 km in length. The Sub-Region has a total peak demand of 106 MW and is
expected to grow to 122 MW by year 2023. During planned or forced outages the interrupted load in the
Sub-Region can be transferred to the backup 115 kV circuit T11T.
Under pre-contingency conditions and with Erie Shores Wind Farm unavailable, the voltage at
Tillsonburg TS 115 kV bus does not meet ORTAC criteria (113 kV) under existing peak load conditions
and may reach as low as 100 kV. The transformer ULTCs at Tillsonburg TS is however maintaining the
LV bus voltage above ORTAC criteria of 27 kV (98% of nominal voltage). Study results indicate that the
LV voltage cannot be maintained at desirable levels when the load in the Aylmer-Tillsonburg Sub-Region
exceeds 115 MW. Based on the latest load forecasts, this loading level may be reached as early as 2019.
The voltage constraint is further described in section 7.2.1 of this report.
6.5 Customer Delivery Point Performance
In accordance with Section 2.5 of the Transmission System Code, Hydro One Networks Inc. (Networks)
is required to develop performance standards at the customer delivery point level, consistent with system
wide standards that reflect:
• typical transmission-system configurations that take into account the historical development of
the transmission system at the customer delivery point level;
• historical performance at the customer delivery point level;
• acceptable bands of performance at the customer delivery point level for the transmission system
configurations; geographic area, load, and capacity levels; and
29London Area – Regional Infrastructure Plan 25 August 2017
• defined triggers that would initiate technical and financial evaluations by the transmitter and its
customers regarding performance standards at the customer delivery point level, exemptions from
such standards, and study triggers and results.
The Customer Delivery Point Performance Standards and triggers are based on the size of load being
served (as measured in megawatts by a delivery point’s total average station load) are provided in Table
6-4 below.
Table 6-4 Customer Delivery Point Performance Standards
Delivery Point Performance Standards
(Based on a Delivery Point’s Total Average Station Load)
0-15 MW 15-40 MW 40-80 MW >80 MW
Performance
Standard Minimum Standard Minimum Standard Minimum Standard Minimum
Measure
(Average Standard of (Average Standard of (Average Standard of (Average Standard of
Performance) Performance Performance) Performance Performance) Performance Performance) Performance
DP Frequency
of
4.1 9.0 1.1 3.5 0.5 1.5 0.3 1.0
Interruptions
(Outages/year)
DP
Interruption
89 360 22 140 11 55 5 25
Duration
(min/year)
The minimum standards of performance are to be used as triggers by Networks to initiate technical and
financial evaluations with affected customers. These bands are to:
• accommodate normal year-to-year delivery point performance variations;
• limit the number of delivery points that are to be considered “performance outliers” to a
manageable/affordable level;
• deliver a level of reliability that is commensurate with customer value i.e. the larger the load, the
greater the level of reliability provided; and
• direct/focus efforts for reliability improvements at the “worst” performing delivery points.
The customer delivery points serving THI and HONI distribution at Tillsonburg TS is not meeting
CDPPS requirements with regards to frequency of interruptions. This customer delivery point has
averaged approximately 3.3 interruptions per year over the past 10 years, doubling the performance target
of 1.5.
The Customer Delivery Point Performance need is further described in section 7.2.3 of this report.
30London Area – Regional Infrastructure Plan 25 August 2017
6.6 End-of-Life Equipment Replacements
Recent condition assessment of Wonderland TS has revealed that one of the existing power transformers
at the station (T5) is in poor condition and must be replaced in the near-term. The facility was originally
built in the 1960s and its assets are degrading in condition and require replacement by 2022. The existing
230/28kV T6 power transformer was replaced in 2004 due to failure. The existing 230/28 kV T5 power
transformer will be replaced with a similar unit (230kV-28kV 83 MVA) to match the ratings of
transformer T6. After the transformer replacement is completed, the LTR of Wonderland TS is expected
to increase to approximately 114MW.
31London Area – Regional Infrastructure Plan 25 August 2017
7. REGIONAL NEEDS & PLANS
THIS SECTION DISCUSSES THE ELECTRICAL INFRASTRUCTURE NEEDS, POSSIBLE
WIRES ALTERNATIVES AND SUMMARIZES THE CURRENT PREFERRED WIRES
SOLUTION FOR ADDRESSING THE ELECTRICAL SUPPLY NEEDS IN THE LONDON
AREA REGION
The needs listed in Table 7-1 include needs previously identified in the IRRP for the Greater London Sub-
Region and the NA and LP’s for the Strathroy, Woodstock, Aylmer-Tillsonburg and St. Thomas Sub-
Regions.
The near-term needs include needs that arise over the first five years of the study period (2016 to 2020)
and the mid-term needs cover the second half of the study period (2021-2025).
Table 7-1 Identified Near-Term Needs in London Region
Sub-Region Type Section Needs Timing
Woodstock Sub- No action required
7.1.1 Loss of M31W/M32W
Region at this time
Load Restoration
Greater London Sub- Loss of W36/W37 or
7.1.2 Now
Region W42L/W43L
Voltage at Tillsonburg TS below
Voltage Constraint 7.2.1 Now
ORTAC criteria
Aylmer-Tillsonburg Thermal constraint on 115kV line
Sub-Region Thermal Constraint 7.2.2 Now
W8T
Delivery Point Poor delivery point performance
7.2.3 Now
Performance at Tillsonburg TS
7.1 Load Restoration
7.1.1 Woodstock Sub-Region: Loss of M31W/M32W
Description
The Woodstock Sub-Region load restoration need was identified in the NA and LP reports and further
assessment was recommended to address the supply shortfall during peak load periods. Previous
assessments indicated that in case of loss of two transmission elements (M31W/M32W), the load
interrupted with current circuit configuration during peak periods may exceed load restoration criteria.
32London Area – Regional Infrastructure Plan 25 August 2017
Recommended Plan and Current Status
A local planning report 7 was completed to develop a plan to address the load restoration need identified in
the Sub-Region. The report concluded the following:
For Woodstock Sub-Region, the critical line section is M31W/M32W tap between Salford Junction and
Ingersoll Junction. Should a contingency on this line section occur, all of the sub-region’s load, which
amounted to 188 MW in 2016, would be interrupted by configuration.
Under such emergency conditions, depending on system performance and availability of switching
facilities, all or a portion of a load station could be restored by transferring load to neighbouring
unaffected supply. Hydro One Distribution estimated that 10 MW of load at Ingersoll TS could be
transferred to Highbury TS. Another 8 MW could be transferred from Commerce Way TS to Tillsonburg
TS on the feeder level. On the transmission side, the supply from Brant TS will be able to restore about
20 MW of load in the Woodstock Sub-Region.
These measures can be deployed remotely to manage and mitigate the impact of the loss of two
transmission elements within the 4 hours timeframe. To restore the remaining 150 MW of interrupted
load within 8 hours, field crews from the nearest staffed centre in London Area will be dispatched to
install temporary fixes on the transmission system such as building an emergency by-pass.
The Working Group is recommending that no further action is required at this time.
7.1.2 Greater London Sub-Region: Loss of W36/W37 or W24L/W43L
The Greater London Sub-Region load restoration need was identified in the NA and IRRP reports and
further assessment was recommended to address the supply shortfall during peak load periods. Previous
assessments indicated that for the loss of two transmission elements (W36/W37 or W42L/W43L), the
load interrupted with the current circuit configuration during peak periods may exceed load restoration
criteria.
W36/W37 – Clarke TS and Talbot TS
Description
Clarke TS and Talbot TS are supplied by 230 kV transmission circuits W36/W37 and have a total peak
demand of 370 MW. Following the loss of both W36 and W37, supply to Clarke TS and Talbot TS
would be interrupted.
7
Woodstock Restoration Local Planning Report – May 30, 2017
33London Area – Regional Infrastructure Plan 25 August 2017
Under such emergency conditions, London Hydro can currently restore up to 55 MW of interrupted load
through distribution system transfers within 30 minutes and up to 105 MW within four hours. The
interrupted load would be transferred to Wonderland TS, Buchanan TS and Highbury TS during such
events. As part of the rebuild of Nelson TS in 2018, the station’s LV bus will be converted from 13.8 kV
to 27.6 kV. After the conversion, Nelson TS will be able to provide additional backup capacity to support
meeting the ORTAC timelines in the event of a double circuit outage. With the new 27.6 kV Nelson TS,
a total of 95 MW of load can be restored within 30 minutes, and 150 MW of load within four hours. This
reduces the 30 minute shortfall to 25 MW and the four hour shortfall to 71 MW in 2019.
Recommended Plan and Current Status
The Greater London Sub-Region IRRP 8 developed a plan to address the load restoration need identified
in the Sub-Region. The report concluded the following:
Currently, London Hydro has 28 distribution feeders in total that emanate from Clarke TS and Talbot TS.
Only half of these feeders are presently interconnected to other non-Clarke and non-Talbot feeders (i.e.,
Highbury, Buchanan, and Wonderland TS feeders). Installing approximately 10 additional automated
switching devices in strategic locations on the distribution feeders could provide an additional 25 MW of
load transfer capability within 30 minutes for Clarke TS and Talbot TS load. These switching devices are
estimated to cost approximately $0.6 million.
An additional 10-15 MW of load restoration support for longer-term relief (more than 30 minutes) could
be provided by extending the 14 existing Clarke and Talbot feeders to connect with feeders from non-
connected neighboring stations. For example, a 3.7 km Talbot feeder line extension to connect to a
Wonderland feeder at an approximate cost of $1.2 million could provide support to 10-15 MW of load for
the Clarke TS and Talbot TS load pockets.
For a unit cost of $180/kW, the Working Group is recommending the implementation of automated
switching devices and feeder extensions on the Distribution System as the most cost effective method to
substantially mitigate the restoration shortfall in this area.
These solutions would also maximize the use of existing distribution infrastructure and provide flexibility
to London Hydro to manage load between different stations in its service territory.
It is important to note that the feeder capacity margins are not static and will reduce as the 20-year
projected load growth at the transformer stations materializes. Hence, the amount of load that can be
restored using the distribution system in the event of a double element loss of supply to Clarke TS and
Talbot TS will reduce over time. Consequently, part of the recommendation is that London Hydro
continues to monitor load growth and relevant feeder limits in its service territory. The Working Group
recommends the actions described below to meet the restoration need identified for the Greater London
8
Greater London Sub-Region, Integrated Regional Resource Plan – January 20, 2017
34You can also read