Grea REGIO ater B - Hydro One
←
→
Page content transcription
If your browser does not render page correctly, please read the page content below
Grea
   ater Bruce
        B e - Hu
               uron
REGIO
    ONAL
       L INFR
            RASTR
                RUCTU
                    U RE PLAN

August 18,
       1 2017
Greater Bruce-Huron - Regional Infrastructure Plan                                August 18, 2017

                                        [This page is intentionally left blank]

                                                                                               2
Greater Bruce-Huron - Regional Infrastructure Plan August 18, 2017
Prepared and supported by:
Company
Hydro One Networks Inc. (Lead Transmitter)
Entegrus Power Lines Inc.
Erie Thames Powerlines Corporation
Festival Hydro Inc.
Goderich Hydro - West Coast Huron Energy Inc.
Hydro One Networks Inc. (Distribution)
Independent Electricity System Operator
Wellington North Power Inc.
Westario Power Inc.
3Greater Bruce-Huron - Regional Infrastructure Plan August 18, 2017
[This page is intentionally left blank]
4Greater Bruce-Huron - Regional Infrastructure Plan August 18, 2017
Disclaimer
This Regional Infrastructure Plan (“RIP”) report was prepared for the purpose of developing an electricity
infrastructure plan to address all near and mid-term needs (2016-2025) identified in previous planning
phases and any additional needs identified based on new and/or updated information provided by the RIP
Working Group.
The preferred solution(s) that have been identified in this report may be reevaluated based on the findings
of further analysis. The load forecast and results reported in this RIP report are based on the information
provided and assumptions made by the participants of the RIP Working Group.
Working Group participants, their respective affiliated organizations, and Hydro One Networks Inc.
(collectively, “the Authors”) make no representations or warranties (express, implied, statutory or
otherwise) as to the RIP report or its contents, including, without limitation, the accuracy or completeness
of the information therein and shall not, under any circumstances whatsoever, be liable to each other, or to
any third party for whom the RIP report was prepared (“the Intended Third Parties”), or to any other third
party reading or receiving the RIP report (“the Other Third Parties”), for any direct, indirect or
consequential loss or damages or for any punitive, incidental or special damages or any loss of profit, loss
of contract, loss of opportunity or loss of goodwill resulting from or in any way related to the reliance on,
acceptance or use of the RIP report or its contents by any person or entity, including, but not limited to,
the aforementioned persons and entities.
5Greater Bruce-Huron - Regional Infrastructure Plan August 18, 2017
[This page is intentionally left blank]
6Greater Bruce-Huron - Regional Infrastructure Plan August 18, 2017
EXECUTIVE SUMMARY
THIS REGIONAL INFRASTRUCTURE PLAN (“RIP”) WAS PREPARED BY HYDRO
ONE AND THE WORKING GROUP IN ACCORDANCE WITH THE ONTARIO
TRANSMISSION SYSTEM CODE REQUIREMENTS. IT IDENTIFIES
INVESTMENTS IN TRANSMISSION FACILITIES, DISTRIBUTION FACILITIES, OR
BOTH, THAT SHOULD BE PLANNED AND IMPLEMENTED TO MEET THE
ELECTRICITY INFRASTRUCTURE NEEDS WITHIN THE GREATER BRUCE-
HURON REGION.
The participants of the RIP Working Group included members from the following organizations:
Hydro One Networks Inc. (Lead Transmitter)
Entegrus Power Lines Inc.
Erie Thames Powerlines Corporation
Festival Hydro Inc.
Goderich Hydro - West Coast Huron Energy Inc.
Hydro One Networks Inc. (Distribution)
Independent Electricity System Operator
Wellington North Power Inc.
Westario Power Inc.
This RIP is the final phase of the regional planning process for the Greater Bruce-Huron Region and
provides a consolidated summary of needs and recommended plans for the Greater Bruce-Huron Region
for the near-term (up to 5 years) and mid-term (5 to 10 years). No long term needs (10 to 20 years) have
been identified.
Investments planned for the Greater Bruce-Huron Region over the near and mid-term, identified in the
various phases of the regional planning process, are given in the table below.
No. Project In-Service Date Cost
Staged Plan $154k -
1 Improve L7S Customer Delivery Point Performance
2017-2023 TBD
Accommodation for Connection Capacity Requests TBD
2 near Kincardine– Hydro One Network Inc. (customer TBD
Distribution dependent)
In accordance with the Regional Planning process, the RIP should be reviewed and/or updated at least
every five years. The Region will continue to be monitored and should there be a need that emerges
earlier due to a change in load forecast or any other reason, the next regional planning cycle will be
started to address the need.
7Greater Bruce-Huron - Regional Infrastructure Plan August 18, 2017
Table of Contents
1. Introduction .......................................................................................................................................... 10
1.1 Objective and Scope ................................................................................................................... 11
1.2 Structure...................................................................................................................................... 11
2. RegionaL Planning Process .................................................................................................................. 12
2.1 Overview .................................................................................................................................... 12
2.2 Regional Planning Process ......................................................................................................... 12
2.3 RIP Methodology ....................................................................................................................... 15
3. Regional Characteristics ....................................................................................................................... 16
4. Transmission Facilities Completed Over Last Ten Years Or Currently Underway ............................. 19
5. Load Forecast And Study Assumptions ............................................................................................... 21
5.1 Load Forecast ............................................................................................................................. 21
5.2 Study Assumptions ..................................................................................................................... 23
6. Adequacy Of Facilities and Regional Needs Over the 2016-2025 Period ........................................... 24
6.1 230 kV Transmission Facilities .................................................................................................. 26
6.2 500/230 kV and 230/115 kV Transformation Facilities ............................................................. 26
6.3 Supply Capacity of the 115 kV Network .................................................................................... 27
6.4 Step-down Transformer Stations ................................................................................................ 27
6.5 Other Items Identified During Regional Planning ...................................................................... 28
6.5.1 Customer Delivery Point Performance ....................................................................................... 28
6.5.2 Low Power Factor Concerns ...................................................................................................... 28
6.6 Long-Term Regional Needs ....................................................................................................... 28
7. Regional Plans ...................................................................................................................................... 29
7.1 Transmission Circuit Capacity ................................................................................................... 29
7.2 Power Factor Review.................................................................................................................. 29
7.3 Customer Delivery Point Performance ....................................................................................... 30
7.4 Step-Down Transformation Capacity ......................................................................................... 32
7.5 Transmission Sustainment Plans ................................................................................................ 32
8. Conclusion ............................................................................................................................................ 34
9. References ............................................................................................................................................ 35
Appendix A: Step-Down Transformer Stations in the Greater Bruce-Huron Region ................................ 36
Appendix B: Regional Transmission Circuits in the Greater Bruce-Huron Region ................................... 37
Appendix C: Distributors in the Greater Bruce-Huron Region .................................................................. 38
Appendix D: Regional Load Forecast (2016-2025) .................................................................................... 39
Appendix E: RIP Transmission Adequacy Assessment.............................................................................. 47
Appendix F: Customer Delivery Point Performance Review ..................................................................... 48
Appendix G: List of Acronyms................................................................................................................... 52
8Greater Bruce-Huron - Regional Infrastructure Plan August 18, 2017
List of Figures
Figure 2-1 Regional Planning Process Flowchart ....................................................................................... 14
Figure 2-2 RIP Methodology ...................................................................................................................... 15
Figure 3-1 Geographical Area of the Greater Bruce-Huron Region with Electrical Layout ...................... 17
Figure 3-2 Greater Bruce-Huron Region Single Line Diagram .................................................................. 18
Figure 5-1 Greater Bruce-Huron Region Winter Extreme Weather Peak Forecast .................................... 22
Figure 5-2 Greater Bruce-Huron Region Summer Extreme Weather Peak Forecast.................................. 22
List of Tables
Table 6-1: Near and Mid-term Regional Needs .......................................................................................... 25
Table 7-1: Hydro One Transmission Major Sustainment Initiatives .......................................................... 32
Table 8-1: Regional Plans – Next Steps, Lead Responsibility and Plan In-Service Dates ......................... 34
Table F-1 - Customer Delivery Points ........................................................................................................ 48
9Greater Bruce-Huron - Regional Infrastructure Plan August 18, 2017
1. INTRODUCTION
THIS REPORT PRESENTS THE REGIONAL INFRASTRUCTURE PLAN (“RIP”) TO
ADDRESS THE ELECTRICITY NEEDS OF THE GREATER BRUCE-HURON
REGION.
The report was prepared by Hydro One Networks Inc. (“Hydro One”) and documents the results of the
joint study carried out by Hydro One, Entegrus Power Lines Inc., Erie Thames Powerlines Corporation,
Festival Hydro Inc., Hydro One Distribution, the Independent Electricity System Operator (“IESO”),
Wellington North Power Inc., Goderich Hydro - West Coast Huron Energy Inc. and Westario Power Inc.
in accordance with the Regional Planning process established by the Ontario Energy Board (“OEB”) in
2013.
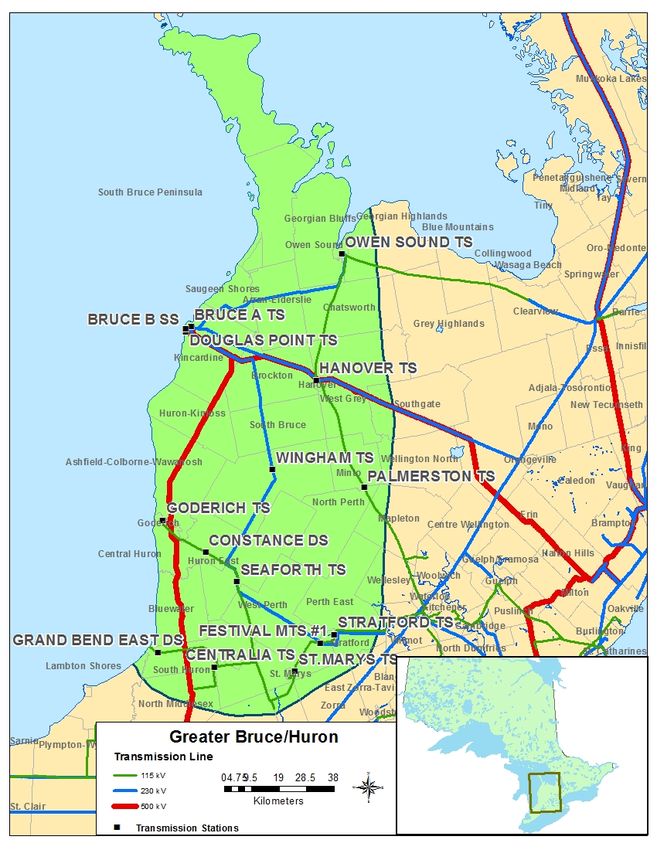
Figure 1-1 Greater Bruce-Huron Region
The Greater Bruce-Huron Region includes the counties of Bruce, Huron and Perth, as well as portions of
Grey, Wellington, Waterloo, Oxford and Middlesex counties. Electrical supply to the Region is provided
from six 230 kV and twelve 115 kV step-down transformer stations. The boundaries of the Region are
highlighted in Figure 1-1 above.
10Greater Bruce-Huron - Regional Infrastructure Plan August 18, 2017
1.1 Objective and Scope
This RIP report examines the needs in the Greater Bruce-Huron Region. Its objectives are:
To develop a wires plan to address needs identified in previous planning phases for which a wires
only alternative was recommended by the Working Group
To identify new supply needs that may have emerged since previous planning phases (e.g. Needs
Assessment, Scoping Assessment, Local Plan, and/or Integrated Regional Resource Plan)
To provide the status of wires planning currently underway or completed for specific needs
To identify investments in transmission and distribution facilities or both that should be
developed and implemented on a coordinated basis to meet the electricity infrastructure needs
within the region
The RIP reviewed factors such as the load forecast, major high voltage sustainment work, transmission
and distribution system capability along with any updates with respect to local plans, conservation and
demand management (CDM), renewable and non-renewable generation development, and other
electricity system and local drivers that may impact the need and alternatives under consideration.
The scope of this RIP is as follows:
A consolidated report of all the needs and relevant plans to address near and mid-term needs
(2016-2025) identified in previous planning phases (Needs Assessment or Local Plan)
Identification of any new needs over the 2016-2025 period
Develop a plan to address any longer term needs identified by the Working Group
1.2 Structure
The rest of the report is organized as follows:
Section 2 provides an overview of the regional planning process
Section 3 describes the region
Section 4 describes the transmission work completed over the last ten years
Section 5 describes the load forecast and study assumptions used in this assessment
Section 6 describes the results of the adequacy assessment of the transmission facilities and
identifies needs
Section 7 summarizes the Regional Plan to address the needs
Section 8 provides the conclusion and next steps
11Greater Bruce-Huron - Regional Infrastructure Plan August 18, 2017
2. REGIONAL PLANNING PROCESS
2.1 Overview
Planning for the electricity system in Ontario is done at essentially three levels: bulk system planning,
regional system planning, and distribution system planning. These levels differ in the facilities that are
considered and the scope of impact on the electricity system. Planning at the bulk system level typically
looks at issues that impact the system on a provincial level, while planning at the regional and distribution
levels looks at issues on a more regional or localized level.
Regional planning looks at supply and reliability issues at a regional or local area level. Therefore, it
largely considers the 115 kV and 230 kV portions of the power system that supply various parts of the
province.
2.2 Regional Planning Process
A structured regional planning process was established by the Ontario Energy Board in 2013, through
amendments to the Transmission System Code (“TSC”) and the Distribution System Code (“DSC”). The
process consists of four phases: the Needs Assessment1 (“NA”), the Scoping Assessment (‘SA”), the
Integrated Regional Resource Plan (“IRRP”), and the Regional Infrastructure Plan (“RIP”).
The regional planning process begins with the NA phase which is led by the transmitter to determine if
there are regional needs. The NA phase identifies the needs and the Working Group determines whether
further regional coordination is necessary to address them. If no further regional coordination is required,
further planning is undertaken by the transmitter and the impacted local distribution company (“LDC”) or
customer and develops a Local Plan (“LP”) to address them. These needs are local in nature and can be
best addressed by a straight forward wires solution.
In situations where identified needs require coordination at the regional or sub-regional levels, the IESO
initiates the SA phase. During this phase, the IESO, in collaboration with the transmitter and impacted
LDCs, reviews the information collected as part of the NA phase, along with additional information on
potential non-wires alternatives, and makes a decision on the most appropriate regional planning
approach. The approach is either a RIP, which is led by the transmitter, or an IRRP, which is led by the
IESO. If more than one sub-region was identified in the NA phase, it is possible that a different approach
could be taken for different sub-regions.
The IRRP phase will generally assess infrastructure (wires) versus resource options (e.g. CDM,
generation and Distributed Energy Resources (“DER”)) at a higher or more macro level but sufficient to
permit a comparison of options. If the IRRP process identifies that infrastructure options may be most
appropriate to meet a need, the RIP phase will conduct detailed planning to identify and assess the
1
Also referred to a Needs Screening
12Greater Bruce-Huron - Regional Infrastructure Plan August 18, 2017
specific wires alternatives and recommend the preferred wires solution. Similarly, resource options which
the IRRP identifies as best suited to meet a need are then further planned in greater detail by the IESO.
The IRRP phase also includes IESO led stakeholder engagement with municipalities and establishes a
Local Advisory Committee in the region or sub-region.
The RIP phase is the final stage of the regional planning process and involves: confirmation of previously
identified needs; identification of any new needs that may have emerged since the start of the planning
cycle; and development of a wires plan to address the needs where a wires solution was determined to be
the best overall approach. This phase is led and coordinated by the transmitter and the deliverable of this
stage is a comprehensive report of a wires plan for the region. Once completed, this report can be
referenced in rate filing submissions or as part of LDC rate applications with a planning status letter
provided by the transmitter. Reflecting the timeliness provisions of the RIP, plan level stakeholder
engagement is not undertaken at this stage. However, stakeholder engagement at a project specific level
will be conducted as part of the project approval requirement.
To efficiently manage the regional planning process, Hydro One has been undertaking wires planning
activities in collaboration with the IESO and/or LDCs for the Greater Bruce-Huron region as part of
and/or in parallel with:
Planning activities that were already underway in the region prior to the new regional planning
process taking effect.
The NA and LP phases of regional planning.
Working and planning for connection capacity requirements with the LDCs and transmission
connected customers
Figure 2-1 illustrates the various phases of the regional planning process (NA, SA, IRRP, and RIP) and
their respective phase trigger, lead, and outcome.
13Greater Bruce-Huron - Regional Infrastructure Plan August 18, 2017
Figure 2-1 Regional Planning Process Flowchart
14Greater Bru
uce-Huron - Regiional Infrastructu
ure Plan August 188, 2017
2.3 RIP
R Methodology
The RIP phase
p consistss of four stepss (see Figure 2-2) as follow
ws:
1. Data Gathering:
G Thhe first step of
o the RIP phaase is the revi ew of planninng assessmennt data collected in
the prrevious stagess of the region nal planning process.
p Hyddro One colleccts this informmation and
reviewws it with the Working Gro oup to reconffirm or updatee the informattion as requirred. The data
colleccted includes:
Gross
G and net peak
p demand d forecast at thhe transformeer station leveel. This includdes the effect of
anny distributedd generation and/or
a conserv vation and deemand managgement prograams.
Existing
E area network
n and capabilities
c in
ncluding any bbulk system ppower flow asssumptions.
Other
O data andd assumptionss as applicablee such as asseet conditions; load transferr capabilities, and
prreviously com mmitted transm mission and distribution
d syystem plans.
2. Techn nical Assessm ment: The seco ond step is a technical
t asseessment to revview the adeqquacy of the
regionnal system inccluding any previously
p ideentified needss. Additional nnear and mid-term needs m may
be ideentified at thiss stage.
3. Alternnative Develo opment: The third
t step is th
he developmeent of wires ooptions to adddress the needds and
to comme up with a preferred alteernative based d on an assesssment of techhnical consideerations,
feasib
bility, environnmental impacct and costs.
4. Impleementation Plan: The fourtth and last step p is the devellopment of thhe implementaation plan forr the
preferrred alternativve.
Figure 2-2
2 RIP Method
dology
15Greater Bruce-Huron - Regional Infrastructure Plan August 18, 2017
3. REGIONAL CHARACTERISTICS
THE GREATER BRUCE-HURON REGION COMPRISES OF THE COUNTIES OF
BRUCE, HURON, AND PERTH, AS WELL AS PORTIONS OF GREY,
WELLINGTON, WATERLOO, OXFORD, AND MIDDLESEX COUNTIES AS SHOWN
IN FIGURE 3-1.
Electricity supply for the Region is provided through a network of 230 kV and 115 kV transmission lines
supplied mainly by generation from the Bruce Nuclear Generating Station and local renewable generation
facilities in the Region. The majority of the electrical supply in the region is transmitted through 230 kV
circuits (B4V, B5V, B22D, B23D, B27S and B28S) radiating out from Bruce A TS. These circuits
connect the Region to the adjacent South Georgian Bay/Muskoka Region and the adjacent Kitchener-
Waterloo-Cambridge-Guelph (KWCG) Region.
Within the Region, electricity is delivered to the end users of LDCs and directly-connected industrial
customers by eleven Hydro One step-down transformation stations, as well as seven customer-owned
transformer or distribution stations supplied directly from the transmission system. Appendix A lists all
step-down transformer stations in the Region. Appendix B lists all transmission circuits and Appendix C
lists LDCs in the Region. The Single Line Diagram for the Greater Bruce-Huron Region transmission
system facilities is shown below in Figure 3-2.
16Greater Bruce-Huron - Regional Infrastructure Plan August 18, 2017
Figure 3-1 Geographical Area of the Greater Bruce-Huron Region with Electrical Layout
17Greater Bruce-Huron - Regional Infrastructure Plan August 18, 2017
Figure 3-2 Greater Bruce-Huron Region Single Line Diagram
18Greater Bruce-Huron - Regional Infrastructure Plan August 18, 2017
4. TRANSMISSION FACILITIES COMPLETED
OVER LAST TEN YEARS OR CURRENTLY
UNDERWAY
OVER THE LAST 10 YEARS A NUMBER OF TRANSMISSION PROJECTS HAVE
BEEN PLANNED AND COMPLETED BY HYDRO ONE, OR ARE UNDERWAY,
AIMED AT IMPROVING THE SUPPLY TO THE GREATER BRUCE-HURON
REGION.
In addition to Hydro One’s ongoing transmission station and line sustainment programs, specific projects
were identified as a result of joint planning studies undertaken by Hydro One, IESO and the LDCs; or
initiated to meet the needs of the LDCs; and/or to meet Provincial Government policies. A brief listing of
the completed projects is given below.
For reactive and voltage support needs:
a 230 kV shunt capacitor bank installed at Detweiler TS in 2007
a 230 kV shunt capacitor bank installed at Orangeville TS in 2008
For bulk power system transfer needs:
500 kV double circuit line from the Bruce Nuclear Complex to Milton SS in 2011
230 kV Static Var Compensator (SVC) at Detweiler TS in 2011
For major station refurbishment needs based on asset condition assessment:
Goderich TS in 2016
For renewable generation connection needs:
230 kV Melancthon Grey Wind Farm onto circuits B4V/B5V in 2006/2008
230 kV Ripley Wind Farm onto circuits B22D/B23D in 2007
230 kV Underwood Wind Farm onto circuits B4V/ B5V in 2008
230 kV Dufferin Wind Farm into Orangeville TS in 2014
500 kV Jericho/Adelaide/Bornish Wind Farms into Evergreen SS in 2014
230 kV Grand Valley 3 Wind Farm onto circuit B4V in 2015
115 kV Bluewater Wind Farm into Seaforth TS in 2015
115 kV Goshen Wind Farm onto circuit L7S in 2015
500 kV K2 Wind Farm into Ashfield SS in 2015
230 kV Grand Bend Wind Farm onto circuit B23D in 2016
230 kV Armow Wind Farm onto circuit B22D in 2016
230 kV Southgate Solar Farm onto circuit B4V in 2016
19Greater Bruce-Huron - Regional Infrastructure Plan August 18, 2017
The following projects are underway:
Centralia TS is currently undergoing major station refurbishment work with a projected
in-service of 2018.
Palmerston TS is currently undergoing major station refurbishment work with a projected
in-service of 2018.
Bruce A TS 230 kV switchyard is currently undergoing major station refurbishment work
with a projected in-servicing by 2019.
Replacement of the Bruce Special Projection Scheme (BSPS) is currently underway with
a projected in-service of 2018.
Modification to the Bruce Reactor Switching Scheme (RSS) is currently underway with a
projected in-service of 2018.
20Greater Bruce-Huron - Regional Infrastructure Plan August 18, 2017
5. LOAD FORECAST AND STUDY ASSUMPTIONS
5.1 Load Forecast
The load in the Greater Bruce-Huron Region is forecast to increase annually between 2016 and 2025. The
growth rate varies across the Region with most of the growth concentrated in the County of Bruce and
more specifically in the Kincardine area. The Region’s 2017 RIP load forecasts are provided in Appendix
D and were prepared by the Working Group upon initiation of the RIP phase. The RIP forecasts are
identical to the Needs Assessment forecast except as otherwise noted in Appendix D.
As per the load forecasts in Appendix D, the winter gross coincident load in the Region is expected to
grow at an average rate of approximately 1.4% annually from 2016-2025 and the summer gross
coincident load in the Region is expected to grow at an average rate of approximately 1.3% from 2016-
2025.
As per the load forecasts in Appendix D, the winter net coincident load in the Region is expected to grow
at an average rate of approximately 0.8% annually from 2016-2025 and the summer net coincident load in
the Region is expected to grow at an average rate of approximately 0.6% from 2016-2025.
Figure 5-1 shows the Region’s gross and net winter coincident forecasts while Figure 5.2 shows the
Region’s gross and net summer coincident forecasts. The regional-coincident (at the same time) forecast
represents the total peak load of all 18 step-down transformer stations in the Region.
Based on historical load and on the coincident load forecasts, the Region’s winter coincident peak load is
larger than its summer coincident peak load. Based on historical load and the non-coincident load
forecasts, the Region contains some stations that are summer peaking and others that are winter peaking.
Equipment ratings are normally lower in the summer than winter due to ambient temperature. Based on
these factors assessment for this Region was conducted for both summer and winter peak load.
21Greater Bruce-Huron - Regional Infrastructure Plan August 18, 2017
Greater Bruce‐Huron Load Forecast
810
790
770
MW
750
730
710
690
Year
Net Winter Coincident Station Peak Gross Winter Coincident Station Peak
Figure 5-1 Greater Bruce-Huron Region Winter Extreme Weather Peak Forecast
Greater Bruce‐Huron Load Forecast
680
670
660
650
640
MW
630
620
610
600
590
2015 2016 2017 2018 2019 2020 2021 2022 2023 2024 2025
Year
Net Summer Coincident Station Peak Gross Summer Coincident Station Peak
Figure 5-2 Greater Bruce-Huron Region Summer Extreme Weather Peak Forecast
22Greater Bruce-Huron - Regional Infrastructure Plan August 18, 2017
5.2 Study Assumptions
The following assumptions are made in this report.
1) The study period for the RIP assessments is 2016-2025.
2) All planned facilities listed in Section 4 are assumed to be in-service.
3) The Region contains some stations that are summer peaking and others that are winter peaking.
The assessment is therefore based on both summer and winter peak loads.
4) Station capacity adequacy is assessed by comparing the non-coincident peak load with the
station’s normal planning supply capacity by assuming a 90% lagging power factor for stations
without low-voltage capacitor banks or the historical low voltage power factor, whichever is more
conservative. Normal planning supply capacity for transformer stations in this Region is
determined by the summer and winter 10-Day Limited Time Rating (LTR), as appropriate.
5) Adequacy assessment is conducted as per Ontario Resource Transmission Assessment Criteria
(ORTAC).
23Greater Bruce-Huron - Regional Infrastructure Plan August 18, 2017
6. ADEQUACY OF FACILITIES AND REGIONAL
NEEDS OVER THE 2016-2025 PERIOD
THIS SECTION REVIEWS THE ADEQUACY OF THE EXISTING TRANSMISSION
SYSTEM AND STEP-DOWN TRANFORMATION STATION FACILITIES
SUPPLYING THE GREATER BRUCE-HURON REGION AND LISTS THE
FACILITIES REQUIRING REINFORCEMENT OVER THE NEAR AND MID-TERM.
Within the current regional planning cycle, five regional assessments have been conducted for the Greater
Bruce-Huron Region. The findings of these studies are input to the RIP. The studies are:
1) Needs Assessment Report - Greater Bruce-Huron Region, May 2016
2) Local Planning Report - Low Power Factor at Wingham TS, October 2016
3) Local Planning Report - Circuit L7S Thermal Overload, November 2016
4) Local Planning Report - Low Power Factor at Bruce HWP B TS, May 2017
5) Customer Delivery Point Performance Review, 2016-2017
This RIP reviewed the loading on transmission lines and stations in the Greater Bruce-Huron Region
based on the RIP load forecast. Sections 6.1-6.6 presents the results of this review and Table 6-1 lists the
Region’s needs identified in both the Needs Assessment and the RIP phases.
In addition, this RIP reviewed an updated list of Hydro One transmission lines and station major
sustainment work over the next several years to determine if there are opportunities to consolidate with
any emerging development needs within the Region. Section 7.5 presents the results of this review.
24Greater Bruce-Huron - Regional Infrastructure Plan August 18, 2017
Table 6-1: Near and Mid-term Regional Needs
Type Section Needs Timing
Needs Identified in the Needs Assessment Report [1]
2019 (based on gross load forecast)
Overload on sections of 115 kV single
Transmission Circuit Capacity 6.3
circuit line, L7S
2025 (based on net load forecast)
Low power factor at Wingham TS Immediate
Power Factor Review 6.5.2
Low power factor at Bruce HWP B TS Immediate
Customer Delivery Point Performance Delivery points supplied from 115 kV
6.5.1 Immediate
Review circuits 61M18, L7S and D10H
Additional Needs identified in RIP Phase
Step-down Transformation Capacity 6.4 Hydro One Distribution (Kincardine area) 2019/2020
25Greater Bruce-Huron - Regional Infrastructure Plan August 18, 2017
6.1 230 kV Transmission Facilities
Half of the 230 kV transmission circuits in the Greater Bruce-Huron Region are classified as part of the
Bulk Electricity System (“BES”). They connect the Region to the rest of Ontario’s transmission system
and are also part of the transmission path from generation in Southwestern Ontario to the load centers in
the KWCG, Georgian Bay and GTA areas. These circuits also serve local area stations within the Region
and the power flow on them depends on the bulk system transfer as well as local area loads. These circuits
are as follows (refer to Figure 3-2):
1) Bruce A TS to Orangeville TS 230kV transmission circuits B4V/B5V – supplies Hanover TS
2) Bruce A TS to Detweiler TS 230kV transmission circuits B22D/ B23D – supplies Wingham TS,
Seaforth TS, Festival MTS #1, and Stratford TS
3) Bruce A TS to Owen Sound TS 230kV transmission circuits B27S/B28S – supplies Owen Sound
TS
4) Bruce A TS to Douglas Point TS 230kV transmission circuits B20P/B24P – supplies Douglas
Point TS and Bruce HWP B TS
The RIP review shows that based on current forecast station loadings and bulk transfers, all 230 kV
circuits are expected to be adequate over the study period.
6.2 500/230 kV and 230/115 kV Transformation Facilities
Bulk power supply to the Greater Bruce-Huron Region is provided by Hydro One’s 500 kV to 230 kV
and 230 kV to 115 kV autotransformers. The number and location of these autotransformers are as
follows:
1) Three (3) 500/230kV autotransformers at Bruce A TS
2) Two (2) 230/115kV autotransformers at Seaforth TS
3) Two (2) 230/115kV autotransformers at Hanover TS
The RIP review shows that based on current forecast station loadings and bulk transfers, the
autotransformation supply capacity is adequate over the study period.
26Greater Bruce-Huron - Regional Infrastructure Plan August 18, 2017
6.3 Supply Capacity of the 115 kV Network
The Greater Bruce-Huron Region contains four (4) single circuit 115 kV lines. This 115 kV network
serves local area load. These circuits are as follows (see Figure 3-2):
1) Hanover TS to Detweiler TS 115 kV transmission circuit D10H with Normally Open (N/O) point
at Palmerston TS – supplies Palmerston TS & Elmira TS
2) Seaforth TS to Goderich TS 115 kV transmission circuit 61M18 – supplies Constance DS and
Goderich TS
3) Seaforth TS to St. Marys TS 115 kV transmission circuit L7S – supplies Grand bend East DS,
Lake Huron WTP CTS, Centralia TS, McGillivray R&BP CTS, Enbridge Bryanston CTS and St.
Marys Cement CTS
4) Hanover TS to Owen Sound TS 115 kV transmission circuit S1H
The RIP review shows that based on current forecast station loadings, the supply capacity of the 115 kV
network is adequate over the study period, except circuit L7S. Circuit L7S will exceed its thermal rating
in 2019 based on gross load forecast, and in 2025 based on net load forecast.
6.4 Step-down Transformer Stations
There are 18 step-down transformer stations within the Greater Bruce-Huron Region. Fourteen supply
electricity to LDCs and four are transmission-connected industrial customer stations. These stations are
listed in Appendix C. Of the 18 stations, 3 of them are owned and operated by LDCs.
As part of both the Needs Assessment as well as this RIP, step-down transformation station capacity was
reviewed. Since the May 2016 Needs Assessment, the load forecasts at Seaforth TS, Stratford TS and
Douglas Point TS have been modified; refer to Appendix E for the analysis of these modifications. The
analysis showed that the load forecasts at Seaforth TS and Stratford TS can still be accommodated.
However, the load forecast modification at Douglas Point TS will result in its transformation capacity
limit being exceeded towards the end of the study period, winter 2023/2024. This is due to a 15 MW
request for capacity made since the May 2016 Needs Assessment.
Furthermore, since updating the RIP forecast there has been additional connection requests for 2.2 MW,
0.5 MW and 20 MW of capacity by 2019/2020 at Douglas Point TS. The 2.2 MW and 0.5 MW requests
can be accommodated within the station’s transformation capacity limits; however the 20 MW request
would result in Douglas Point TS exceeding its transformation capacity within the near term (2019/2020)
and cannot be fully accommodated at this time. Therefore additional step-down transformation capacity
at/near Douglas Point TS is needed.
Based on the requirements of the customer requesting the 20 MW of connection capacity, three “need”
scenarios have been developed:
Scenario 1 – If the customer requires all 20 MW of capacity immediately, the need for additional step-
down transformation capacity is required in 2019/2020. Hydro One Transmission will work with Hydro
One Distribution and the customer to develop a plan to meet the increased capacity requirement. All costs
for the additional capacity will be allocated to the benefitting customer(s) as per the Transmission System
Code.
27Greater Bruce-Huron - Regional Infrastructure Plan August 18, 2017
Scenario 2 – If the customer accepts an offering to connect a portion of its load, the need for additional
step-down transformation capacity is required in 2021 due to the inherent “organic” growth of load. In
order to meet the need timeline, an expedited coordinated regional planning process will be undertaken by
the IESO, Hydro One Transmission and Hydro One Distribution. Cost allocation for additional
investment will depend on the solution to address the need.
Scenario 3 – If the customer elects not to proceed with its connection request, the need for additional step-
down transformation capacity is require by 2023/2024. CDM would help to defer the need and therefore
it is recommended to monitor load growth and re-evaluate the need in the next regional planning cycle.
6.5 Other Items Identified During Regional Planning
6.5.1 Customer Delivery Point Performance
The Needs Assessment section 6.2.5 identified that a performance review of several 115 kV customer
delivery points be undertaken. A summary of the review is provided in Appendix F.
6.5.2 Low Power Factor Concerns
The Needs Assessment sections 6.2.3 identified two stations which historically have low power factor:
Wingham TS and Bruce HWB TS.
6.6 Long-Term Regional Needs
A long-term, beyond 10 year, analysis was not deemed necessary by the Working Group for the Region at
this time and therefore no long-term studies have been undertaken. If new long-term needs were to arise,
there is sufficient time to assess them in the next planning cycle which can also be started earlier to make
timely investment decisions.
28Greater Bruce-Huron - Regional Infrastructure Plan August 18, 2017
7. REGIONAL PLANS
THIS SECTION SUMMARIZES THE REGIONAL PLANS FOR ADDRESSING THE
NEEDS LISTED IN TABLE 6-1.
7.1 Transmission Circuit Capacity
7.1.1 Circuit L7S
L7S is a single 115 kV circuit transmission line operated radial from Seaforth TS to St. Marys TS. As per
section 6.1.3 of the Needs Assessment, the circuit will reach its Load Meeting Capability (“LMC”) in
2019 based on the gross load forecast and 2025 based on the net load forecast.
Recommended Plan and Current Status
To address the transmission circuit capacity needs for L7S, the Local Planning working group created a
Development Plan which recommended monitoring load growth at stations supplied from circuit L7S.
The Development Plan is detailed in the Local Planning report [3]. The Development Plan specified that
when loading on L7S is expected to exceed its limits within a 3 year period, Hydro One Transmission will
increase the thermal rating of the limiting spans of circuit L7S. The cost to increase the rating is currently
estimated to be approximately $550 k. Strengthening L7S will be sufficient for supplying load connected
to L7S load for the study period. Loading beyond the study period’s forecast may then require additional
voltage support. Capacity cost allocation will be as per the Transmission System Code.
Current Status of the Loading on Circuit L7S
The past winter (2016/2017) loading on circuit L7S was reviewed in accordance with the Development
Plan. Winter peak coincident loading on the circuit was approximately 65% of the circuit capacity and did
not trigger the need to increase the rating. Monitoring will continue after each peak load season, winter
and summer.
7.2 Power Factor Review
7.2.1 Wingham TS
Power factor at Wingham TS is often low and does not meet IESO Market Rule requirements. As per
section 6.2.3 of the Needs Assessment, the low power factor at Wingham TS is to be managed by the
transmitter and affected LDCs.
29Greater Bruce-Huron - Regional Infrastructure Plan August 18, 2017
Recommended Plan and Current Status
The power factor review conducted by the Local Planning working group, showed that the power factor
of the load itself remains within Market Rule requirements. Further investigation revealed that the low
power factor is due to the connected Distributed Generation (DG). The investigation is detailed in the
Local Planning report [2]. The Local Plan recommends no mitigation is required at this time and to seek
IESO’s direction on power factor requirements with respect to DG.
Current Status of Power Factor with Respect to Distributed Generation
At this time, IESO does not recommend a Market Rule power factor amendment as the measured power
factor is due to the connected DG and asks that a case by case review be conducted when the power factor
consistently does not meet the Market Rule requirement.
7.2.2 Bruce HWP B TS
Power factor at Bruce HWP B TS is often low and does not meet IESO Market Rule requirements. As per
section 6.2.3 of the Needs Assessment, the low power factor at Bruce HWP B TS is to be managed by the
transmitter and the affected customer.
Recommended Plan
The power factor review conducted by the Local Planning working group, showed that while the power
factor of the load occasionally (rather than often as previously identified) does not meet Market Rule
requirements there is no negative effect at this time. The investigation is detailed in the Local Planning
report [4]. The Local Plan recommends no mitigation is required at this time.
7.3 Customer Delivery Point Performance
7.3.1 Customers Supplied from Circuit 61M18
The performance of delivery points supplied from circuit 61M18, specifically Constance DS and
Goderich TS were reviewed. The review is summarized in Appendix F, section F.1.
Recommended Plan and Current Status
To address delivery point performance to Constance DS and Goderich TS, it is recommended that Hydro
One Transmission continue to rely on its line and station maintenance programs, as well as capital
sustainment projects listed in section 4.0 and in Table 7-1 to improve the overall reliability.
30Greater Bruce-Huron - Regional Infrastructure Plan August 18, 2017
Current Status of Sustainment Work associated 61M18 Delivery Points
The 17 remaining original 1959 structures on circuit 61M18 along with 11 other structures are schedule to
be tested over the next 2 years. Those that are determined to be End-Of-Life (in poor condition), will then
be replaced in the next 5 years. These replacements will occur under Hydro One’s Line Sustainment
programs.
7.3.2 Customers Supplied from Circuit L7S
The performance of delivery points supplied from circuit L7S, specifically Centralia TS, Grand Bend East
DS, St. Marys TS and the 4 industrial customer connections, were reviewed. The review is summarized in
Appendix F, section F.2.
Recommended Plan
To address delivery point performance, it is recommended that Hydro One Transmission undertake a
staged approach. Stage 1 will entail a detailed field screening of the line for approximately $154 thousand
in 2017. Based on findings from the field screening, work to reduce the frequency of interruptions due to
adverse weather should be implemented in 2018 and 2019. Cost for improvements is unknown at this
time as it is dependent on actual findings. Performance will then be monitored for 2-3 years to verify
improvement. Stage 2 will be based on the monitored performance and may entail strategically installing
115 kV in-line remotely-operated switches on circuit L7S to reduce the duration of interruptions.
Switches are currently estimated to cost between $1M to $4M depending on the number of switches and
their location. Funding of the staged plan to be as per the OEB-approved Hydro One Customer Delivery
Point Performance Standard [EB-2002-0424, updated February 7, 2008]. Capital contribution from
customers is not anticipated at this time. If, however, capital contribution is required from customers such
financial obligation will be determined using methodology set out in the Transmission System Code.
7.3.3 Customers Supplied from Circuit D10H
The performance of delivery points supplied solely from circuit D10H, specifically Palmerston TS and
Elmira TS were reviewed. The review is summarized in Appendix F, section F.3.
Current Status
Consultations with customers supplied from D10H are expected to be undertaken in 2017. Additional
assessment and/or infrastructure to adhere to the OEB-approved funding rules for customer delivery point
reliability improvements. Improvements may entail installing 115 kV in-line remotely operated switches
for approximately $1.5M. Funding of the staged plan to be as per the OEB-approved Hydro One
Customer Delivery Point Performance Standard [EB-2002-0424, updated February 7, 2008]. Capital
contribution might be required from customers and such financial obligation will be determined using
methodology set out in the Transmission System Code.
31Greater Bruce-Huron - Regional Infrastructure Plan August 18, 2017
7.4 Step-Down Transformation Capacity
7.4.1 Hydro One Distribution
The RIP load forecast in conjunction with more recent requests for step-down transformation capacity by
Hydro One Distribution at Douglas Point TS indicates that additional step-down transformation capacity
is needed.
Current Status
Hydro One Distribution is currently working with its customer to determine their connection capacity
requirements, size and timeline. Once the customer’s requirements are firm, one of the three “need”
scenarios outlined in section 6.4 of this report will be undertaken.
7.5 Transmission Sustainment Plans
As part of Hydro One’s transmitter requirements, Hydro One continues to ensure a reliable transmission
system by carrying out maintenance programs as well as periodic replacement of equipment based on
their condition. Table 7.1 lists Hydro One’s major transmission sustainment projects in the Region that
are currently planned or underway. There is currently no major line sustainment projects planned within
the next 5 years. Maintenance programs such as insulator, shield wire, structure replacements will
continue to be carried out in the Region as required based on equipment/asset condition assessments.
Table 7-1: Hydro One Transmission Major Sustainment Initiatives2
Planning In
Station General Description of Work
Service Date
Replacement of 230 kV circuit breakers
Uprating of the station strain buses 2019
Replacement of Protections and Control relay building
Bruce A TS
Replacement of 500 kV circuit breakers and switches
Replacement of 2 autotransformers 500/230 kV 2025
Upgrading of Protection and Control equipment
Bruce B SS Replacement of 500 kV circuit breakers and switches 2021
2
Scope and dates as of July 2017 and are subject to change
32Greater Bruce-Huron - Regional Infrastructure Plan August 18, 2017
Replace existing 3 transformers with a typical 25/42 MVA 2
transformer arrangement
Centralia TS 2019
Replacement of 27.6 kV switchyard
Installation of new PCT Facilities
Replacement of AC and DC station service 2018
Detweiler TS Replacement of T2 and T4 autotransformers and upgrade to
spill containment 2021
Replacement Protection and Control equipment
Replacement of T1/T2 transformers and associated switches
Replacement of low voltage circuit breakers and switches
Hanover TS 2023
Replacement of Protection and Control systems and CVT’s
Additional scope of work currently under development
Replace existing 3 transformers with a typical 50/83 MVA 2
transformer arrangement.
Replacement of low voltage switches
Palmerston TS 2019
Replacement of Protection and Control systems with new PCT
facilities
Upgrade to AC & DC station services
Replacement of 2 autotransformers 230/115 kV
Replacement of 2 step-down transformers 115/27.6 kV
Seaforth TS Replacement of 230kV switches 2023
Upgrade Protection and Control systems
Updated AC & DC station service
Complete station refurbishment
Wingham TS 2022
Additional scope of work currently under development
Based on the needs identified in the region thus far and the transmission sustainment plans listed in Table
7-1, consolidation of sustainment and development needs is not necessary at this time.
33Greater Bruce-Huron - Regional Infrastructure Plan August 18, 2017
8. CONCLUSION
THIS REGIONAL INFRASTRUCTURE PLAN REPORT CONCLUDES THE
REGIONAL PLANNING PROCESS FOR THE GREATER BRUCE-HURON REGION.
Five near and mid-term needs were identified for the Greater Bruce-Huron Region. They are:
I. Transmission Circuit Capacity on L7S
II. Low power factor at Wingham TS
III. Low power factor at Bruce HWB TS
IV. Customer delivery point performance review on the 115 kV system
V. Step-down transformation capacity at Douglas Point TS
This RIP report addresses all five of these needs and has concluded that no regional plans for needs I, II
and III are required at this time. Next Steps, Lead Responsibility, and Timeframes for implementing the
regional plans needs IV and V are summarized in the Table 8-1 below.
Table 8-1: Regional Plans – Next Steps, Lead Responsibility and Plan In-Service Dates
Lead In-Service Needs
No. Project Next Steps Cost
Responsibility Date Mitigated
Improve 3L7S Delivery Point Hydro One $154k -
1 2 Stage Plan 2017-2023 IV
Performance Transmission TBD
Accommodation for
Connection Capacity Await
Hydro One
2 Requests near Kincardine– Customer
Distribution
TBD TBD V
Hydro One Network Inc. Direction
Distribution
In accordance with the Regional Planning process, the Regional Plan should be reviewed and/or updated
at least every five years. The region will continue to be monitored and should there be a need that
emerges due to a change in load forecast or any other reason, the next regional planning cycle will be
started earlier to address the need.
34Greater Bruce-Huron - Regional Infrastructure Plan August 18, 2017
9. REFERENCES
[1] Hydro One, “Needs Assessment Report, Greater Bruce-Huron Region”, 6 May 2016.
http://www.hydroone.com/RegionalPlanning/GreaterBruce-
Huron/Documents/Needs%20Assessment%20Report%20-%20GreaterBruce-
Huron%20Region.pdf
[2] Hydro One, “Local Planning Report – Low Power Factor at Wingham TS Assessment”, 18
October 2016.
http://www.hydroone.com/RegionalPlanning/GreaterBruce-
Huron/Documents/Local%20Planning%20Report%20-
%20Wingham%20TS%20Power%20Factor%20Assessment.pdf
[3] Hydro One, “Local Planning Report – L7S Thermal Overload”, 14 November 2016.
http://www.hydroone.com/RegionalPlanning/GreaterBruce-
Huron/Documents/Local%20Planning%20Report%20-%20L7S%20Thermal%20Overload.pdf
[4] Hydro One, “Local Planning Report – Low TS Power Factor at Bruce heavy Water B TS
Assessment”, 12 May 2017.
http://www.hydroone.com/RegionalPlanning/GreaterBruce-
Huron/Documents/Bruce%20HWB%20TS%20Power%20Factor%20Assessment%20-
%20FINAL.PDF
35Greater Bruce-Huron - Regional Infrastructure Plan August 18, 2017
APPENDIX A: STEP-DOWN TRANSFORMER
STATIONS IN THE GREATER BRUCE-HURON
REGION
Station Voltage (kV) Supply Circuits
Bruce HWP B TS 230 kV B20P/B24P
Douglas Point TS 230 kV B20P/B24P
Hanover TS 115 kV B4V/B5V
Owen Sound TS 230 kV B27S/B28S
Seaforth TS 115 kV B22D/B23D
Stratford TS 230 kV B22D/B23D
Wingham TS 230 kV B22D/B23D
Festival MTS #1 230 kV B22D/B23D
Palmerston TS 115 kV D10H
Goderich TS 115 kV 61M18
Constance DS 115 kV 61M18
St. Marys TS 115 kV L7S
Customer CTS #1 115 kV L7S
Centralia TS 115 kV L7S
Grand Bend East DS 115 kV L7S
Customer CTS #2 115 kV L7S
Customer CTS #3 115 kV L7S
Customer CTS #4 115 kV L7S
36Greater Bruce-Huron - Regional Infrastructure Plan August 18, 2017
APPENDIX B: REGIONAL TRANSMISSION
CIRCUITS IN THE GREATER BRUCE-HURON
REGION
Location Circuit Designation Voltage (kV)
Bruce A TS - Orangeville TS B4V/B5V 230 kV
Bruce A TS - Detweiler TS B22D/ B23D 230 kV
Bruce A TS - Owen Sound TS B27S/B28S 230 kV
Bruce A TS - Douglas Point TS B20P/B24P 230 kV
Hanover TS – Palmerston TS D10H-North 115 kV
Seaforth TS - Goderich TS 61M18 115 kV
Seaforth TS - St. Marys TS L7S 115 kV
Owen Sound TS – Hanover TS S1H 115 kV
37Greater Bruce-Huron - Regional Infrastructure Plan August 18, 2017
APPENDIX C: DISTRIBUTORS IN THE GREATER
BRUCE-HURON REGION
Distributor Name Station Name Connection Type
Hydro One Networks Inc. Constance Tx
Centralia TS Dx
Grand Bend East DS Tx
Douglas Point TS Dx
Goderich TS Dx
Hanover TS Dx
Owen Sound TS Dx
Palmerston TS Dx
Seaforth TS Dx
St. Marys TS Dx
Stratford TS Dx
Wingham TS Dx
Erie Thames Power Lines Corporation Constance DS Dx
Festival Hydro Inc. Grand Bend East DS Dx
Seaforth TS Dx
Stratford TS Dx
Festival MTS #1 Tx
Lake Huron Primary Water Supply System Lake Huron WTP CTS Tx
Lake Huron Primary Water Supply System McGillivray R&BP CTS Tx
West Coast Huron Energy Inc. Goderich TS Tx
Enbridge Pipeline Inc. Enbridge Bryanston CTS Tx
St. Marys Cement Inc. St. Marys Cement CTS Tx
38Greater Bruce-Huron - Regional Infrastructure Plan August 18, 2017
APPENDIX D: REGIONAL LOAD FORECAST (2016-2025)
Table D-1: Gross – Winter Regional-Coincident Peak Load Forecast
Forecast (MW)
Station
2015/16 2016/17 2017/18 2018/19 2019/20 2020/21 2021/22 2022/23 2023/24 2024/25
Centralia TS 32.87 33.40 33.77 34.25 34.87 35.48 35.93 36.36 36.77 37.19
Constance DS 17.68 17.76 17.79 17.87 18.01 18.16 18.26 18.35 18.46 18.57
Douglas Point TS* 73.44 74.42 83.75 92.21 93.41 94.66 95.80 96.95 98.14 99.39
Customer CTS #1 0.90 0.90 0.90 0.90 0.90 0.90 0.90 0.90 0.90 0.90
Festival MTS #1 19.41 19.55 19.70 19.85 20.00 20.15 20.30 20.45 20.60 20.76
Goderich TS 36.35 36.50 36.59 36.73 36.92 37.11 37.25 37.37 37.49 37.61
Grand Bend East DS 14.22 14.36 14.43 14.55 14.72 14.89 15.00 15.09 15.19 15.28
Hanover TS 102.37 103.16 103.93 104.95 105.99 107.05 107.73 108.39 109.06 109.72
Customer CTS #2 4.30 4.30 4.30 4.30 4.30 4.30 4.30 4.30 4.30 4.30
Customer CTS #3 2.00 2.00 2.00 2.00 2.00 2.00 2.00 2.00 2.00 2.00
Owen Sound TS 135.53 137.73 139.21 141.20 143.81 146.38 148.20 149.90 151.56 153.19
Palmerston TS 61.92 62.92 63.88 65.12 66.22 67.44 68.42 69.41 70.41 71.40
Seaforth TS* 33.44 33.65 37.25 33.62 33.87 34.12 34.28 34.44 34.59 34.74
Customer CTS #4 9.49 10.07 10.07 10.64 10.64 10.64 10.64 10.64 10.64 10.64
St. Marys TS 23.74 25.04 25.17 25.31 25.50 25.69 25.84 25.98 26.12 26.25
Stratford TS* 80.14 80.81 81.39 85.46 86.20 86.93 87.56 88.18 88.79 89.41
Wingham TS 48.99 49.80 50.44 51.23 52.24 53.24 54.07 54.89 55.74 56.62
Bruce HWB TS 10.96 11.10 11.10 11.10 11.10 11.10 11.10 11.10 11.10 11.10
*Updated March 2017 for RIP
39Greater Bruce-Huron - Regional Infrastructure Plan August 18, 2017
Table D-2: Gross – Summer Regional-Coincident Peak Load Forecast
Forecast (MW)
Station
2016 2017 2018 2019 2020 2021 2022 2023 2024 2025
Centralia TS 32.42 32.73 33.15 33.78 34.40 34.83 35.24 35.65 36.05 36.45
Constance DS 15.56 15.57 15.63 15.76 15.90 15.98 16.07 16.16 16.26 16.36
Douglas Point TS* 47.40 47.40 63.29 63.76 64.26 64.64 65.03 65.41 65.78 66.18
Customer CTS #1 1.30 1.30 1.30 1.30 1.30 1.30 1.30 1.30 1.30 1.30
Festival MTS #1 25.03 25.22 25.41 25.60 25.79 25.98 26.18 26.37 26.57 26.77
Goderich TS 39.08 39.15 39.27 39.48 39.68 39.81 39.93 40.06 40.18 40.31
Grand Bend East DS 16.44 16.50 16.62 16.84 17.05 17.17 17.29 17.39 17.50 17.61
Hanover TS 76.71 76.94 77.62 78.60 79.25 79.71 80.12 80.53 80.93 81.32
Customer CTS #2 5.58 5.58 5.58 5.58 5.58 5.58 5.58 5.58 5.58 5.58
Customer CTS #3 4.20 4.20 4.20 4.20 4.20 4.20 4.20 4.20 4.20 4.20
Owen Sound TS 97.58 98.48 99.75 101.70 103.59 104.89 106.11 107.31 108.48 109.63
Palmerston TS 53.07 53.79 54.90 56.36 57.68 58.81 59.97 61.19 62.43 63.75
Seaforth TS* 30.68 34.34 30.56 30.78 30.99 31.14 31.27 30.78 31.54 31.67
Customer CTS #4 14.62 15.54 15.54 16.47 16.47 16.47 16.47 16.47 16.47 16.47
St. Marys TS 25.31 25.42 25.57 25.75 25.94 26.09 26.24 26.38 26.52 26.66
Stratford TS* 78.09 78.59 82.38 83.14 83.91 84.52 85.11 85.70 86.29 86.88
Wingham TS 37.99 38.11 38.36 38.87 39.37 39.67 39.97 40.26 40.54 40.83
Bruce HWB TS 5.14 5.24 5.34 5.44 5.54 5.64 5.74 5.84 5.93 6.03
*Updated March 2017 for RIP
40Greater Bruce-Huron - Regional Infrastructure Plan August 18, 2017
Table D-3: Gross – Winter Non-Coincident Peak Load Forecast
Forecast (MW)
Station
2015/16 2016/17 2017/18 2018/19 2019/20 2020/21 2021/22 2022/23 2023/24 2024/25
Centralia TS 34.15 34.70 35.08 35.59 36.23 36.87 37.33 37.77 38.21 38.63
Constance DS 19.42 19.51 19.54 19.63 19.79 19.95 20.06 20.17 20.28 20.40
Douglas Point TS* 73.44 74.42 83.75 92.21 93.41 94.66 95.80 96.95 98.14 99.39
Customer CTS #1 3.79 3.79 3.79 3.79 3.79 3.79 3.79 3.79 3.79 3.79
Festival MTS #1 25.47 25.66 25.85 26.05 26.24 26.44 26.64 26.84 27.04 27.24
Goderich TS 41.61 41.78 41.88 42.04 42.26 42.48 42.63 42.77 42.91 43.05
Grand Bend East DS 14.75 14.89 14.97 15.09 15.27 15.45 15.56 15.66 15.75 15.85
Hanover TS 96.65** 97.40 98.12 99.09 100.07 101.06 101.71 102.33 102.97 103.58
Customer CTS #2 5.90 5.90 5.90 5.90 5.90 5.90 5.90 5.90 5.90 5.90
Customer CTS #3 4.63 4.63 4.63 4.63 4.63 4.63 4.63 4.63 4.63 4.63
Owen Sound TS 135.53 137.73 139.21 141.20 143.81 146.38 148.20 149.90 151.56 153.19
Palmerston TS 68.03** 69.12 70.18 71.54 72.76 74.10 75.17 76.26 77.36 78.45
Seaforth TS* 34.75 34.96 38.70 34.92 35.19 35.44 35.62 35.78 35.93 36.09
Customer CTS #4 17.06 18.10 18.10 19.14 19.14 19.14 19.14 19.14 19.14 19.14
St. Marys TS 25.13 26.50 26.64 26.79 26.99 27.19 27.35 27.50 27.64 27.78
Stratford TS* 84.52 85.23 85.84 90.13 90.91 91.69 92.36 93.00 93.65 94.30
Wingham TS 57.98 58.94 59.70 60.63 61.82 63.01 63.98 64.96 65.96 67.00
Bruce HWB TS 11.07 11.20 11.20 11.20 11.20 11.20 11.20 11.20 11.20 11.20
*Updated March 2017 for RIP
**Load Transfer from Hanover TS to Palmerston TS
41You can also read