Murray-Darling Basin water markets - Trends and drivers 2002-03 to 2018-19 Tim Goesch, Peter Legg and Manannan Donoghoe - Analysis and Policy ...
←
→
Page content transcription
If your browser does not render page correctly, please read the page content below
Murray-Darling Basin water
markets
Trends and drivers 2002-03 to 2018-19
Tim Goesch, Peter Legg and Manannan Donoghoe
Research by the Australian Bureau of Agricultural and Resource Economics and Sciences
Research report 20.5
February 2020
© Commonwealth of Australia 2020

Ownership of intellectual property rights

Unless otherwise noted, copyright (and any other intellectual property rights, if any) in this publication is owned by
the Commonwealth of Australia (referred to as the Commonwealth).

Creative Commons licence

All material in this publication is licensed under a Creative Commons Attribution 4.0 International Licence except
content supplied by third parties, logos and the Commonwealth Coat of Arms.

Inquiries about the licence and any use of this document should be emailed to copyright@awe.gov.au.

Cataloguing data

This publication (and any material sourced from it) should be attributed as: Goesch, T, Legg, P & Donoghoe, M 2020,
Murray-Darling Basin water markets: trends and drivers 2002-03 to 2018-19, ABARES research report, Canberra,
February, CC BY 4.0. https://doi.org/10.25814/5e409ea3cb1fc

ISBN: 978-1-74323-465-5

ISSN: 1447-8358

This publication is available at awe.gov.au/abares

Australian Bureau of Agricultural and Resource Economics and Sciences (ABARES)
GPO Box 858 Canberra ACT 2601
Telephone 1800 900 090
Web awe.gov.au

The Australian Government acting through the Department of Agriculture, Water and the Environment, represented
by the Australian Bureau of Agricultural and Resource Economics and Sciences, has exercised due care and skill in
preparing and compiling the information and data in this publication. Notwithstanding, the Department of
Agriculture, Water and the Environment, ABARES, its employees and advisers disclaim all liability, including liability
for negligence and for any loss, damage, injury, expense or cost incurred by any person as a result of accessing, using
or relying on any of the information or data in this publication to the maximum extent permitted by law.

Acknowledgements

The authors would like to thank Peter Gooday, David Galeano, Neal Hughes, Mihir Gupta and Tim Westwood from
ABARES for their contributions to this report. The Australian Government Department of Agriculture, Water and the
Environment also provided valuable comments on earlier drafts of this paper.

                                                        ABARES
                                                           ii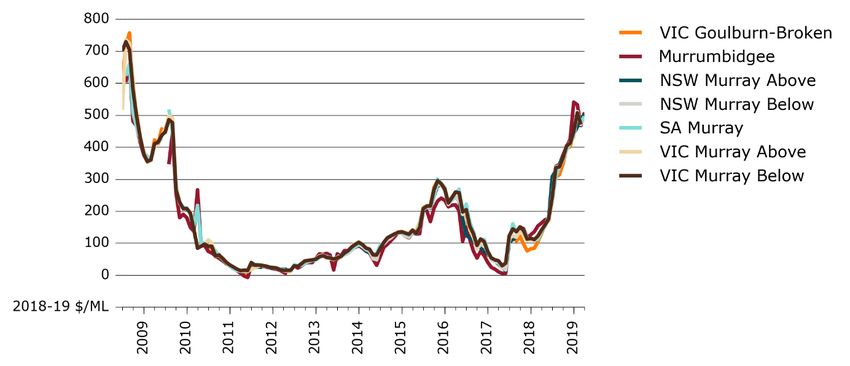
Contents
        Summary .....................................................................................................................................................................vi
        Introduction ................................................................................................................................................................1
        1        Supply factors...................................................................................................................................................3
                 1.1           Water allocations ............................................................................................................................. 3
                 1.2           Environmental water recovery .................................................................................................. 8
                 1.3           Carryover .......................................................................................................................................... 10
        2        Demand factors............................................................................................................................................. 13
                 2.1           Profitability ...................................................................................................................................... 14
                 2.2           Seasonal conditions ...................................................................................................................... 21
                 2.3           Investments in on-farm irrigation infrastructure............................................................ 21
        3        Water prices and trade flows.................................................................................................................. 24
                 3.1           Entitlement prices......................................................................................................................... 24
                 3.2           Weather and climate .................................................................................................................... 25
                 3.3           Institutional factors ...................................................................................................................... 26
                 3.4           Demand ............................................................................................................................................. 28
                 3.5           Trade .................................................................................................................................................. 28
                 3.6           Future allocation prices .............................................................................................................. 32
        Appendix A: Interregional trade flows ......................................................................................................... 34
        References ................................................................................................................................................................ 36

Figures
Figure 1 Monthly allocation prices and storage volumes, southern MDB, July 2005 to May 2019 vi
Figure 2 Total water available for irrigation plus environmental water, southern MDB, 2000-01
to 2018-19.......................................................................................................................................................................... vii
Figure 3 Irrigation water use, selected industries, southern MDB, 2005-06 to 2017-18 ................ viii
Figure 4 Annual rainfall, southern MDB, 1911-12 to 2017-18 .......................................................................4
Figure 5 Annual rainfall, northern MDB, 1911-12 to 2017-18 .......................................................................4
Figure 6 Annual inflows, southern MDB, 1911-12 to 2017-18 .......................................................................5
Figure 7 Monthly storage volumes, southern MDB, October 2002 to May 2019 ....................................5
Figure 8 Water storage percentages, northern MDB, July 2007 to November 2019 .............................6
Figure 9 Total regulated surface water allocations for irrigation and environmental use,
southern MDB, 2000-01 to 2018-19 ..........................................................................................................................6
Figure 10 Total regulated surface water allocations for irrigation and environmental use, NSW
northern MDB, 2000-01 to 2018-19 ..........................................................................................................................7
Figure 11 Annual mean temperature anomaly, MDB, 1910-11 to 2018-19 ..............................................8

                                                                                      ABARES
                                                                                           iii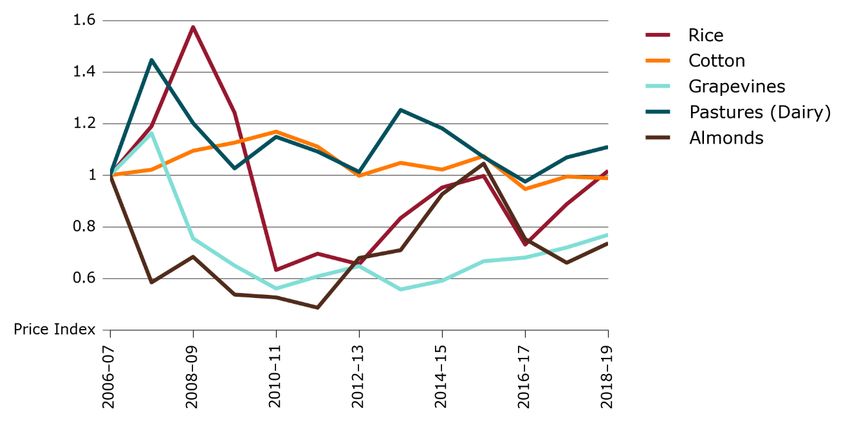
Figure 12 Total Commonwealth surface water recovery in the southern MDB, 30 September
2019 .........................................................................................................................................................................................9
Figure 13 Total Commonwealth surface water recovery in the northern MDB, 30 September
2019 ...................................................................................................................................................................................... 10
Figure 14 Total water available for irrigation plus environmental water, southern MDB, 2000-01
to 2018-19.......................................................................................................................................................................... 10
Figure 15 Net change in irrigation carryover in regulated systems, southern MDB, 2000-01 to
2018-19 ............................................................................................................................................................................... 11
Figure 16 Net change in irrigation carryover in regulated systems, NSW northern MDB, 2000-01
to 2017-18.......................................................................................................................................................................... 12
Figure 17 Long run change in water demand (2005–06 compared with 2018–19) at a price of
$200/ML, by activity, southern MDB ...................................................................................................................... 14
Figure 18 Commodity price indexes, selected industries, 2006-07 to 2018-19 ................................... 15
Figure 19 Rate of return, selected industries, 2006-07 to 2018-19 .......................................................... 15
Figure 20 Irrigated area, selected broadacre industries and dairy, southern MDB, 2005-06 to
2017-18 ............................................................................................................................................................................... 16
Figure 21 Irrigation water use, selected broadacre industries and dairy, southern MDB, 2005-06
to 2017-18.......................................................................................................................................................................... 16
Figure 22 Irrigated area, horticulture, southern MDB, 2005-06 to 2017-18 ......................................... 17
Figure 23 Irrigation water use, horticulture, southern MDB, 2005-06 to 2017-18 ............................ 17
Figure 24 Irrigation water use, by activity and catchment, northern MDB, 2017-18 ........................ 18
Figure 25 Irrigation water use, selected broadacre industries and dairy, northern MDB, 2005-06
to 2017-18.......................................................................................................................................................................... 18
Figure 26 Irrigated area, almonds, selected regions, 2005-06 to 2017-18 ............................................ 19
Figure 27 Irrigation water use, almonds, selected regions, 2005-06 to 2017-18 ................................ 19
Figure 28 Irrigated area, rice and cotton, Murrumbidgee, 2005-06 to 2017-18.................................. 20
Figure 29 Irrigation water use, rice and cotton, Murrumbidgee, 2005-06 to 2017-18 ..................... 20
Figure 30 Farm groundwater use, MDB, 2005-06 to 2017-18..................................................................... 21
Figure 31 Irrigation water use per hectare, selected irrigated broadacre industries and dairy,
MDB, 2005-06 to 2017-18 ........................................................................................................................................... 23
Figure 32 Irrigation water use per hectare, selected irrigated horticulture industries, MDB,
2005-06 to 2017-18 ....................................................................................................................................................... 23
Figure 33 Entitlement prices for selected entitlement classes, southern MDB, 2009-10 to 2018-
19 ........................................................................................................................................................................................... 25
Figure 34 Monthly allocation prices and storage volumes, southern MDB, July 2005 to May 2019
................................................................................................................................................................................................ 25
Figure 35 Annual allocation prices, NSW northern MDB, 2007-08 to 2018-19 ................................... 26
Figure 36 Demand for irrigation water as a function of water allocation price, southern MDB,
2005-06 compared with 2018-19, holding rainfall fixed at average values .......................................... 28
Figure 37 Gross value of irrigated agricultural production (real terms) and water use, MDB,
2005-06 to 2017-18 ....................................................................................................................................................... 29

                                                                                          ABARES
                                                                                               iv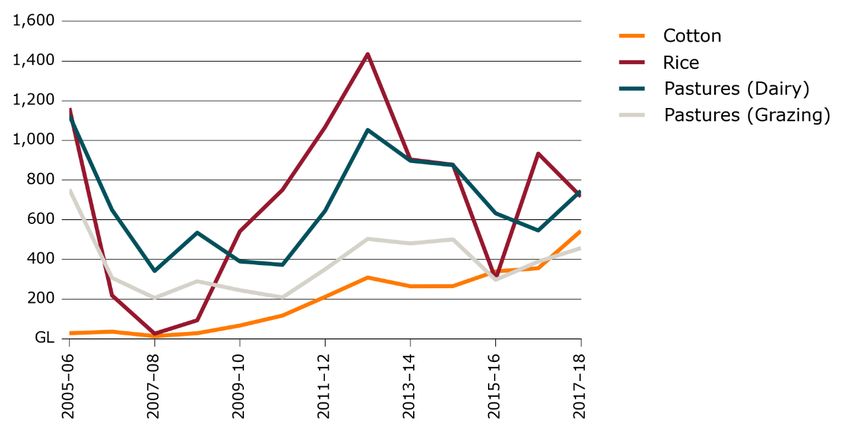
Figure 38 Net interregional trade, surface water allocations, Victorian Murray below Barmah
Choke.................................................................................................................................................................................... 30
Figure 39 Net interregional trade, surface water allocations, Murrumbidgee...................................... 30
Figure 40 Surface water allocation prices, selected regions, southern MDB, 2008-09 to 2018-19
................................................................................................................................................................................................ 31
Figure 41 Surface water allocation prices, Victorian Murray below Barmah and Murrumbidgee
systems, 2012 to 2019 .................................................................................................................................................. 32
Figure 42 Water price histogram, southern MDB ............................................................................................. 33
Figure 43 Net interregional trade, surface water allocations, NSW Murray .......................................... 34
Figure 44 Net interregional trade, surface water allocations, SA Murray ............................................... 34
Figure 45 Net interregional trade, surface water allocations, Goulburn-Broken ................................ 35

Maps
Map 1 Murray-Darling Basin catchments and major rivers .............................................................................2

                                                                                          ABARES
                                                                                                v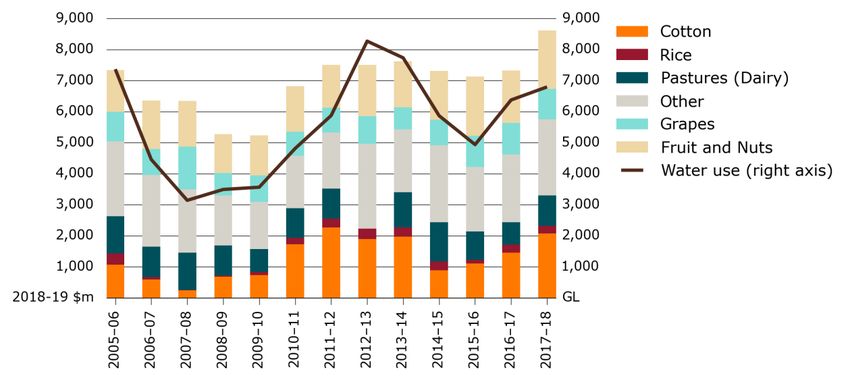
Summary
The Murray-Darling Basin (MDB) water market is complex and influenced by a range of factors,
including weather, commodity markets and water policy. The objective of this report is to shed
some light on changes in water markets (water prices and water trade flows) in the MDB over
the past 15 to 20 years, and to explain the main factors driving these changes.

A key feature of the MDB water market is that the total volume of water available for use is
capped, with changes in the supply and demand for water reflected in the price of water and
movements in water between farms, industries and regions.

Historical data shows that water allocation prices are mainly driven by changes in water supply
(Figure 1), and that the main factor influencing water supply in the MDB is rainfall. Rainfall was
around 17% lower than the long run average in the southern MDB (sMDB) during the
Millennium drought, and has been 5% lower since 2000. This has led to significantly lower
inflows into rivers and dams. Allocation prices increased to unprecedented highs during the
peak of the Millennium drought before declining to near zero following the 2011, 2012 and 2016
floods. Prices have risen substantially again during the latest drought.

Figure 1 Monthly allocation prices and storage volumes, southern MDB, July 2005 to May
2019

Note: Data was cleaned using ABARES price cleaning methods as described in Sanders et al. (2019) and adjusted for
inflation.
Source: Price data is sourced from the BOM national water register, various market reports and broker websites; ABS
Consumer Price Index (2019) (cat. 6401.0). Storage data is from Water NSW, SA Water, Goulburn-Murray Water, and the
MDBA.

The other factors influencing supply tend to be institutional, and include recovering water for
the environment, restrictions on interregional trade, changes in allocation rules in state water
sharing plans and increased access to carryover. Commonwealth environmental recovery
contributes to higher prices by reducing the volume of water available for irrigation (Figure 2)
while trade restrictions can lead to differences in prices between regions in connected systems.
Changes in the way water is allocated in state water sharing plans can change the timing of
supply. For example, new water storage policies and more conservative forecasts for future
inflows can change the timing of allocations, both within and between years.

                                                      ABARES
                                                          vi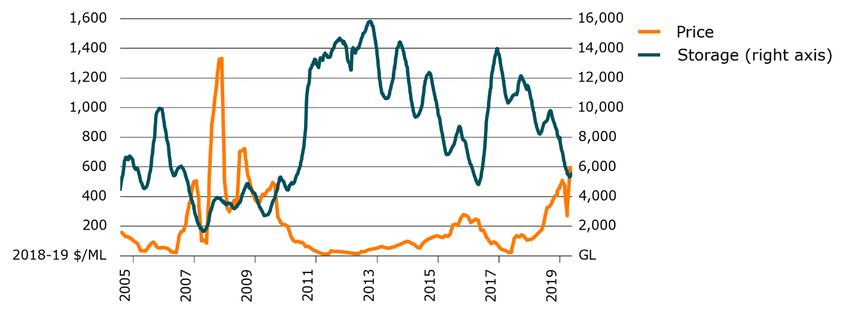
Figure 2 Total water available for irrigation plus environmental water, southern MDB,
2000-01 to 2018-19

Note: Water available for irrigation is defined as the sum of total water supply less environmental allocations.
Environmental allocations are defined as water allocations against entitlements owned by the Commonwealth
Environmental Water Holder (from purchases and on-farm infrastructure).
Source: ABARES estimate

There has been significant interest in the impact that Commonwealth environmental water
recovery has had on water supply and water prices in recent years. While Commonwealth
environmental water recovery has reduced consumptive supply, the effect has been relatively
small compared to the effect rainfall had on supply over the same period.

The effect of increasing access to carryover on supply is more complex. Carryover allows
irrigators to have more control over the timing of water use. The easing of restrictions on
carryover that occurred in the late 2000s contributed to a significant increase in carryover
balances during the high rainfall years that followed the Millennium drought. This was followed
by a period of drawdown as rainfall declined. The increased use of carryover has important
implications for the allocation market. In general, carryover will lead to slightly higher prices in
years when carryover reserves are being accumulated (typically average or wetter years), and
lower prices in years when carryover reserves are drawn down (typically drier years). It also
has implications for where water is used and what it is used for. For example, in the absence of
carryover, most of the water accumulated in carryover accounts in wetter years would have
been used for lower value activities or sold on the allocation market.

There have also been significant changes in the demand for irrigation water in the MDB since the
early 2000s. This is particularly the case in the sMDB where genetic advances and movements in
commodity prices have led to an increase in the demand for water for cotton and almonds and a
decrease in demand for rice, dairy pastures and grapevines (Figure 3). ABARES modelling
suggests that this change in the composition of demand away from some of the more flexible
lower value activities such as pastures and rice to higher value annual activities such as cotton
and perennial activities such as almonds means that the demand for water will be higher at most
water prices. The exception is when prices are very low, in which case demand is estimated to be
similar.

                                                          ABARES
                                                             vii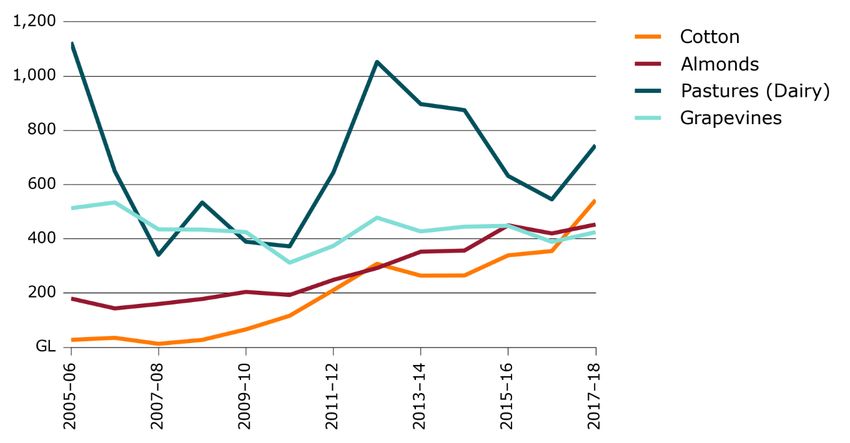
Figure 3 Irrigation water use, selected industries, southern MDB, 2005-06 to 2017-18

Source: ABARES estimate

This shift in demand has led to changes in the location of water use and interregional trade flows
in the sMDB. For example, the increase in demand for water for almonds has occurred mainly in
the Victorian Murray below the Barmah choke, with this expansion facilitated by interregional
trade, mainly from regions above the Barmah choke. Increased demand below the Barmah choke
and tighter restrictions on interregional trade have resulted in trade limits binding more often in
the sMDB. This was particularly the case in 2016–17, when these limits restricted trade into the
downstream Murray trading zones, contributing to higher allocation prices in these zones, and
lower allocation prices in the upstream trading zones (including in the Murrumbidgee, Goulburn
and above Barmah choke trading zones). Research by Aither (2019) suggests that the demand
for water for permanent plantings in the sMDB could increase from current levels as existing
plantings mature. This could lead to an increase in the frequency restrictions on interregional
trade are binding.

Gupta & Hughes (2018) modelled future water prices in the sMDB assuming 2016-17 levels of
water demand, 2016-17 institutional arrangements and a repeat of the historical climate
between 2002-03 and 2016-17. The estimates suggest that there could be a change in the
distribution of future allocation prices in the sMDB, with fewer years with low prices and more
years with moderate to high prices.

                                              ABARES
                                                viii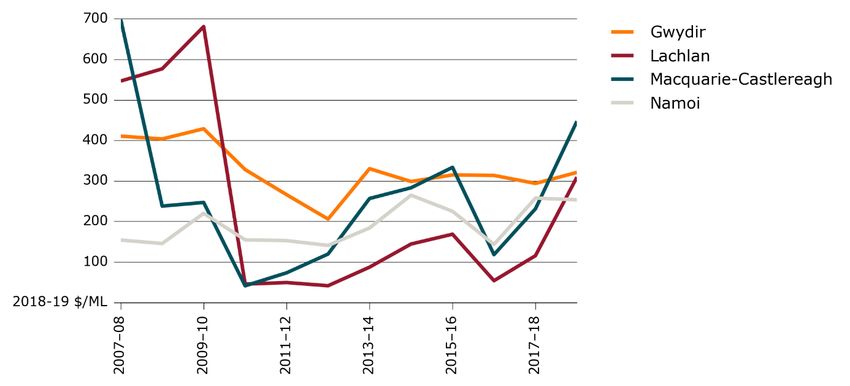
Introduction
The objective of this research is to analyse trends in irrigated agriculture and water markets in
the MDB, and to consider the factors driving changes in these markets.
The findings from this analysis will feed into a wider body of research investigating the
socioeconomic effects of the Murray-Darling Basin Plan, as part of the 2020 review of the plan1.
While other projects in the monitoring and evaluation program will use economic models and
statistical analysis to estimate the effects of the Commonwealth’s water recovery programs on
irrigated agriculture and regional economies in the MDB, this project will provide context for
this other research, identifying the range of factors influencing the supply and demand for
irrigation water. This project is also confined to reporting and analysing trends in irrigated
agriculture rather than for the broader economy, and while it does identify the main factors
influencing irrigated agriculture, it does not attempt to attribute the effects of specific factors to
changes in irrigated agriculture.
The key metrics considered in this study include:
water allocation prices
interregional water trade flows
water availability (allocations, carryover, environmental water)
irrigation area (by activity)
irrigation water use (by activity)
irrigation production (GVIAP by activity)
water use per hectare (by activity).
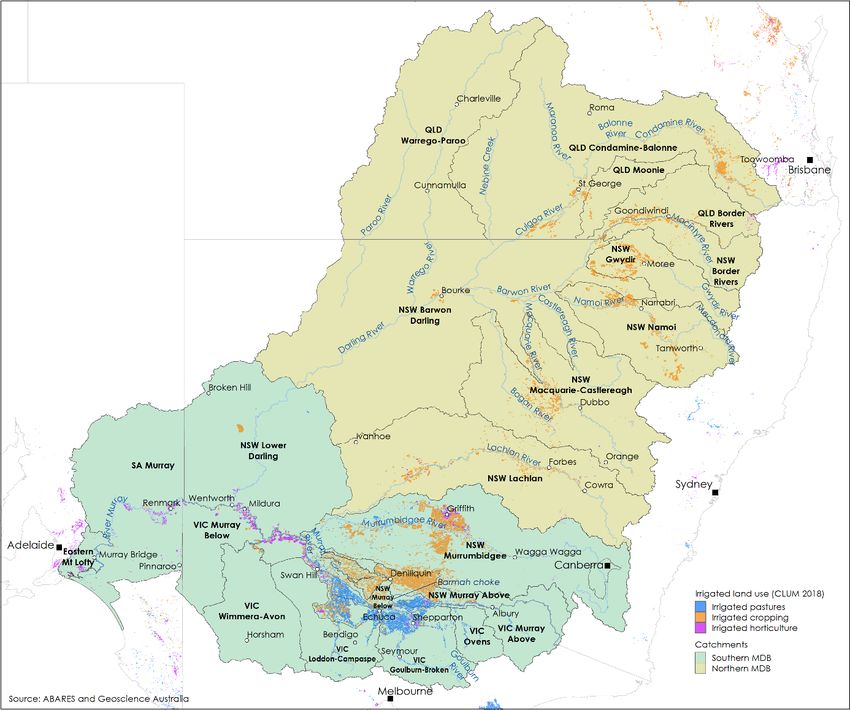
This report will focus on the southern connected Murray-Darling Basin (sMDB), although it will
include some analysis for the northern Basin (see Map 1 for catchments and rivers in the
southern and northern MDB). Many of the factors influencing irrigated agriculture and water
markets in the northern Murray-Darling Basin (nMDB) are similar to those in the sMDB,
including rainfall and inflows, changes in water sharing plans, Commonwealth water recovery
programs and the relaxation in carryover rules. One of the main differences between the sMDB
and nMDB is that there is very little interregional trade in the nMDB due to the disconnected
nature of most of these catchments. The sMDB is also much more reliant on regulated surface
water, where it accounts for 87% of entitlements. In the nMDB, 53% of entitlements are for
1Schedule 12 of the Basin Plan specifies that the Murray-Darling Basin Authority and the Commonwealth
department responsible for water policy (the Department) are jointly responsible for monitoring and
evaluating the socioeconomic effects of the plan. The department responsible for water policy is the
Department of Agriculture, Water and the Environment.
ABARES
1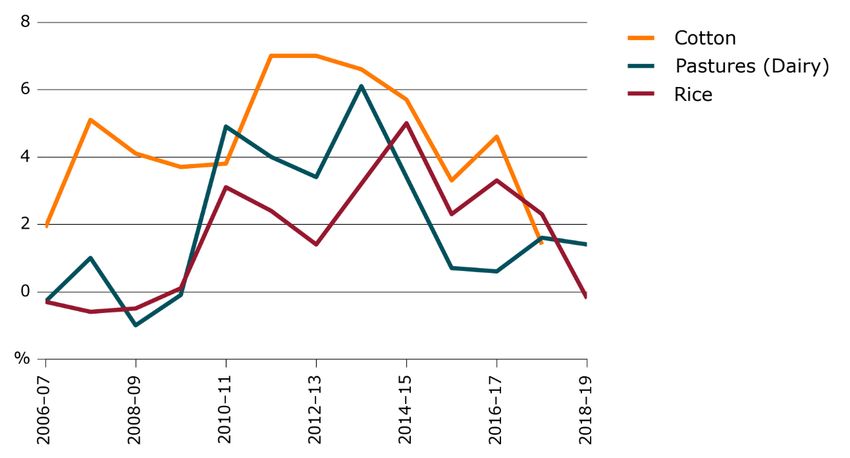
regulated surface water, 26% are for unregulated surface water and 21% are for groundwater
(AWMR 2018). In terms of water use, the sMDB is much more diverse than the nMDB, where
most water is used to irrigate cotton.

Map 1 Murray-Darling Basin catchments and major rivers

Chapter 1 identifies factors contributing to changes in the supply of irrigation water, while
Chapter 2 identifies factors influencing the demand for irrigation water. Chapter 3, in turn,
analyses the likely impacts of these changes on water prices and interregional trade flows in the
MDB since the early 2000s.

                                             ABARES
                                                2
1 Supply factors
Water prices and the level and mix of irrigated activities are a function of the supply and
demand for irrigation water. The main factors that have altered the supply of irrigation water in
recent years include:
Water allocations—the total volume of surface water available for use in a particular year
(determined by storage volumes - mainly a function of rainfall - and state water sharing
plans).
Environmental water—water rights transferred to environmental agencies effectively
reduce the supply of water allocations available for irrigation.
User carryover decisions—decisions by individual water right holders to hold water
allocations in storage within or between years (rather than using or selling allocations).
The type of entities that own water have not been included as determinants of water supply.
While there are concerns that speculators in the water market are manipulating the supply of
water available for irrigation, this issue is beyond the scope of this project. The Australian
Competition & Consumer Commission (ACCC) inquiry into water markets in the MDB will
examine this claim in more detail (ACCC 2019). For context, the Victorian Department of
Environment, Land, Water and Planning (DELWP) released a report in 2019 showing that only
12% of privately held high reliability water shares in northern Victoria were not linked to land,
and that much of this water was likely to be owned by farmers (DELWP 2019). It also found that
only 8% of allocations to these shares were carried over in 2018-19, suggesting that there is
little evidence of hoarding.
The analysis presented in the remainder of this chapter draws heavily on Hughes, Gupta &
Rathakumar (2016) and the Australian Water Markets Report 2016-17 (ABARES 2018).
1.1 Water allocations
Water storages
The supply of water allocations in regulated systems is primarily a function of the volume of
water held in storage, which is mainly a function of rainfall (in unregulated systems allocations
are largely a function of rainfall and inflows).
Figure 4 and Figure 5 show historical changes in rainfall in the southern and northern MDB.
They show that rainfall can be volatile, has been lower than the long-run average (defined here
as 1911-12 to 1999-2000) since 2000-01, and was significantly lower during the Millennium
drought (2000-01 to 2008-09) (17% lower in the sMDB and 11% lower in the nMDB).
Figure 6 shows historical inflows into the sMDB (defined as modelled flows in the River Murray
at Euston assuming historical weather and no extractions). Inflows have been 40% lower than
the long run average since 2000-01, and were 49% lower during the Millennium drought.
ABARES
3Figure 4 Annual rainfall, southern MDB, 1911-12 to 2017-18
900
Average 2000-01 to 2008-09
800
Average 1911-12 to 1999-00
700 Average 2000-01 to 2017-18
600
500
400
300
200
100
mm
1951-52
1911-12
1916-17
1921-22
1926-27
1931-32
1936-37
1941-42
1946-47
1956-57
1961-62
1966-67
1971-72
1976-77
1981-82
1986-87
1991-92
1996-97
2001-02
2006-07
2011-12
2016-17
Note: Annual rainfall is calculated as the sum of average monthly rainfall in the sMDB.
Source: Bureau of Meteorology, ABARES estimate
Figure 5 Annual rainfall, northern MDB, 1911-12 to 2017-18
1 000
900
Average 2000-01 to 2008-09
800
700 Average 1911-12 to 1999-00
600 Average 2000-01 to 2017-18
500
400
300
200
100
mm
1911-12
1916-17
1921-22
1926-27
1931-32
1936-37
1941-42
1946-47
1951-52
1956-57
1961-62
1966-67
1971-72
1976-77
1981-82
1986-87
1991-92
1996-97
2001-02
2006-07
2011-12
2016-17
Note: Annual rainfall is calculated as the sum of average monthly rainfall in the nMDB.
Source: Bureau of Meteorology, ABARES estimate
ABARES
4Figure 6 Annual inflows, southern MDB, 1911-12 to 2017-18
40 000
Average 2000-01 to 2008-09
35 000
30 000 Average 1911-12 to 1999-00
25 000 Average 2000-01 to 2017-18
20 000
15 000
10 000
5 000
GL
1947-48
2001-02
1911-12
1917-18
1923-24
1929-30
1935-36
1941-42
1953-54
1959-60
1965-66
1971-72
1977-78
1983-84
1989-90
1995-96
2007-08
2013-14
Note: Modelled ‘without development’ inflows at Euston on the River Murray. Model estimates assume no water storages,
no irrigation and pre-development land use where the impact of land use change on inflows is considered to be significant,
and where data is available.
Source: Murray Darling Basin Authority
Movements in rainfall and inflows have been reflected in water storage levels (Figure 7 and
Figure 8) and allocations (Figure 9 and Figure 10), with storage levels and allocations falling to
historic lows at the peak of the Millennium drought, and rising rapidly following high rainfall
events in 2010-11, 2011-12 and 2016-17.
Figure 7 Monthly storage volumes, southern MDB, October 2002 to May 2019
Note: The sMDB storage volume is the sum of storage volumes in the Hume Dam, Dartmouth Dam, Yarrawonga Weir, Lake
Victoria, Menindee Lakes, Blowering Dam, Burrinjuck Dam, Lake Eildon, Lake Eppalock, Cairn Curran Reservoir, and
Laanecoorie Reservoir.
Source: Water NSW, SA Water, Goulburn-Murray Water, and MDBA.
ABARES
5Figure 8 Water storage percentages, northern MDB, July 2007 to November 2019
Source: Bureau of Meteorology
Figure 9 Total regulated surface water allocations for irrigation and environmental use,
southern MDB, 2000-01 to 2018-19
Note: Total water supply is defined as the sum of allocations, carryover, and uncontrolled flows, minus within year forfeits.
Source: ABARES estimate
ABARES
6Figure 10 Total regulated surface water allocations for irrigation and environmental use,
NSW northern MDB, 2000-01 to 2018-19
Note: Total water supply is defined as the sum of allocations, carryover, and uncontrolled flows, minus within year forfeits.
No allocation data was collected for Queensland.
Source: ABARES estimate
Research by Cai & Cowan (2008) suggests that in addition to lower annual rainfall, other climatic
factors may have contributed to lower inflows into rivers and dams in recent years. These
include increasing temperatures and changes in the seasonal distribution of rainfall.
Cai & Cowan found the reduction in rainfall in the MDB was greatest in autumn (BoM data shows
that autumn rainfall was 37% lower than the long-run average during the Millennium drought
and has been 16% lower since 2000-01). Autumn rainfall plays an important role in wetting the
soil, which then has a delayed impact on runoff and inflows in winter and spring.
Cai & Cowan also found a relationship between inflows and fluctuations in temperature in the
MDB. Figure 11 shows that annual mean temperatures in the MDB were well above average
during the Millennium drought, and continue to rise. While this research is somewhat dated, it
suggests that a 1 degree Celsius increase in maximum temperature in winter and spring (relative
to the long term average) could lead to a 15% reduction in annual inflow in the MDB.
ABARES
7Figure 11 Annual mean temperature anomaly, MDB, 1910-11 to 2018-19
Source: Bureau of Meteorology
Water sharing plans
The supply of water allocations is also a function of how water is allocated between different
users in water sharing plans prepared by state governments. There have been significant
changes in some water sharing plans over the past 20 years, including new storage reserve
policies and more conservative forecasts for future inflows (Hughes et al. 2013; New South
Wales Government 2009). More conservative storage policies and forecasts for future inflows
can change the timing of allocations, both within years and between years.
1.2 Environmental water recovery
The total supply of water allocations includes allocations to entitlements acquired by
Commonwealth and state governments for the environment. These acquisitions reduce the total
volume of water allocated to irrigation. They do not, however, reduce the volume of water
allocated to entitlements retained by irrigators.
The main programs funded by the Commonwealth in the MDB as part of the Basin Plan include:
Water recovery programs
Water purchases: purchase of water entitlements from irrigators (‘buybacks’) including
the ‘Restoring the Balance in the Murray-Darling Basin’ program.
Irrigation infrastructure improvement projects: Government investments in on and off-
farm irrigation infrastructure in return for water entitlements, including programs
under the Sustainable Rural Water Use and Infrastructure Program (SRWUIP).
SDL adjustment mechanism measures
Supply measures: environmental works and measures that allow Basin Plan
environmental objectives to be achieved with less water, leading to an increase in the
SDLs (a reduction in water recovery volumes).
Efficiency measures: infrastructure projects that achieve water savings, leading to a
decrease in the SDLs (an increase in water available for the environment).
ABARES
8These programs influence the supply of irrigation water in different ways. For example, water
purchases reduce the volume of entitlements and allocations available for irrigation, while
investments in environmental works (supply measures) reduce the volume of water that needs
to be diverted from irrigation to achieve environmental objectives (that is, avoided recovery).
Water savings from investments in off-farm irrigation infrastructure increase the volume of
water available for the environment but do not affect the volume of water available for
irrigation. The impact of investments in on-farm irrigation infrastructure on the supply of
irrigation water is more complex. On the one hand they involve exchanging entitlements for
irrigation infrastructure, leading to a reduction in entitlements and allocations to irrigation.
However, the impact of these investments on production is less than the purchase of an
equivalent volume of water because they increase water use efficiency, increasing the effective
supply of irrigation water. In addition, irrigators retain some of the savings from these
investments.
As at 30 September 2019, 2,105.7 GL of surface water had been recovered for the environment
under the Basin Plan. This comprised 1,942.2 GL recovered by the Commonwealth and 163.5 GL
recovered by the states. Commonwealth recovery included 1,232.1 GL from purchases, 695.2 GL
from investments in infrastructure and 15 GL of gifted water. The regional distribution of total
acquisitions includes 349.6 GL from the nMDB and 1,756.1 GL from the sMDB.
Figure 12 and Figure 13 show Commonwealth water recovery volumes by catchment. They
show that environmental purchases have accounted for the bulk of recovery in most systems,
with most purchases occurring in the Victorian Murray, NSW Murray, Goulburn-Broken and
Murrumbidgee systems in the southern Basin, and in the Condamine-Balonne, Gwydir, Lachlan
and Barwon-Darling systems system in the northern Basin.
Figure 12 Total Commonwealth surface water recovery in the southern MDB, 30
September 2019
Note: The total volume of water recovered is expressed in terms of the long term average annual yield (LTAAY).
Source: Department of Agriculture, Water and the Environment
ABARES
9Figure 13 Total Commonwealth surface water recovery in the northern MDB, 30
September 2019
Note: The volume of water recovered is expressed as LTAAY
Source: Department of Agriculture, Water and the Environment
The Commonwealth has been recovering entitlements for the environment since 2007-08.
Figure 14 shows that this recovery has reduced the total volume of water allocated to irrigation
in the sMDB by over 10% since 2010-11, and by over 18% since 2017-18.
Figure 14 Total water available for irrigation plus environmental water, southern MDB,
2000-01 to 2018-19
Note: Water available for irrigation is defined as the sum of total water supply less environmental allocations.
Environmental allocations are defined as water allocations against entitlements owned by the Commonwealth
Environmental Water Holder (from purchases and on-farm infrastructure).
Source: ABARES estimate
1.3 Carryover
The supply of allocations to irrigation includes ‘carryover’ water (the supply of allocations to the
environment also includes carryover). Carryover water is unused water that users are allowed
to hold in dams between years. This allows irrigators to smooth out annual variations in water
ABARES
10availability. There have been significant changes to carryover rules since 2000, and particularly
since 2007-08. Key changes in the sMDB since 2007–08 include:
2007–08: South Australia and Victoria introduce temporary carryover arrangements
2008–09: Victorian annual carryover limit increased from 30% to 50%
2009–10: Murrumbidgee annual carryover limit increased from 15% to 30%
2010–11: South Australia removes carryover, while Victoria introduces permanent
carryover arrangement in the form of spillable water accounts, with no limit on annual
carryover volumes
2012–13: South Australia adopts a permanent carryover arrangement
2013–14: Victoria applies a 100% limit on annual carryover volumes.
Net changes in irrigation carryover in the sMDB are shown in Figure 15. A net increase in
carryover indicates that irrigators are using less than their current allocation, transferring some
of this allocation for future use, whereas a decrease indicates irrigators are using more than
their current allocation, with this additional water being sourced from irrigators carryover
accounts (that is, irrigators are running down carryover balances).
There were significant increases in net carryover in the sMDB in 2009-10 and 2010-11. These
increases coincided with the relaxation in restrictions on carryover and high rainfall events that
followed the Millennium drought. These carryover balances were drawn down as rainfall
declined, particularly in 2012-13.
There were also significant increases in carryover in northern NSW following the Millennium
drought (Figure 16).
Figure 15 Net change in irrigation carryover in regulated systems, southern MDB, 2000-01
to 2018-19
Note: The net change in carryover is equal to carryover into next year minus carryover from the previous year.
Source: ABARES estimate
ABARES
11Figure 16 Net change in irrigation carryover in regulated systems, NSW northern MDB,
2000-01 to 2017-18
Note: The net change in carryover is equal to carryover into next year minus carryover from the previous year.
Source: ABARES estimate
ABARES
122 Demand factors
The demand for irrigation water in the MDB has changed significantly over the past 20 years. In
cap and trade systems like the MDB, these changes are reflected in changes in water prices and
in movements in water between farms, industries and regions. The main factors influencing the
demand for irrigation water in the MDB include:
The profitability of irrigated activities—changes in water demand often arise from shifts in
the relative prices of inputs and outputs (for example, milk, cotton, rice).
Seasonal conditions—on-farm rainfall is a substitute for irrigation water, so when rainfall in
irrigation areas is higher or lower than expected, the demand for irrigation water also
changes.
Investments in on-farm infrastructure (public or private)—including expansion or
rationalisation of irrigation areas, changes in the mix of irrigation activities or investments
in on-farm water use efficiency – all influence the demand for water allocations.
Each of these drivers is considered in this chapter2. As context for this analysis, it is important to
recognise that measuring long-term changes in irrigation water demand is difficult given
fluctuations in seasonal conditions and water prices. This is particularly the case for annual
activities (annual crops and pastures), where irrigated area and water use can vary dramatically
between wet and dry years. Given this complexity, understanding long run changes in demand
typically requires the use of a model.
ABARES has estimated changes in the demand for irrigation water in the sMDB using a water
trade model. The model assumes that the demand for water is a function of allocation prices, on-
farm rainfall, commodity prices and time. By holding allocation prices fixed at $200 per ML and
rainfall fixed at average values, changes in the demand for water between 2005-06 and 2018-19
were estimated. The results primarily reflect net changes in capital investment (including
disinvestment) over time.
Figure 17 shows the results for individual irrigation activities. The ‘Actual plantings’ scenario
reflects the actual maturity of almond trees in the sMDB in 2005-06 and 2018-19. It shows a
significant increase in the demand for water for cotton and almonds in the sMDB between 2005-
06 and 2018-19. It also shows a reduction in the demand for water for rice and irrigated
pastures (including dairy) at $200 per ML.
2Similar to the supply chapter, the analysis in this chapter draws heavily on Hughes, Gupta &
Rathakumar (2016) and the Australian Water Markets Report 2016-17 (ABARES 2018). In
addition, it draws on Gupta & Hughes (2018).
ABARES
13The ‘Full maturity plantings’ scenario assumes all current plantings of almond trees are fully
mature in 2018-19, and hence demand more water. It has been run to see what could happen to
the demand for water when current plantings reach full maturity (there has been a significajnt
expansion in almond plantings in recent years). The estimates suggest that this expansion could
lead to a 165 GL increase in the demand for water in the sMDB.
Figure 17 Long run change in water demand (2005–06 compared with 2018–19) at a price
of $200/ML, by activity, southern MDB
All irrigation activites
Actual
Cotton plantings/maturity
Almonds
Pastures - hay
Full maturity plantings
Other cereals
Fruit
Other broadacre
Other crops
Grapevines
Vegetables
Pastures dairy
Rice
Pastures - grazing
- 200 - 100 GL 100 200 300 400 500 600 700
2.1 Profitability
The model estimates appear to be consistent with some of the more significant movements in
commodity prices and profitability in the irrigation sector. For example, Figure 18 shows that
cotton prices have been relatively stable since 2006-07, while rice prices were volatile,
increasing early on before falling substantially in the late 2000s. Dairy prices increased initially
before trending down over much of this period. There was also a significant and extended
decline in wine grape prices, although they have recovered to some extent. Almond prices have
also been volatile, falling by just over 50% between 2006-07 and 2011-12, and more than
doubling between 2011-12 and 2015-16. They have moderated since then.
Figure 19 shows that the returns to cotton farming have been greater than to irrigated dairy and
rice farming over most of this period. It is worth noting that the cotton estimates were derived
using survey data for cotton farms in the Condamine-Balonne region in the nMDB due to a lack
of data on cotton farms in the sMDB, It is quite possible that the returns to cotton farms in the
sMDB differ from those in the nMDB.
ABARES
14Figure 18 Commodity price indexes, selected industries, 2006-07 to 2018-19
Note: Prices have been indexed to 2006-07 and adjusted for inflation using the ABS consumer price index. 2018-19 almond
price is an ABARES forecast.
Source: ABARES estimate; ABS Agricultural Commodities (cat. 7121.0), ABS Value of Agricultural Commodities Produced
(cat. 7503.0), ABARES Agricultural Commodities Database (AG764, AG3671, AG817), QLD Cotton Prices, ABARES 2018-19
almond price forecast, and ABS Consumer Price Index (2019) (cat. 6401.0).
Figure 19 Rate of return, selected industries, 2006-07 to 2018-19
Note: Data for 2018-19 are provisional estimates. No data is available for cotton in 2018-19. Rate of return is defined as
farm business profit with interest, lease and rent payments added (adjusted to full equity basis) expressed as a percentage
of total farm capital (excluding capital appreciation). It represents the ability of the farm business to generate a return to all
capital used by the business, including that which is borrowed or leased.
Source: ABARES Murray–Darling Basin Irrigation Survey
The model estimates (Figure 17) are also broadly consistent with estimates of historical
movements in irrigation area and water use by activity in the MDB (these estimates were
ABARES
15derived by ABARES using ABS and industry data). Figures 20 to 23 show that there has been a
significant increase in area irrigated and water use by cotton and almonds. They also show a
decrease in water use by pastures and grapevines.
The reduction in demand for water for irrigated pastures for dairy and other grazing activities is
reflected in water use by these activities remaining significantly lower in the high allocation
years of 2011-12 and 2012-13 than in 2005-06, which was a relatively normal year. And while
irrigated rice did recover to 2005-06 levels (around 100,000 hectares), it has not recovered to
the levels recorded in the late 1990s and early 2000s, when around 150,000 hectares were
planted.
Figure 20 Irrigated area, selected broadacre industries and dairy, southern MDB, 2005-06
to 2017-18
Source: ABARES estimate
Figure 21 Irrigation water use, selected broadacre industries and dairy, southern MDB,
2005-06 to 2017-18
ABARES
16Source: ABARES estimate
Figure 22 Irrigated area, horticulture, southern MDB, 2005-06 to 2017-18
Source: ABARES estimate
Figure 23 Irrigation water use, horticulture, southern MDB, 2005-06 to 2017-18
Source: ABARES estimate
The data also shows that irrigation in the nMDB is much less diverse than in the sMDB, with
cotton dominating in most catchments, and irrigated pasture and cereals accounting for much of
the remainder (Figure 24). Figure 25 shows that irrigated agriculture in the nMDB is highly
variable (the nMDB has smaller dams than the sMDB and is more reliant on unregulated water).
ABARES
17Figure 24 Irrigation water use, by activity and catchment, northern MDB, 2017-18
Source: ABARES estimate
Figure 25 Irrigation water use, selected broadacre industries and dairy, northern MDB,
2005-06 to 2017-18
Note: There is no data available for dairy from 2005-06 to 2010-11
Source: ABARES estimate
Changes in the demand for water by activity have also been reflected in regional trends in water
use in the sMDB. For example, there has been a significant expansion in water use and area
planted to irrigated almonds in the Victorian Murray below the Barmah choke between 2005-06
and 2017-18 (Figure 26 and Figure 27).
ABARES
18Figure 26 Irrigated area, almonds, selected regions, 2005-06 to 2017-18
Source: ABARES estimate
Figure 27 Irrigation water use, almonds, selected regions, 2005-06 to 2017-18
Source: ABARES estimate
Research by the Almond Board of Australia (ABA) indicates that almonds are highly suitable for
production in southern Australia, delivering high returns, not being affected by fruit fly, are
durable and have a long shelf life compared to fruit and vegetables (ABA 2019). ABA data
indicates that the area planted to almonds in Australia has increased from 3,500 hectares in
2000 to around 45,000 hectares in 2018 (ABA, 2019). The data also shows that 53% of these
plantings are in the Victorian Sunraysia (located in the Victorian Murray below the Barmah
choke), 24% are in the NSW Riverina and 20% are in the SA Riverland. It also shows that many
of these plantings are not yet fully mature. Overall, these changes appear to have increased
horticultural water demand in the sMDB.
ABARES
19Similarly, the shift away from rice toward cotton is likely to have been driven by a mix of the
superior profitability of cotton and genetic advances that allow cotton to be grown in the sMDB.
Much of the expansion in cotton has occurred in the Murrumbidgee system, where cotton
plantings have increased from 3,000 hectares in 2005-06 to over 56,000 hectares in 2017-18
(Figure 28). The volume of water used for cotton has also increased, from 26 GL in 2005-06 to
536 GL in 2017-18 (Figure 29).
Figure 28 Irrigated area, rice and cotton, Murrumbidgee, 2005-06 to 2017-18
Source: ABARES estimate
Figure 29 Irrigation water use, rice and cotton, Murrumbidgee, 2005-06 to 2017-18
Source: ABARES estimate
ABARES
202.2 Seasonal conditions
The demand for irrigation water is also influenced by water application rates, which are
influenced by on-farm rainfall and temperature, irrigation technologies, the mix of irrigated
activities, and for perennial horticulture, the age of plantings. Farmers can also adjust
application rates within and between seasons based on expectations about allocation and
commodity prices.
Seasonal conditions influence both the supply and demand for irrigation water. Figure 4 and
Figure 5 show that rainfall in the MDB was lower than average during the Millennium drought,
and has been lower since 2000-01, while Figure 11 shows that temperatures have been
increasing over the past 20 years. The reduction in rainfall and increase in temperature is likely
to have increased the volume of irrigation water needed to sustain a hectare of crop during the
Millennium drought.
Seasonal conditions can also influence the source of water used for irrigation. For example,
irrigators who use surface water and groundwater would be expected to increase their use of
groundwater in years when surface water availability is constrained. This would appear to be
reflected in Figure 30, which shows that groundwater use was relatively high between 2006-07
and 2008-09, which was the peak of the Millennium drought, and decreased as seasonal
conditions improved.
Figure 30 Farm groundwater use, MDB, 2005-06 to 2017-18
Note: No data available for 2007-08.
Source: ABS
2.3 Investments in on-farm irrigation infrastructure
Investments in on-farm irrigation infrastructure can influence the demand for water in several
ways. For example, they can increase water use efficiency, reducing the volume of water needed
ABARES
21to irrigate a hectare of crop. They can also increase the productivity and profitability of irrigated
activities, which can lead to an increase in the demand for water.
Farmers have made substantial investments in on-farm irrigation infrastructure over time, while
the Commonwealth has invested heavily in irrigation infrastructure aimed at increasing water
use efficiency, with some of the savings transferred to the Commonwealth for the environment.
Some examples of investments in on-farm infrastructure include:
installing new or upgrading existing irrigation infrastructure, including automated water
management systems and sensing equipment
improving irrigated area layout to increase on-farm irrigation efficiency (for example, laser
grading, bank-less irrigation channels, decommissioning old irrigation infrastructure)
converting flood irrigation systems to surface or sub-surface drip systems or overhead
spray systems (such as lateral move or centre pivots)
installing ancillary equipment needed to operate new or upgraded irrigation systems (for
example, computers and pumps).
Figure 31 and Figure 32 show water use per hectare for a range of irrigated broadacre and
horticulture crops in the Murray-Darling Basin between 2005-06 and 2017-18. With the
exception of almonds and cotton, there appears to be no consistent trend in water use per
hectare for most activities when looking at the raw data. This is not necessarily surprising, with
any improvements in water use efficiency from investments in more efficient irrigation
technologies likely to have been offset by lower rainfall and higher temperatures.
The increase in water use per hectare for almonds is likely to reflect the expansion in almond
plantings and the age profile of these plantings. Almonds use around 14 ML per hectare when
fully mature (ABA 2019), which is high compared to most other irrigated activities. Almond
trees take three years to bear a crop and seven years to reach maturity, with water application
rates increasing as plantings mature. The decline in water use per hectare in 2006-07 is likely to
reflect the substantial expansion in new plantings in the mid-2000s (younger trees require less
water), while the upward trend after that is likely to reflect the maturing of these plantings.
Similarly, the recent dip in water use per hectare is likely to reflect to some extent the increase
in new plantings since 2014-15. Data supplied by the Australian Almond Board shows that as of
2018, 30.5% (13,763 hectares) of almond plantings are not yet bearing a crop, and that 7% of
bearing trees are not fully mature (ABA 2019).
ABARES
22Figure 31 Irrigation water use per hectare, selected irrigated broadacre industries and
dairy, MDB, 2005-06 to 2017-18
Source: ABARES estimate
Figure 32 Irrigation water use per hectare, selected irrigated horticulture industries, MDB,
2005-06 to 2017-18
Source: ABARES estimate
ABARES
233 Water prices and trade flows
The total volume of water available for use in the MDB is capped, with changes in the supply and
demand for water reflected in the price of water and movements in water between farms,
industries and regions. The disconnected nature of most river systems in the nMDB means that
most water market activity in the nMDB is between farmers within a region. In contrast, the high
degree of hydrological connectivity in the sMDB allows for relatively unconstrained trade in
water entitlements and water allocations between systems. The sMDB is Australia’s most
significant water market, and is widely regarded as one of the most sophisticated water markets
in the world (ABARES 2018).
This chapter contains analysis of water prices and trade over time, and considers the key drivers
of these changes.
3.1 Entitlement prices
The price of water entitlements essentially reflect the discounted returns irrigators expect to
earn from water allocated to entitlements. Figure 33 shows that there has been a significant
increase in entitlement prices in the sMDB in recent years.
While more research is needed to identify the factors driving this increase, they are likely to
reflect to some extent an increase in the demand for water for higher value crops such as
almonds and cotton, and the reduction in supply to irrigation associated with Commonwealth
water recovery.
Higher water prices may also reflect a growing recognition of long-term trends in climate,
including lower average rainfall and increasing temperatures. These climatic factors affect the
supply and demand for water. For example, lower on-farm rainfall and higher temperatures are
likely to increase the demand for water. The supply side effects are more complex, with lower
rainfall likely to reduce the reliability of water entitlements, especially lower security
entitlements. The net effect on entitlement prices will depend on the extent to which any
reduction in reliability is offset by an increase in allocation prices. Figure 33 shows that the price
of high security entitlements in the Murrumbidgee increased (in real terms) by 195% between
2012-13 and 2018-19, while the price of general security entitlements increased by 143%.
The remainder of this chapter focuses on the drivers of change in annual water allocation prices
and trade.
ABARES
24Figure 33 Entitlement prices for selected entitlement classes, southern MDB, 2009-10 to
2018-19
Note: Data was cleaned using ABARES price cleaning methods as described in Sanders et al. (2019) and adjusted for
inflation.
Source: BOM national water register, various market reports, and broker websites; ABS Consumer Price Index (2019) (cat.
6401.0).
3.2 Weather and climate
Historical data shows that water allocation prices are mainly driven by changes in water supply.
The main factors influencing water supply in regulated systems are the volume of water held in
storages and inflows into these storages. Figure 34 shows the historical relationship between
allocation prices and storage volumes in the sMDB. It shows allocation prices rising to
unprecedented highs during the peak of the Millennium drought before declining to near zero
following the 2011, 2012 and 2016 floods. Prices have also risen during the latest drought.
Figure 34 Monthly allocation prices and storage volumes, southern MDB, July 2005 to May
2019
Note: Data was cleaned using ABARES price cleaning methods as described in Sanders et al. (2019) and adjusted for
inflation.
ABARES
25You can also read