Using the MMSE-2 to Measure Cognitive Deterioration in a Sample of Psychiatric Patients Living in Puerto Rico - MDPI
←
→
Page content transcription
If your browser does not render page correctly, please read the page content below
International Journal of
               Environmental Research
               and Public Health

Article
Using the MMSE-2 to Measure Cognitive Deterioration in a
Sample of Psychiatric Patients Living in Puerto Rico
Sandra I. Ralat

                                            Medical Sciences Campus, University of Puerto Rico, San Juan, PR 00936, USA; sandra.ralat@upr.edu

                                            Abstract: Patients with psychiatric disorders often have cognitive impairment. Several deficits have
                                            been recognized in patients with mood and/or psychotic disorders. We hypothesized that differences
                                            in the levels of deterioration exist between patients with bipolar disorder (BD), major depressive
                                            disorder (MDD), and schizoaffective disorder (SAD). The mini-mental state examination, version 2
                                            (MMSE-2), was used with a sample of 160 psychiatric patients to measure cognitive impairment. The
                                            aims of this study were as follows: (1) To characterize the differences in cognitive deterioration among
                                            patients diagnosed with BD, MDD, or SAD; (2) to explore item difficulty and cutoff points based
                                            on the educational level and other variables which are significant for our psychiatric population.
                                            Descriptive statistics were used for categorical variables. In addition, a Bonferroni post hoc test
                                            and an analysis of covariance (ANCOVA) for the continuous dependent variable were performed.
                                  Psychiatric diagnosis and years of education adjusted by several covariates proved to be significant.

                                            The 25th percentile were obtained to establish the cutoff points. Each item’s difficulty was analyzed
Citation: Ralat, S.I. Using the
                                            using means and chi-square tests. Cognitive deterioration was found in 51% of the patients with
MMSE-2 to Measure Cognitive
                                            SAD, in 31% with BD, and in 18% with MDD.
Deterioration in a Sample of
Psychiatric Patients Living in Puerto
                                            Keywords: cognitive deterioration; psychiatric patients; MMSE-2; Puerto Rico
Rico. Int. J. Environ. Res. Public Health
2021, 18, 1694. https://doi.org/
10.3390/ijerph18041694

Academic Editors: Elizabeth O. Ofil,        1. Introduction
Emma Fernandez-Repollet, Richard                  Identifying cognitive impairment in psychiatric patients has an essential role in thera-
J. Noel, Daniel F. Sarpong,                 peutic interventions. To improve the usefulness of a given therapeutic intervention and,
Magda Shaheen, Paul B. Tchounwou,           as a result, the overall functioning of the psychiatric patient with whom the intervention
Kristen J. Wells                            is to be employed, the level of that patient’s cognitive impairment must be determined.
and Richard Yanagihara                      These cognitive deficits can be recognized early in the trajectories of these disorders. How-
Received: 8 January 2021
                                            ever, there are no consistent results on which domains are in deficits in patients with a
Accepted: 5 February 2021
                                            psychiatric illness. Several studies have compared cognitive deterioration in psychiatric
Published: 10 February 2021
                                            patients, indicating that these patients had comparable profiles [1]. Little difference has
                                            been found in performance in terms of memory and executive function for schizoaffective
Publisher’s Note: MDPI stays neutral
                                            disorder (SAD) and bipolar disorder (BD) patients [2]. A significant overlap of impairment
with regard to jurisdictional claims in
                                            in the profiles of the neuropsychological tests of patients with mood disorders and of
published maps and institutional affil-
                                            those with SAD has been found by other investigators [3]. Nevertheless, other studies
iations.
                                            found that patients with SAD exhibit a pattern of cognitive impairment which is similar
                                            to patterns exhibited by patients with schizophrenia, but distinct from those with major
                                            depressive disorder (MDD) or BD [4]. Patients with BD show neurocognitive impairment,
                                            with a large degree of heterogeneity among them [5]. In other words, SAD is distinct from
Copyright: © 2021 by the author.
                                            mood disorders at the cognitive level [2]. In summary, some findings suggest that there are
Licensee MDPI, Basel, Switzerland.
                                            similarities between the neuropsychological test profiles of these patients [5], while others
This article is an open access article
                                            have found that patients with BD (without a history of psychosis) tend to have greater
distributed under the terms and
                                            levels of cognitive dysfunction than do patients with MDD [6].
conditions of the Creative Commons
                                                  Cognition is the processing of information. Basic and higher levels of cognitive
Attribution (CC BY) license (https://
creativecommons.org/licenses/by/
                                            functions, such as attention, working memory, long-term memory, perception, decision
4.0/).
                                            making, executive control, and speech and language are all related to and affected by

Int. J. Environ. Res. Public Health 2021, 18, 1694. https://doi.org/10.3390/ijerph18041694                     https://www.mdpi.com/journal/ijerph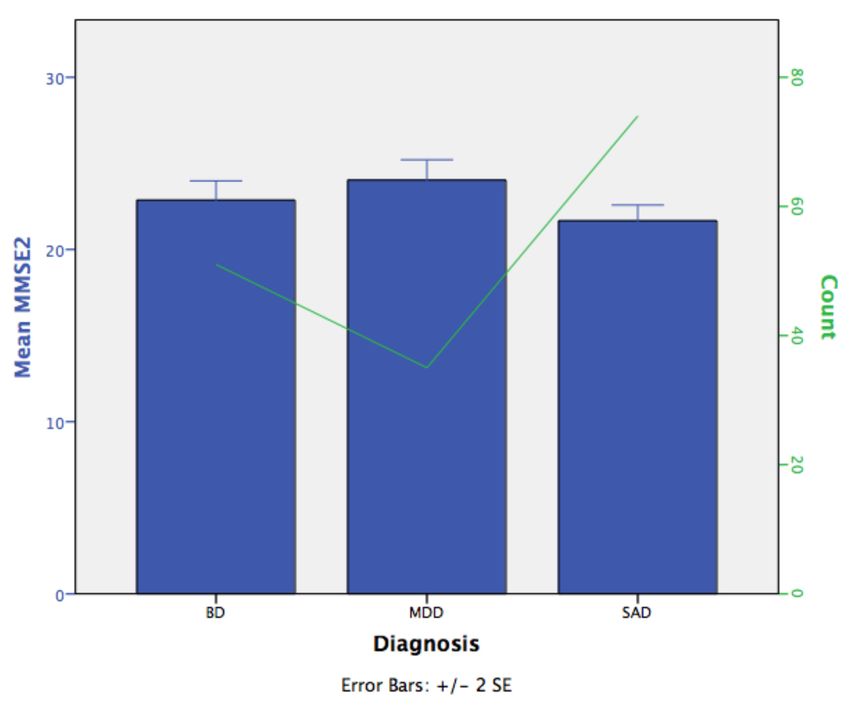
Int. J. Environ. Res. Public Health 2021, 18, 1694                                                                                2 of 13

                                        cognition [7]. A person who has trouble remembering, concentrating, learning, and/or
                                        making decisions that affect everyday life is said to have cognitive impairments [8]. By
                                        detecting cognitive deterioration, mental health workers could work toward enhancing
                                        both the psychosocial functioning and quality of life of these patients, both of which
                                        improvements are sound therapeutic clinical targets.
                                             The mini-mental state examination (MMSE) is one of the most widely used screening
                                        tests for research. It is also used to make clinical assessments, with the aim of detecting
                                        cognitive impairment. This is a screening test, not a diagnostic test [9–12].
                                             This screening test was originally developed by Folstein in 1975 [6]. In their 1987
                                        study, Bird et al. [12] used the MMSE in a sample of Puerto Rican participants and found
                                        significantly higher cognitive impairment in that population than had been reported in
                                        US communities in that year [12]. The investigators also used the sample to study the
                                        impact of demographic variables together with other psychiatric diagnoses on MMSE
                                        scores. Possible explanations for the higher number of cases were that the Spanish version
                                        of the instrument may have yielded a greater number of errors; demographic variables,
                                        including the education level, may have affected the scores; or there may indeed have been
                                        a higher proportion of cognitively impaired people in PR than in the mainland.
                                             Thirty-three years have passed since that study, and some of the items on the current
                                        translated (for the Hispanic community) version have changed. Several versions (and in
                                        different languages) have been developed and validated. In Puerto Rico, at the clinical
                                        level, the MMSE is used in conjunction with other diagnostic tests. We are not aware of
                                        any recent publications on this subject describing psychiatric patients in Puerto Rico. In
                                        searches through a number of open access journals, at least, nothing was found.
                                             In different countries where the MMSE has been used, the question of cutoff points
                                        has arisen since there is no gold standard for this instrument. Several authors have written
                                        about the influence of sociodemographic variables (education, age, sex, etc.) over the
                                        cutoff score, but none can agree which is the most appropriate for detecting cognitive
                                        impairment [9,10]. For that reason, the use of different cutoffs, depending on years of
                                        education, is justified by the literature in order to decrease the number of false-positive
                                        results. For example, Crum et al. [10] recommended a cutoff score of 19 for persons with
                                        0 to 4 years of education; a cutoff score of 27 for those with 9 to 12 years of education;
                                        and, finally, a cutoff score of 29 for those with a college education or higher, using the 25th
                                        percentile (lower quartile) of the MMSE score. Using different cutoff points was important
                                        since people with lower levels of education had lower scores on the MMSE, for that reason,
                                        it was necessary to adjust for the number of years of schooling. The standard cutoff score
                                        of 23 is the cut point which is still used worldwide (23 cases/24 non-cases) [11,13].
                                             The aims of this study were as follows: (1) To characterize the differences in cognitive
                                        deterioration in patients with a diagnosis of BD, MDD, or SAD; (2) to explore item difficulty
                                        and the cutoff points based on educational and other variables which are significant for our
                                        population. In this study, the MMSE-2 was analyzed with a sample of patients to measure
                                        cognitive impairment. The research questions were “Can the MMSE-2 detect different
                                        levels of cognitive deterioration in these patients?” and “What are the possible cutoff points
                                        (adjusted by sociodemographic variables)?” I hypothesized that differences in the levels
                                        of deterioration for the different diagnosis categories exist and also that there would be
                                        different cutoff points for the instrument. Statistical methods for determining the cutoff
                                        points fall into two broad categories: Data oriented and results oriented [14]. Data-oriented
                                        methods are based on the calculation of quantiles, while results-oriented methods provide
                                        a cutoff value corresponding to the most significant relationship with a given result. They
                                        also assess the discriminative capacity of the diagnostic test, which is the ability of the test
                                        to differentiate healthy versus sick subjects [14]. Finally, the difficulty of the items on the
                                        MMSE-2 are presented (for the total sample and by diagnosis).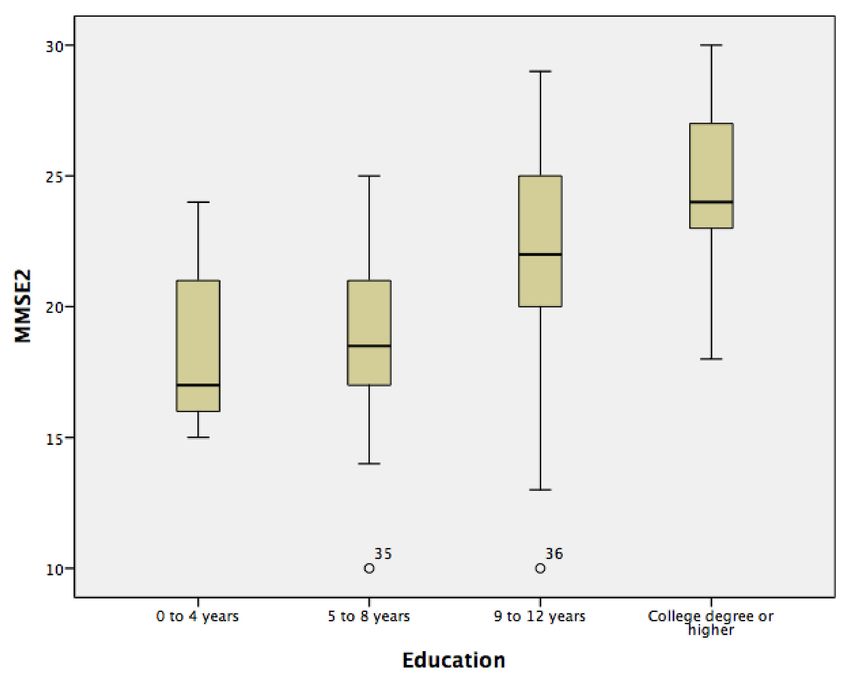
Int. J. Environ. Res. Public Health 2021, 18, 1694                                                                               3 of 13

                                        2. Materials and Methods
                                        2.1. Participants
                                             The data for the study described herein were drawn from another independent re-
                                        search study by the author [15]. We examined the MMSE-2 scores of 160 psychiatric patients
                                        who had been recruited from the Clinic of Albizu University in the San Juan area and
                                        from the outpatient and home-visit program of the Mental Health and Substance Abuse
                                        Administration. This cross-sectional study was approved by the institutional review board
                                        of the University of Puerto Rico, Medical Sciences Campus. The participants had BD, MDD,
                                        or SAD and ranged in age from 21 to 60 years.
                                             A clinical psychologist or a social worker at each facility invited a given possible
                                        candidate to participate in the study. Only persons with a diagnosis of BD, MDD, or
                                        SAD were referred. After the initial approach, the PI was notified that she should contact
                                        the candidate. Before their enrollment in the study, potential participants provided a
                                        signed consent form. All the participants answered both a questionnaire that elicited so-
                                        ciodemographic information and verbal questions intended to gather mental and physical
                                        health data.
                                             To meet the inclusion criteria, the participant had to have a diagnosis of BD, MDD, or
                                        SAD and had to be taking medication for his/her condition. The exclusion criteria were
                                        (the participant’s) having a substance abuse problem at the time of the interview or being
                                        in the midst of a suicidal crisis. Only 10% of the sample came from the private clinic of
                                        the academic institution. Of them, eight participants had BD and the other had MDD. The
                                        rest of the participants were referred from the outpatient sites and several homes where
                                        patients were living at the moment of the study. This was a convenience sample.

                                        2.2. Instruments
                                              The MMSE-2, Spanish version, assesses the cognitive status of an adult, using 11
                                        domains (having a total of 30 items). These domains are registration, recall, orientation to
                                        time, orientation to place, attention and calculation, naming, repetition, comprehension,
                                        reading, writing, and drawing. This test can be used to screen for cognitive impairment.
                                        The maximum score that can be obtained is 30, where the score is indicative of no cog-
                                        nitive impairment. A score of 24 to 30 is considered normal [10,11]; 19 to 23 indicates
                                        mild cognitive impairment; 10 to 18, moderate cognitive impairment; and 0 to 9, severe
                                        cognitive impairment.
                                              Baseline demographic measures were made, and the clinical characteristics of the
                                        subjects were determined (see Table 1). A statistical analysis was done using the IBM SPSS
                                        version 21 software. The internal consistency of the MMSE-2 was assessed by computing
                                        Cronbach’s alpha coefficient for this sample. We compared the MMSE-2 scores and so-
                                        ciodemographic variables of patients with BD, MDD, and SAD using several statistics. The
                                        statistical significance was set at α = 0.05. To review the cutoffs adjusted for education, the
                                        participants were subdivided into the same four age groups (referring to the educational
                                        level) which were used by Crum et al. [9] (see Table 2). Descriptive statistics were used for
                                        categorical variables. In addition, a Bonferroni post hoc test and an analysis of covariance
                                        (ANCOVA) for the continuous dependent variable were performed.
Int. J. Environ. Res. Public Health 2021, 18, 1694 4 of 13
Table 1. Sociodemographic characteristics and mental/physical health data.
Variable BD MDD SAD
χ2 p-Value
Crosstabulation % % %
Gender M F M F M F 10.594 0.005
41 59 14 86 46 54
Age in years 21.675 0.154
21–24 3.9 2.9 5.4
25–29 11.8 0.0 8.1
30–34 5.9 5.7 12.2
35–39 5.9 5.7 9.5
40–44 21.6 11.4 12.2
45–49 11.8 2.9 10.8
50–54 15.7 28.6 23.0
55–59 13.7 20.0 14.9
60 9.8 22.9 4.1
Education 4.146 0.657
0–4 years 0.0 5.7 4.1
5–8 years 5.9 8.6 10.8
9–12 years 45.1 45.7 45.9
College or higher (13±) 49.0 40.0 39.2
Residence 54.981 0.000
Own 15.7 34.3 1.4
Rent 11.8 17.1 8.1
Public housing 0 5.7 0
Live with family 7.8 17.1 4.1
Group home 15.7 0 13.5
Long-term home 7.8 0 13.5
Substitute home 31.4 11.4 50
Transitional home 9.8 14.3 9.5
Lifestyle
Unhealthy diet 29.4 51.4 18.9 12.105 0.002
Exercise 52.9 60 48.6 1.234 0.540
Smoking 49 80 54.1 9.122 0.010
High levels of stress 49 80 54.1 9.122 0.010
Medical comorbidities
Hypertension 35.3 48.6 29.7 3.682 0.159
Hypothyroidism 28.6 25.7 31 0.324 0.851
Asthma 20.4 20.0 21.1 0.021 0.990
Diabetes 21.6 25.7 13.5 5.338 0.254
Hypoglycemia 0 5.7 4.1
High cholesterol 27.5 28.6 31.1 0.206 0.902
Weight-related health
5.517 0.479
problemInt. J. Environ. Res. Public Health 2021, 18, 1694 5 of 13
Table 1. Cont.
Variable BD MDD SAD
χ2 p-Value
Crosstabulation % % %
Obesity BMI > 30 kg2 43.1 45.7 45.9
Overweight 33.3 42.9 32.4
Underweight 0 2.9 4.1
Non-obesity 23.5 8.6 17.6
Number of medications 29.783 0.003
One 0 3 0
Two 2 5.7 2.7
Three 13.7 11.4 4.1
Four to six 47.1 45.7 41.9
Seven to nine 15.7 5.7 18.9
10 or more 19.6 8.6 29.7
Table 2. The 25th percentiles are the cutoff points for each educational level (to decrease the number
of false-positive results).
Years of Education
0–4 Years 5–8 Years 9–12 Years 13± Years
N Cases 5 14 73 68
Mean 18.60 18.79 21.75 24.50
Median 17.00 18.50 22.00 24.00
Standard deviation 3.782 3.906 3.778 3.059
Range 9 15 19 12
25 16 17 20 23
Percentiles 50 17.00 18.50 22.00 24.00
75 22.50 21.25 25.00 27.00
To establish the cutoff points, 25th percentiles were used, and item difficulty was
analyzed using means and chi-square tests.
3. Results
3.1. Sample Characteristics
Forty-six percent of the participants had SAD; 32%, BD; and 22%, MDD. The mean
age of the participants was 45.5 years (SD = 11.1 years; range, 21–60 years). Sixty-three
percent were female. In regard to education, 6.3% had completed elementary school, only;
16.9% had completed middle school; 36% had completed high school; 11% had attended a
technical college; 6% had an associate degree; 8.1% had a bachelor’s degree; 2.5% had a
master’s degree; and 14.4% did not complete a university degree. The mean number of
years of education was 11.9% (SD = 3.13 years). The marital status of the majority of the
sample by diagnosis was single (χ2 = 25,750; p = 0.004). More detailed descriptions of this
sample’s characteristics are reported in Table 1 (by diagnosis), with crosstabulation using
chi-square analyses.
3.2. Statistics
For this sample, the MMSE-2 yielded a Cronbach’s alpha coefficient of 0.81. This is
a very good level of reliability [16]. We conducted a one-way ANCOVA to analyze theseInt. J. Environ. Res. Public Health 2021, 18, 1694 6 of 13
data. Unadjusted means are presented, unless otherwise stated. The participants with
MDD obtained a mean score of 24.03 (SD = 3.49; n = 35). BD participants obtained a mean
score of 22.86 (SD = 4.0; n = 51). The participants with SAD obtained a mean score of 21.66
(SD = 3.95; n = 74). The MMSE-2 scores of the MDD participants were greater than those of
the BDD and SAD participants.
Data are the adjusted mean ± standard error (SE), unless otherwise stated. The
MMSE-2 scores were greater for the MDD participants (24.35 ± 0.60) than they were for
both the BD participants (22.55 ± 0.48) and the SAD participants (21.73 ± 0.40).
After adjusting for education, gender, diet, and smoking, there was a statistically sig-
nificant difference in the MMSE-2 scores between the diagnosis categories (F(2, 153) = 6.28;
p = 0.002, η2 = 0.076). As expected, that specific difference in MMSE-2 scores observed
between the diagnosis groups remains after adjusting by the covariates. By confirming that
the MMSE-2 can in fact detect differing levels of cognitive deterioration in patients with
BD, MDD, and SAD, these results provided us with an answer to our first question.
Bonferroni post hoc comparisons examined the differences between groups (p < 0.05).
MMSE-2 scores were statistically significantly greater in the MDD participants vs. the
SAD participants (mean difference of 2.62 (95% CI, 0.828–4.41), p < 0.002). The differences
between the MMSE-2 scores of the BD and MDD participants were not significant (mean
difference of 1.79 (95% CI, −3.69–0.106), p < 0.071); neither were those between the BD
and SAD participants (mean difference of 0.823 (95% CI, −0.673–2.32), p < 0.555). The
participants with SAD had more cognitive impairment than did those with MDD. Figure 1
shows the SEs of the means of the MMSE-2 scores across the diagnosis categories. The
number of cases by diagnosis is shown with the line that runs through the bars.
Figure 1. The standard errors (SEs) of the means of mini-mental state examination (MMSE-2) scores
across the diagnosis categories.
We found education to be a significant covariate. The results are the following:
F(1, 153) = 45.78 (p = 0.000; η2 = 0.23).
Gender (F(1, 153) = 1.14; p = 0.288) and diet (F(1, 153) = 2.89; p = 0.091) were
not significant covariates. However, smoking was a significant covariate, having an
F(1, 153) = 4.02; p = 0.047; η2 = 0.026.
Another ANCOVA was performed, this one on the estimated MMSE-2 scores and
with years of education as the independent variable and age as a covariate. The means
and SDs are in Table 2. Data are the adjusted mean ± SE, unless otherwise stated. TheInt. J. Environ. Res. Public Health 2021, 18, 1694 7 of 13
MMSE-2 scores were greater in participants with a level of education reaching from college
through a higher degree (13±) (24.48 ± 0.43) compared to individuals with 9 to 12 years
of education (21.76 ± 0.41), 5 to 8 years of education (18.79 ± 0.94) or 0 to 4 years of
education (18.72 ± 1.58). The more years of education a person had, the better his or her
score on the MMSE-2 was, as previous literature has documented [10–12]. Figure 2 shows
the distribution of the MMSE-2 scores across years of education.
Figure 2. The distribution of MMSE-2 scores across years of education.
Bonferroni post hoc comparisons examined differences between groups (p < 0.05).
MMSE-2 scores were statistically significantly greater in the college degree or higher
(13 ± years of education) participants vs. the participants with 0 to 4 years of education
(mean difference of 5.76 (95% CI, 1.37–10.15), p < 0.004), the participants with 5 to 8 years
(mean difference of 5.69 (95% CI, 2.93–8.44), p < 0.000), and the participants with 9 to
12 years (mean difference of 2.72 (95% CI, 1.13–4.30), p < 0.555).
After adjusting for age, there was a statistically significant difference in the MMSE-2
scores between the years of education, F(3, 155) = 15.22; p = 0.000, η2 = 0.23. Age as a
covariate was not significant (F(1, 155) = 0.346; p = 0.557).
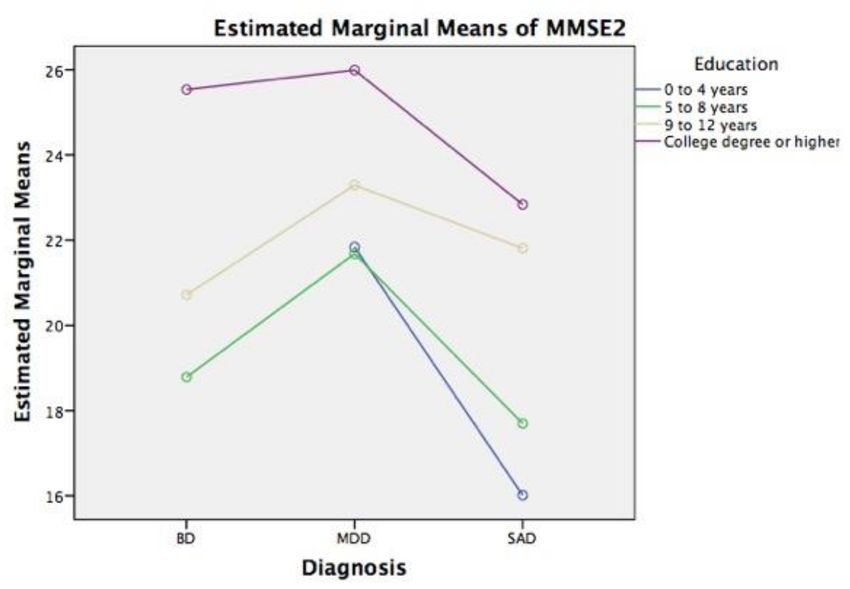
The Figure 3 below shows the estimated marginal means of the MMSE-2 scores across
the independent variables and covariates.Int. J. Environ. Res. Public Health 2021, 18, 1694 8 of 13
Figure 3. Estimated marginal means of MMSE-2 scores across the diagnosis and education categories,
adjusting by smoking, diet, and gender, as covariates.
After using the 25th percentile cutoff points as a reference, in order to decrease the
number of false-positive results, we found the following: The 25th percentile for the lowest
number of years of education (0–4 years) was around 16 (Table 2), which is similar to what
was found by Bird et al., (1987). For the group possessing 5 to 8 years of education, the 25th
percentile was 17, and it was 20 for the patients having 9 to 12 years of education. For the
sample members having the highest levels of education, (13± years), the 25th percentile
was 23. In summary, 64% of the participants were identified as not having any cognitive
impairment, whereas 36% were found to have some degree of cognitive impairment.
According to the MMSE-2, looking at the entire sample, cognitive deterioration was
found in 51% of the patients with SAD, 31% of those with BD, and 18% of those with MDD.
Regarding the MMSE-2 total scores (controlling for years of education and diagnosis),
the distribution of normal vs. cognitive impairment (signified by a score of 23 or lower)
was as follows: 59.5% of the SAD patients had scores less than or equal to 23; 52.9% of the
BD patients and 45.7% of the MDD patients also had such scores (see Table 3).
3.3. Item Difficulty
Table 4 shows the means of item difficulty. We wanted to determine whether there
were any differences in the responses of the participants by the diagnosis category, while
also taking into consideration the item difficulty. These means were calculated by adding
the scores of all the sample participants for a given item and dividing it by the number of
scores [17]. The mean for each binary item is from 0 to 1. A mean close to or equal to 1
represents an easy item. A mean close to 0 represents a difficult item. Each item’s mean
was calculated separately for the whole sample and by psychiatric diagnosis. A score of 1
indicates that all the participants answered that item (further indicating that the said item
was a very easy one).Int. J. Environ. Res. Public Health 2021, 18, 1694 9 of 13
Table 3. MMSE-2 score by the number of years of education and diagnosis.
MMSE-2 Results
Diagnosis Normal Cognitive Impairment Total (%)
(>24 Score) (Int. J. Environ. Res. Public Health 2021, 18, 1694 10 of 13
Table 4. Cont.
MMSE-2 Items Mean, All Mean, BD Mean, MDD Mean, SAD
Orientation to place
State 0.98 1.00 1.00 0.96
City 0.94 0.94 1.00 0.91
Neighborhood/Community 0.73 0.65 0.74 0.78
Place 0.90 0.92 0.89 0.89
Floor 0.90 0.82 0.94 0.93
Recall
Recall word 1 0.85 0.86 0.91 0.81
Recall word 2 0.38 0.39 0.54 0.3 a,1
Recall word 3 0.26 0.27 0.2 b 0.28
Attention and calculation
Calculating 1 0.53 0.61 0.6 0.45
Calculating 2 0.26 0.27 0.37 0.2 a
Calculating 3 0.33 0.39 0.43 0.23 a,2
Calculating 4 0.34 0.45 0.49 0.2 a,3
Calculating 5 0.32 0.35 0.43 0.24 a
Naming
Naming1 0.99 0.98 1.00 0.99
Naming2 1.00 1.00 1.00 1.00
Repetition
Repetition 0.28 0.25 c 0.34 0.27
Comprehension
Comprehension1 0.98 0.98 0.97 0.99
Comprehension2 0.97 0.98 0.97 0.96
Comprehension3 0.97 1.00 0.97 0.95
Reading
Reading 0.99 1.00 1.00 0.97
Writing
Writing 0.92 0.94 1.00 0.86
Drawing
Drawing 0.65 0.67 0.74 0.59
a
The most difficult items for the sample were the second (especially for schizoaffective disorder (SAD) patients)
and third b (especially for major depressive disorder (MDD)) words that had to be remembered. Activities
number two a , three a , four a , and five a of the attention and calculation domain (especially for SAD patients); and
repetition c (especially for bipolar disorder (BD) patients). 1 χ2 = 6.112; p = 0.047 (two-sided, 0.05 significance);
2 χ2 = 5.822; p = 0.027 (two-sided, 0.05 significance); 3 χ2 = 12.252; p = 0.001 (two-sided, 0.05 significance).
4. Discussion
The results revealed several key points. Generally, in a clinical or research setting, the
MMSE-2 is used to compare a given patient’s score against the norms as they are found in
the general population. Ideally, patient scores should be compared with the norms that
apply to the population suffering from the same condition to assess how different such
scores are from the scores of the members of that population [18]. In other words, for
psychiatric patients, the examiner or clinician should interpret patients’ scores based onInt. J. Environ. Res. Public Health 2021, 18, 1694 11 of 13
the cognitive performance of their peers. Unfortunately, in Puerto Rico, we do not have an
established norm for psychiatric patients.
In my study, the sample exhibited differences in the levels of deterioration experi-
enced by patients with BD, MDD, and SAD. Using the MMSE-2 to screen for cognitive
impairment, with a score of 23 or less, we found that 51% of the participating SAD patients
exhibited cognitive deterioration, as did 31% of the BD patients and 18% of the MDD
patients. According to the results and the post hoc test, a significant result showed that
participants with SAD had more cognitive impairment than did those with MDD. The
participants with MDD had better scores. These results are important since they help
identify the different levels of deterioration sustained by the members of each psychiatric
group. This identification of cognitive impairment is essential for the design of psychoso-
cial interventions in order to improve the functioning of these patients. However, it is
recommended that this study be repeated, ensuring that the diagnosis categories have
similar numbers of patients as well as a control group.
In this psychiatric sample, the MMSE-2 obtained a Cronbach’s alpha coefficient of
0.81, which is a very good reliability score.
Education was the principal variable with a significant effect on the MMSE-2 score,
as we can see through the analysis of covariances. This finding is not different from those
of other studies [19]. The result that differs from those of other studies is that, generally,
age and other sociodemographic variables influence the MMSE-2 more or less the same as
education does [19,20]. However, there are several studies that concur with this one [10,11].
In this case, the results agreed with others that also showed education to be a principal
significant variable [21].
The 25th percentile provides important information regarding the cutoff points (with
reference to the education variable). Table 2 displays the different cutoff points for the
participants (based on years of education), using as a reference the study of Crum et al. [10].
The cutoff point of 16 was for participants with 0 to 4 years of education. For 5 to 8 years,
the cutoff was 17; participants with 9 to 12 years of education had a cutoff point of 20, and
those with 13± years, the cutoff was 23. These cutoff points do not concur with those of
the Crum study, where the study used a different sample.
For a psychiatric patient, having a high level of education appears to improve the
MMSE-2 scores. Contrary to expectations, this association did not hold true with SAD
patients. The members of this group had lower scores than the BD and MDD patients
did. Compared to the other two groups, the SAD patients were found to have worse
cognitive functioning when we used a cutoff of 23, independently of education. That is
significant information.
The present study revealed that there is a need for different cutoff points and that
the educational level must be considered when cognitive deficits are being evaluated.
However, it is also important to focus on how MMSE-2 scores are affected by different
psychiatric diagnoses.
We had to consider the different characteristics of the patients in three diagnostic
groups as those differences relate to unhealthy lifestyle habits (smoking, no exercise, and
high levels of stress). The majority of the participants (50% SAD and 31.4% BD) came from
substitute homes, while 34.3% of the MDD participants had their own homes. Several
medical comorbidities also were part of the clinical features of these participants as were
weight-related health problems (see Table 1).
Finally, the items on the MMSE-2 that represented the greatest difficulty for the
participants were those in the recall domain, specifically, the second and third words which
were needed to be remembered. The items forming the attention and calculation domain
(the second, third, fourth, and fifth calculation activities) and those of the repetition domain
were also difficult for BD, MDD, and SAD patients to get through. For SAD patients, the
most difficult items were recalling the second word given by the interviewer, and those
having to do with attention and calculation. For BD patients, the most difficult item was
repetition. The most difficult item for MDD patients was recalling word number three.Int. J. Environ. Res. Public Health 2021, 18, 1694 12 of 13
Limitations
Several limitations of the study are worth noting. Only one screening test was used. It
is recommended that an additional test—to determine the accuracy of the MMSE-2 scores
of a specific patient—be deployed. The size of the diagnostic groups was not the same,
as was the size of the group having the lowest number of years of education (0 through
8 years). A future study, one having larger sample sizes for each disorder and for the lower
years of education, as well as a control group, should be undertaken (the inclusion of a
healthy control group is essential). My study’s sample did not include any patients with
schizophrenia. For that reason, I was unable to compare cognitive profiles or determine (as
previous studies have done) whether there is any overlap in those profiles [5]. To determine
whether having a high level of education affects the prevalence of either false positives
or false negatives (by increasing them), studies that include sample members who have
relatively low education levels need to be carried out [22]. Certain age and education levels
had low numbers, and this may mean that, for these relationships, the findings are less
reliable. In addition to the variables considered in this study, the cognitive functioning of
the participants may have been influenced by other factors, such as the level of severity or
degree of the psychiatric disturbance, social and cultural contexts, previous abilities, and
the environment in which the assessment was carried out, as well as by the beginning of
the symptomatology (which is, the number years with the diagnosis). This study is not
representative of the entire population of Puerto Rico. All the participants had a diagnosis
of BD, MDD, or SAD, though the psychiatric diagnosis could not be formally corroborated
with a clinical interview.
Despite these limitations, the study draws attention to the different degrees of cogni-
tive functioning in psychiatric patients, especially regarding these patients’ differing levels
of education and the cutoff points used.
5. Conclusions
In conclusion, the current findings confirm that levels of cognitive deterioration in
patients diagnosed with BD, MDD, or SAD were different. According to the MMSE-2
scores, patients with SAD had more cognitive impairment, independent of their having or
not having high levels of education, than did those diagnosed with BD or MDD (or both).
The 25th percentile can also be used when considering the different levels of education. The
previous must be considered when the MMSE-2 is used with psychiatric patients, especially
those who suffer from BD, MDD, or SAD. It is important to note that the variables of the
education level and psychiatric diagnosis require distinct cutoff points. We were able to
explore (by a diagnostic category) the items that the participants found difficult.
Funding: The research reported in this publication was supported by the National Institute on Minor-
ity Health and Health Disparities of the National Institutes of Health, award numbers R25MD007607
and U54MD007600. The content is solely the responsibility of the author and does not necessarily
represent the official views of the National Institutes of Health.
Institutional Review Board Statement: The study was conducted according to the guidelines of
the Declaration of Helsinki and approved by the institutional review board of the University of
Puerto Rico, Medical Sciences Campus (protocol code B1250119, with the date of approval being
December 2019).
Informed Consent Statement: Informed consent was obtained from all the subjects involved in the
original study.
Data Availability Statement: Not applicable.
Acknowledgments: The author received support from Phase II of the Postdoctoral Master of Science
in Clinical and Translational Research Program and from the Center for Collaborative Research in
Health Disparities, both of which are located at the University of Puerto Rico, Medical Sciences
Campus. The author also wishes to thank Jesús M. Ortega Guzmán, MPH, who is a biostatisticianInt. J. Environ. Res. Public Health 2021, 18, 1694 13 of 13
at the University of Puerto Rico, Medical Sciences Campus. The author consulted with him on the
general linear model (GLM).
Conflicts of Interest: The author declares no conflict of interest.
References
1. Lynham, A.J.; Hubbard, L.; Tansey, K.E.; Hamshere, M.L.; Legge, S.E.; Owen, M.J.; Jones, I.R.; Walters, J.T.R. Examining cognition
across the bipolar/schizophrenia diagnostic spectrum. J. Psychiatry Neurosci. 2018, 43, 245–253. [CrossRef] [PubMed]
2. Amann, B.L.; Gomar, J.J.; Ortiz-Gil, J.; McKenna, P.; Sans-Sansa, B.; Sarró, S.; Moro, N.; Madre, M.; Landin-Romero, R.; Vieta,
E.; et al. Executive dysfunction and memory impairment in schizoaffective disorder: A comparison with bipolar disorder,
schizophrenia and healthy controls. Psychol. Med. 2012, 42, 2127–2135. [CrossRef] [PubMed]
3. Carvalho, A.F.; Bortolato, B.; Miskowiak, K.W.; Vieta, E.; Köhler, C.A. Cognitive dysfunction in bipolar disorder and schizophrenia:
A systematic review of meta-analyses. Neuropsychiatr. Dis. Treat. 2015, 11, 3111–3125. [CrossRef] [PubMed]
4. Abrams, D.J.; Rojas, D.C.; Arciniegas, D.B. Is schizoaffective disorder a distinct categorical diagnosis? A critical review of the
literature. Neuropsychiatr. Dis. Treat. 2008, 4, 1089–1109. [CrossRef] [PubMed]
5. Sole, B.; Jimenez, E.; Torrent, C.; Reinares, M.; Bonnin, C.D.M.; Torres, I.; Varo, C.; Grande, I.; Valls, E.; Salagre, E.; et al. Cognitive
Impairment in Bipolar Disorder: Treatment and Prevention Strategies. Int. J. Neuropsychopharmacol. 2017, 20, 670–680. [CrossRef]
[PubMed]
6. Gildengers, A.G.; Butters, M.A.; Chisholm, D.; Anderson, S.J.; Begley, A.; Holm, M.; Rogers, J.C.; Iii, C.F.R.; Mulsant, B.H.
Cognition in older adults with bipolar disorder versus major depressive disorder. Bipolar Disord. 2012, 14, 198–205. [CrossRef]
[PubMed]
7. Glisky, E.L. Changes in Cognitive Function in Human Aging. In Brain Aging: Models, Methods, and Mechanism; Riddle, D.R., Ed.;
CRC Press/Taylor & Francis: Boca Raton, FL, USA, 2007; pp. 4–15. Available online: https://www.ncbi.nlm.nih.gov/books/
NBK3885/ (accessed on 17 December 2020).
8. U.S. Department of Health and Human Services, Centers for Disease Control and Prevention. Cognitive Impairment: A Call for
Action, Now! Available online: https://www.cdc.gov/aging/pdf/cognitive_impairment/cogimp_poilicy_final.pdf (accessed on
20 October 2019).
9. Ong, H.L.; Subramaniam, M.; Abdin, E.; Wang, P.; Vaingankar, J.A.; Lee, S.P.; Shafie, S.; Seow, E.; Chong, S.A. Performance of
Mini-Mental State Examination (MMSE) in long-stay patients with schizophrenia or schizoaffective disorders in a psychiatric
institute. Psychiatry Res. 2016, 241, 256–262. [CrossRef] [PubMed]
10. Crum, R.M.; Anthony, J.C.; Bassett, S.S.; Folstein, M.F. Population-Based Norms for the Mini-Mental State Examination by Age
and Educational Level. JAMA 1993, 269, 2386–2391. [CrossRef] [PubMed]
11. Kochhann, R.; Varela, J.S.; Lisboa, C.S.D.M.; Chaves, M.L.F. The Mini Mental State Examination: Review of cutoff points adjusted
for schooling in a large Southern Brazilian sample. Dement. Neuropsychol. 2010, 4, 35–41. [CrossRef] [PubMed]
12. Bird, H.R.; Canino, G.; Stipec, M.R.; Shrout, P. Use of the Mini-mental State Examination in a Probability Sample of a Hispanic
Population. J. Nerv. Ment. Dis. 1987, 175, 731–737. [CrossRef] [PubMed]
13. Burton, L.; Tyson, S.F. Screening for cognitive impairment after stroke: A systematic review of psychometric properties and
clinical utility. J. Rehabil. Med. 2015, 47, 193–203. [CrossRef] [PubMed]
14. Fuentes-Smith, L.E. Methodology for the selection of optimal cutoff point to dichotomize continuous covariates. Rev. Cubana.
Gen. 2013, 7, 36–42.
15. Ralat, S.I.; Rodriguez-Gomez, J.; Arroyo, Y. The RAS-24: Development and Validation of an Adherence-to-Medication Scale for
Severe Mental Illness Patients. Department of Psychiatry, University of Puerto Rico; [Manuscript submitted for publication].
16. DeVellis, R.F. Scale Development: Theory and Applications, 3rd ed.; Sage Publications: California, CA, USA, 2012.
17. Hahn, L.; Kessler, J. A new scoring system for increasing the sensitivity of the MMSE. Z. Gerontol. Geriatr. 2019, 53, 156–162.
[CrossRef] [PubMed]
18. Gómez-Benito, J.; The Spanish Working Group in Cognitive Function; Guilera, G.; Pino, O.; Rojo, E.; Tabarés-Seisdedos, R.; Safont,
G.; Martínez-Arán, A.; Franco-Martín, M.; Cuesta, M.; et al. The screen for cognitive impairment in psychiatry: Diagnostic-specific
standardization in psychiatric ill patients. BMC Psychiatry 2013, 13, 127. [CrossRef] [PubMed]
19. De Brito-Marques, P.R.; Cabral-Filho, J.E. The role of education in mini-mental state examination: A study in Northeast Brazil.
Arq. Neuro-Psiquiatr. 2004, 62, 206–211. [CrossRef] [PubMed]
20. Gugssa, S.A.; Davey, G.; Ejigu, A.A.; Metaferia, G.Z.; Medhin, G.; Kelkile, T.S. Population norms for the mini-mental state
examination in Ethiopia. Ethiop. Med. J. 2011, 49, 239–247. [PubMed]
21. Ostrosky-Solís, F.; López-Arango, G.; Ardila, A. Sensitivity and Specificity of the Mini-Mental State Examination in a Spanish-
Speaking Population. Appl. Neuropsychol. 2000, 7, 25–31. [CrossRef] [PubMed]
22. Butman, J.; Arizaga, R.L.; Harris, P.; Drake, M.; Baumann, D.; de Pascale, A.; Allegri, R.F.; Mangone, C.A.; Ollari, J.A. El
“Mini –mental state examination” en español. Normas para Buenos Aires. Rev. Neurol. Arg. 2001, 26, 11–15.You can also read