T2- weighted shorttau-inversion- recovery imaging reflects disease activity of cardiac sarcoidosis
←
→
Page content transcription
If your browser does not render page correctly, please read the page content below
Open access Heart failure and cardiomyopathies
Open Heart: first published as 10.1136/openhrt-2021-001728 on 28 September 2021. Downloaded from http://openheart.bmj.com/ on October 24, 2021 by guest. Protected by copyright.
T2-weighted short-tau-inversion-
recovery imaging reflects disease
activity of cardiac sarcoidosis
Reina Tonegawa-Kuji ,1,2 Noriko Oyama-Manabe ,3 Ryosuke Aoki,4
Shinya Nagayoshi,5 Christian Michael Hong Pawhay,5,6 Kengo Kusano ,1,2
Takatomo Nakajima5
►► Additional supplemental ABSTRACT
material is published online only. Key questions
Objective We investigated the diagnostic performance
To view, please visit the journal
of semi-quantitative hyperintensity on T2-weighted short-
online (http://dx.d oi.org/10. What is already known about this subject?
tau-inversion-recovery black-blood (T2W-STIR-BB) images
1136/o penhrt-2021-0 01728). ►► Hyperintensity on T2-weighted short-tau-inversion-
in identifying active cardiac sarcoidosis (CS) in patients,
recovery black-blood images (T2W- STIR-
BB) of
To cite: Tonegawa-Kuji R, and compared it with that of 18F-fluoro-2-deoxyglucose
cardiac magnetic resonance reflects oedema and
Oyama-Manabe N, Aoki R, et al. positron emission tomography (FDG-PET).
might be useful for evaluation of disease activity in
T2-weighted short-tau- Methods This retrospective study included 40 steroid-
cardiac sarcoidosis (CS).
inversion-recovery imaging naive patients (age 63.1±12.9 years, 20 men) diagnosed
reflects disease activity of with CS who underwent both cardiac MRI and FDG-PET What does this study add?
cardiac sarcoidosis. Open Heart imaging. Active CS cases were defined as satisfying at ►► Using the conventional clinical definition of active
2021;8:e001728. doi:10.1136/ least one of the following criteria for conventional indices: CS as the gold standard, the radiographic diagnos-
openhrt-2021-001728
exacerbation of ventricular arrhythmia, newly identified tic value of T2W-STIR-BB was comparable to that
advanced atrioventricular block, greater than 5% decrease of 18F-fluoro-2-deoxyglucose-positron emission to-
Received 20 May 2021 in left ventricular ejection fraction on echocardiography, mography (FDG-PET). Regarding the analysis of high
Accepted 7 September 2021 positive finding on gallium-scintigraphy or elevated signal intensity on T2W-STIR-BB images in identi-
levels of sarcoidosis-related serum biomarkers. T2W- fying active inflammation detected by FDG- PET,
STIR-BB images were semi-quantitatively analysed using semi-quantitative analysis using the myocardium-
a myocardium-to-spleen ratio (MSR). The diagnostic to-spleen ratio significantly improved sensitivity and
performance of T2W-STIR-BB and FDG-PET imaging for accuracy compared with visual analysis.
detecting active CS was investigated.
Results Thirty-three patients satisfied at least one How might this impact on clinical practice?
criterion and were considered as having active CS. Thirty ►► High signal intensity on T2W-STIR-BB images pro-
patients (75%) tested positive with T2W-STIR-BB imaging, vided an additional non-invasive and radiation-free
and 25 patients (63%) tested positive with FDG-PET. The tool for evaluating CS activity.
sensitivity, specificity, accuracy, and positive and negative
predictive values for identifying active CS by semi-
quantitative MSR on T2W-STIR-BB images were 79%, evaluation of active myocardial inflammation
43%, 73%, 87% and 30%, respectively. These results in patients with CS is important in the devel-
were statistically comparable to those of FDG-PET (70%, opment of a treatment strategy.
71%, 70%, 92% and 33%, respectively). Conventional methods to evaluate active
Conclusions When using conventional diagnostic indices CS include observation of new atrioventric-
for active CS as the gold standard, T2W-STIR-BB imaging
ular block5 6 or ventricular arrhythmias,7 8 a
demonstrated comparable diagnostic performance to that
gradual decrease in the left ventricular ejec-
of FDG-PET. The semi-quantitative analysis of high signal
intensity on T2W-STIR-BB images using MSR was useful tion fraction (LVEF) on echocardiography,9 10
for detection of active CS. a positive finding on gallium scintigraphy11 or
© Author(s) (or their presence of specific positive biomarkers,4 12
employer(s)) 2021. Re-use which are known to have low accuracy.
permitted under CC BY-NC. No 18
F-fluoro-2-deoxyglucose positron emis-
commercial re-use. See rights
and permissions. Published INTRODUCTION sion tomography (FDG- PET) preceded
by BMJ. Sarcoidosis is a rare multi-organ system by fasting has been used to identify active
For numbered affiliations see granulomatous disease of uncertain aeti- inflammatory changes in CS.13–15 There have
end of article. ology. Cardiac sarcoidosis (CS) is clinically been several reports showing the association
evident in 2%–7% of patients, but autopsy between abnormal FDG uptake and clinical
Correspondence to
Dr Noriko Oyama-Manabe;
and imaging series report a substantially symptoms6–8 10 or high serum level of ACE.13 14
noriko.norichan@gmail.com higher occurrence of 25%–80%.1–4 Accurate However, even with strict prior carbohydrate
Tonegawa-Kuji R, et al. Open Heart 2021;8:e001728. doi:10.1136/openhrt-2021-001728 1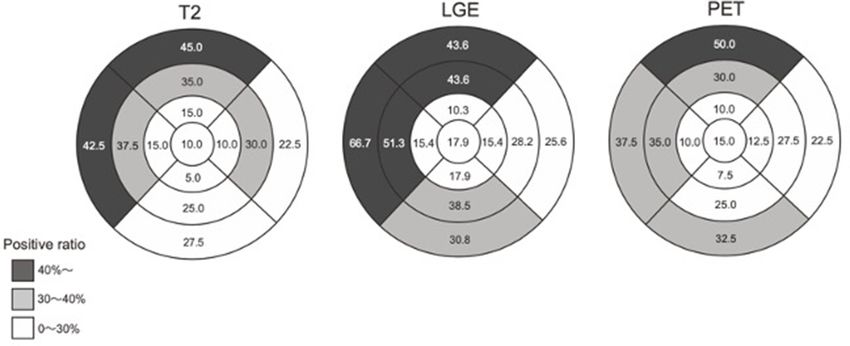
Open Heart
Open Heart: first published as 10.1136/openhrt-2021-001728 on 28 September 2021. Downloaded from http://openheart.bmj.com/ on October 24, 2021 by guest. Protected by copyright.
restriction, physiological FDG accumulation can cause a receive any steroid therapy between CMR and FDG-
false positive. PET. Results of electrocardiography, echocardiography,
Compared with FDG-PET, cardiac magnetic resonance gallium-scintigraphy and laboratory data were collected.
(CMR) imaging is more accessible, requires a shorter CS activity was defined as satisfying at least one of the
period of prior fasting, lacks radiation exposure, and is following conventional criteria: (1) exacerbation of
less expensive. Late gadolinium enhancement (LGE) is ventricular arrhythmic burden, including ventricular
the gold standard for the diagnosis of CS, which represents fibrillation, sustained or non-sustained ventricular tach-
both fibrosis/scarring and active infiltrative granulomas. ycardia or newly identified advanced atrioventricular
High signal intensity on T2-weighted short-tau-inversion- block on an ECG within the last 3 months; (2) greater
recovery black- blood images (T2W- STIR-BB) indicates than 5% decrease in LVEF on echocardiography within
still water in the myocardium, which points to oedema the last 6 months among patients who underwent serial
associated with inflammation.16 17 The sensitivity of hyper- echocardiography; (3) abnormal uptake of gallium in the
intensity on T2-weighted images for diagnosing CS (34%) myocardium (higher than blood pool) or (4) elevated
was reported to be not as high as that of FDG-PET, with level of one or more of the following serum biomarkers:
fasting longer than 18 hours (48%–100%, >70% in most ACE, lysozyme or soluble interleukin 2 receptor (sIL-2R).
studies except for 2 out of 13 studies that showed 70% in most studies except for
four out of 42 studies that showedHeart failure and cardiomyopathies
Open Heart: first published as 10.1136/openhrt-2021-001728 on 28 September 2021. Downloaded from http://openheart.bmj.com/ on October 24, 2021 by guest. Protected by copyright.
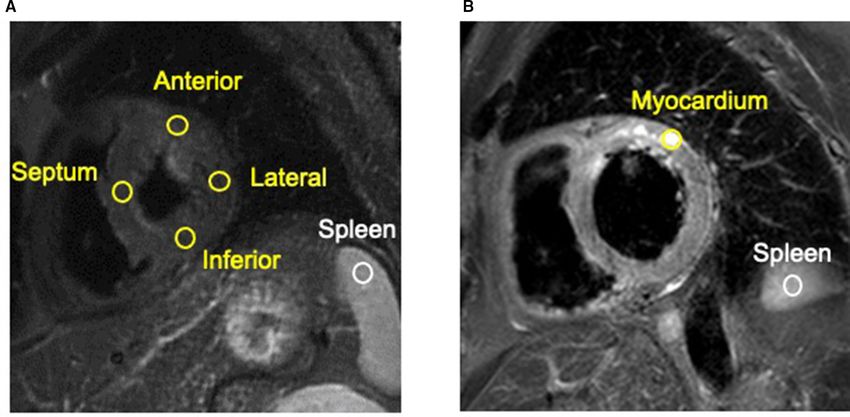
The average number of obtained slices per patient was in the myocardium, an ROI was placed in the area of
8.8±1.3 for T2W-STIR-BB images. Except for one patient hyperintensity (figure 1B). The MSR was defined as
on dialysis who could not undergo imaging using gado- the signal intensity of the myocardium divided by that
linium, contrast-enhanced images were acquired 15 min of the spleen. Artefacts from slow flow were carefully
after intravenous administration of 0.15 mmol/kg gado- avoided when the ROIs were set. Based on our prelimi-
linium diethylenetriaminepentaacetic acid in the same nary investigation to set a cut-off value of the MSR, which
view used for T2-weighted images. is detailed in online supplemental material, the cut-off
value of the MSR was set at 0.58 according to two SD
Gallium scintigraphy
above the mean MSR of control subjects.22 If there was at
Patients received 148 MBq of gallium- 67 citrate 48
hours prior to the acquisition of single-photon emission least one segment with an MSR over 0.58, the patient was
computed tomography and CT images of the whole body considered as positive.
using a dual-detector gamma camera with a mounted
CT scanner (Infinia Hawkeye f4, GE Medical Systems, Statistical analysis
Milwaukee, Wisconsin, USA). Images were visually Continuous variables were expressed as the mean±SD if
analysed by two experienced nuclear cardiologists while they were normally distributed and as the median (25–75
blinded to the clinical characteristics of each subject. percentile) if they were not normally distributed. Cate-
Gallium uptake was defined as positive if it was greater gorical data were expressed as counts and percentages.
than that of the left ventricular blood pool. An unpaired Student’s t-test was performed to compare
continuous variables that were normally distributed and
Analysis of T2-STIR-BB images of CMR Mann-Whitney U test was used to compare those that
Two cardiologists specialised in cardiac imaging who
did not follow a normal distribution. χ2 test and Fish-
were unaware of the clinical history or PET findings
er’s exact probability test were used to compare the
visually assessed T2W-STIR-BB images in consensus to
proportions of gender, known extracardiac sarcoidosis,
determine if abnormal high signal intensity areas were
baseline medications, and findings in electrocardiog-
present in the myocardium. An experienced radiolog-
raphy, echocardiography, CMR imaging and FDG-PET
ical technologist who works primarily on CMR imaging
measured the MSR. A circular or oval region of interest between those with and without abnormal findings from
(ROI) of 40 mm2 was placed in the myocardium and conventional diagnostic methods. Sensitivity, specificity,
spleen on the same slice and the average signal intensity accuracy, and positive and negative predictive values of
was measured. All T2-STIR-BB images were of sufficient each diagnostic method were calculated on a patient-
image quality to be evaluated. When there was no visibly patient basis. McNemar’s test was performed for
to-
abnormal high intensity, the ROI was placed at the ante- comparison of sensitivities, specificities and accuracies
rior, septal, posterior and lateral walls at the basal, mid of different diagnostic methods in a paired analysis. For
and apical levels with short axis images (figure 1A). We all analyses, a p value ofOpen Heart
Open Heart: first published as 10.1136/openhrt-2021-001728 on 28 September 2021. Downloaded from http://openheart.bmj.com/ on October 24, 2021 by guest. Protected by copyright.
Figure 2 Flow diagram illustrating inclusion and exclusion of patients with suspected CS who underwent FDG-PET and
CMR. CAD, coronary artery disease; CMR, cardiac magnetic resonance; CS, cardiac sarcoidosis; FDG-PET, 18F-fluoro-2-
deoxyglucose positron emission tomography.
RESULTS findings. Of the 40 patients included in the study, 14
Patient characteristics of CS cohort patients were followed longer than 6 months with serial
Figure 2 presents a flow diagram of this study. A total of echocardiography tests before administrating immuno-
76 patients diagnosed with CS who underwent both CMR suppressant therapy. Of these 14 patients, a more than 5%
imaging and FDG-PET were initially identified. Of these, decrease in LVEF was observed in seven patients (50%),
37 patients were excluded because: CMR and FDG-PET and these patients were classified into the conventional
were performed more than 3 months apart (13 patients); active group. Of the 34 patients who underwent gallium
CMR was not acquired using the same 1.5 T imaging unit scintigraphy, seven patients (21%) had abnormal myocar-
or with the same protocol as those we sought to inves- dial gallium uptake. In addition, laboratory data were
tigate (13 patients); low quality of T2-STIR-BB images available for all patients, and 20 patients (50%) showed
(two patients); splenic involvement of sarcoidosis was an elevated serum level of ACE, lysozyme or sIL-2R. Of
diagnosed from splenic nodules with CT and FDG accu- the 40 patients included in the study, 33 (83%) showed
mulation (one patient); a different disease was diagnosed at least one positive finding with conventional diagnostic
(two patients, one with idiopathic cardiomyopathy and methods that reflected CS activity (conventional active
one with significant coronary artery disease) or medical group), and the remaining seven patients (18%) did
history included steroid use (five patients). Thus, 40 not (conventional inactive group). No gender or age
patients (63.1±12.9 years old, 20 males) were enrolled in differences were found between the conventional active
the study. Baseline patient characteristics are shown in and inactive group. Regarding echocardiography, LVEF
table 1. was significantly lower in the conventional active group
A total of 28 patients (70%) had extracardiac sarcoid- than in the inactive group (47.9%±16.0% vs 61.4±9.5%,
osis. Extracardiac biopsy was performed in 17 of the 40 p=0.039).
patients (43%), and specimens of five of these patients
demonstrated pathological findings compatible with FDG-PET and CMR results
sarcoidosis. Three patients had MR compatible pace- The results of FDG-PET and CMR imaging are shown in
makers implanted by the time of CMR imaging. There table 2.
was no patient with an implantable cardioverter defibril- In all cases, MSR was successfully evaluated. T2W-
lator at baseline. STIR-BB images were positive for 30 (75%) patients when
using quantitative analysis using MSR; however, only 25
Results of conventional methods (63%) were positive when using visual analysis. LGE
Results of electrocardiography, echocardiography, compatible with CS was observed in all cases except one
gallium scintigraphy and laboratory data are summa- with renal failure, which precluded the use of contrast.
rised in table 1. Advanced atrioventricular block and Regarding FDG- PET images, 25 of 40 patients (63%)
ventricular tachycardia were newly observed in 23 of the exhibited positive myocardial uptake of FDG. Figure 3
40 patients (58%), and these patients were classified into shows the distribution of segments with abnormal
the conventional active group. There was no significant high signal intensity in T2W-STIR-BB images, LGE and
difference in the number of patients with other ECG FDG uptake in the patients with CS. More than 30% of
4 Tonegawa-Kuji R, et al. Open Heart 2021;8:e001728. doi:10.1136/openhrt-2021-001728Heart failure and cardiomyopathies
Open Heart: first published as 10.1136/openhrt-2021-001728 on 28 September 2021. Downloaded from http://openheart.bmj.com/ on October 24, 2021 by guest. Protected by copyright.
Table 1 Baseline characteristics of 40 patients included in the analysis
Conventional active Conventional inactive P value
Characteristics (n=33) (n=7)
Age (years), mean±SD 64.0±12.0 58.4±16.9 0.30
Male, n (%) 15 (46) 5 (71) 0.20
CS diagnosed by JCS2016 guideline
Histological diagnosis 5 (15) 0 (0) 0.36
Clinical diagnosis 28 (85) 7 (100) 0.27
Extracardiac sarcoidosis
Lung, n (%) 23 (70) 4 (57) 0.41
Eye, n (%) 2 (6) 2 (29) 0.13
Skin, n (%) 1 (3) 0 (0) 0.83
Grandula submandibularis, n (%) 1 (3) 0 (0) 0.83
ECG findings
Advanced AVB, n (%) 4 (12) 0 (0)
Vf, n (%) 0 (0) 0 (0)
Sus-VT, n (%) 2 (6) 0 (0)
Non-sus VT, n (%) 20 (61) 0 (0)
Multifocal frequent PVCs, n (%) 17 (52) 3 (43) 0.50
CRBBB, n (%) 13 (39) 1 (14) 0.21
CLBBB, n (%) 1 (3) 0 (0) 0.83
Pathological Q wave, n (%) 9 (27) 1 (14) 0.43
Abnormal axis deviation 3 (9) 1 (14) 0.55
Any one of Sus-VT, advanced AVB, Vf, non-sus VT observed, n (%) 23 (70) 0 (0)
Echocardiography findings
Basal thinning of the ventricular septum, n (%) 13 (40) 0 (0) 0.48
Other morphological abnormalities of the ventricular walls, n (%) 18 (55) 1 (14) 0.06
LVEF, mean±SD (%) 47.9±16.0 61.4±9.5 0.04
LVEFOpen Heart
Open Heart: first published as 10.1136/openhrt-2021-001728 on 28 September 2021. Downloaded from http://openheart.bmj.com/ on October 24, 2021 by guest. Protected by copyright.
Table 1 Continued
Conventional active Conventional inactive P value
Characteristics (n=33) (n=7)
High-sensitivity troponin (ng/mL), median (25%–75%) 0.006 (0.004–0.026) 0.024 (0.019–0.034) 0.14
Baseline medications
β-blockers, n (%) 15 (45) 1 (14) 0.21
ACE inhibitors, n (%) 8 (24) 2 (29) 1.00
ARB, n (%) 7 (21) 1 (14) 1.00
Diuretics, n (%) 12 (36) 0 (0) 0.08
Antiarrhythmic drugs other than β-blockers, n (%) 3 (9) 0 (0) 1.00
AVB, atrioventricular block; CLBBB, complete left bundle branch block; CRBBB, complete right bundle branch block; CS, cardiac
sarcoidosis; ECG, electrocardiogram; JCS, Japanese Circulation Society; LVEF, left ventricular ejection fraction; non-sus VT, non-sustained
ventricular tachycardia; PVC, premature ventricular contraction; sIL-2R, soluble interleukin 2 receptor; sus-VT, sustained ventricular
tachycardia; Vf, ventricular fibrillation.
patients showed positive high signal intensity on T2W- Diagnostic performance of T2W-STIR-BB for identifying
STIR-BB images and for uptake of FDG in the basal and myocardial inflammation detected by FDG-PET
mid-ventricular level anterior to the septal wall, whereas The diagnostic performance of T2W-STIR-BB imaging
LGE showed more extensive distribution and was positive for identifying myocardial inflammation detected by
in the inferior wall as well as in the region anterior to the FDG-PET is summarised in table 3.
septal wall. Representative CMR and FDG-PET images Sensitivity, specificity, accuracy, and positive and nega-
from patients in the conventional active and inactive tive predictive values were 92%, 53%, 78%, 77% and
group are shown in figure 4. 80%, respectively, for T2W-STIR-BB imaging with semi-
quantitative analysis using MSR, and 60%, 33%, 50%, 60%
and 33%, respectively, for visual analysis of T2W-STIR-BB
Diagnostic performance of T2W-STIR-BB and FDG-PET for
images. The sensitivity and accuracy of T2W- STIR-
BB
identifying active patients with CS
imaging significantly improved when quantitative anal-
When at least one positive finding in conventional
ysis using the MSR method was employed instead of
methods (conventional active group) was used as the
visual analysis.
gold standard of CS activity, sensitivity, specificity, accu-
racy, and positive and negative predictive values were
79%, 43%, 73%, 87% and 30%, respectively (T2W- DISCUSSION
STIR- BB with quantitative analysis using MSR), 64%, In the present study, we evaluated the utility of high signal
43%, 60%, 84% and 20%, respectively (T2W- STIR- BB intensity on T2W-STIR-BB images for identifying active
with visual analysis) and 70%, 71%, 70%, 92% and 33%, patients with CS. This is the first study to directly compare
respectively (FDG-PET). Figure 5 illustrates the results in the diagnostic performance of T2W-STIR-BB and FDG-
a bar graph for side-by-side visual comparison. The sensi- PET imaging. When CS activity was defined with conven-
tivity and accuracy of T2W-STIR-BB imaging were greater tional diagnostic methods, T2W-STIR-BB and FDG-PET
with quantitative analysis using the MSR method than demonstrated comparable diagnostic accuracy for iden-
with visual analysis. The sensitivity and accuracy values of tifying active CS. When using either positive findings of
T2W-STIR-BB imaging were similar to those of FDG-PET. conventional methods or myocardial FDG uptake as the
Table 2 Results of the FDG-PET and CMR studies in patients with CS
Conventional active group Conventional inactive
Characteristics (n=33) group (n=7) P value
FDG-PET positive, n (%) 23 (70) 2 (29) 0.06
T2W-STIR-BB in CMR positive by quantitative analysis using 26 (79) 4 (57) 0.23
MSR, n (%)
T2W-STIR-BB in CMR positive by visual analysis, n (%) 21 (64) 4 (57) 0.53
LGE in CMR compatible with CS positive, n (%) 32 (100) 6 (100) 1.0
CMR, cardiac magnetic resonance; CS, cardiac sarcoidosis; FDG-PET, 18F-fluoro-2-deoxyglucose positron emission tomography; LGE, late
gadolinium enhancement; MSR, myocardium-to-spleen ratio; T2W-STIR-BB, T2-weighted short-tau-inversion-recovery black-blood.
6 Tonegawa-Kuji R, et al. Open Heart 2021;8:e001728. doi:10.1136/openhrt-2021-001728Heart failure and cardiomyopathies
Open Heart: first published as 10.1136/openhrt-2021-001728 on 28 September 2021. Downloaded from http://openheart.bmj.com/ on October 24, 2021 by guest. Protected by copyright.
Figure 3 Distribution of segments with abnormal high signal intensity in T2W-STIR-BB, LGE and FDG uptake in CS patients
with CS. The numbers show the positive ratios in each segment. FDG-PET, 18F-fluoro-2-deoxyglucose positron emission
tomography; LGE, late gadolinium enhancement; T2W-STIR-BB, T2-weighted short-tau-inversion recovery black-blood
images.
reference standard, the diagnostic performance of T2W- from 6% to 34%).5 14 23 The higher rate of positive findings
STIR-BB imaging for identifying active CS was better with on T2W-STIR-BB images in our study could be attributed
quantitative analysis using MSR than with visual
semi- to the use of the semi-quantitative MSR method.
assessment. One reason that hyperintensity on T2W- STIR-BB
To our knowledge, only three studies5 14 23 have images is not generally used for evaluation of active CS is
compared visual hyperintensity findings on T2-weighted the difficulty involved in accurately evaluating the signal
images and FDG-PET images in patients with CS. The intensity. Although T2 mapping has been reported as a
current study included the largest number of patients useful method for quantitative analysis,24 25 it may not
with CS. We observed a much higher rate of positive find- be available on older scanners. Therefore, we employed
ings on T2W-STIR-BB images among our cohort (30 of 40 a simple semi- quantitative analysis; we used the ratio
patients (75%)) than in previous studies, which ranged of signal intensity of the myocardium to that of the
Figure 4 Representative CMR and FDG-PET images of the conventional active and inactive group. Case1: conventional
positive case with all positives on T2W-STIR-BB, LGE and FDG-PET. The patient was in his/her 70s, with a familial history of
sudden cardiac death of his/her child in his/her 40s. At first, his/her cardiac function was normal but then dropped to a left
ventricular ejection fraction of 40% with asynergy and thinning in the anteroseptal wall. T2W-STIR-BB image is transmurally
positive in the basal to mid-level of the anteroseptal wall. Late gadolinium enhancement is present at the same location of high
signal intensity in the T2W-STIR-BB image. Maximum intensity projection FDG-PET image shows strong FDG uptake at the
anteroseptal myocardium and hilar and mediastinal lymph node. Case 2: conventional inactive case with all positives on T2W-
STIR-BB, LGE and FDG-PET in an asymptomatic patient in his/her 40s. T2W-STIR-BB image is positive in the epicardial side
of the basal level of the septal wall in which MSR is 0.67. Spotty late gadolinium enhancement is present at the epicardial side
of the basal level of the right ventricular junction. Maximum intensity projection FDG-PET image shows strong FDG uptake by
the myocardium and hilar and mediastinal lymph nodes. Even though the patient did not have any clinical symptoms to suspect
active CS, positive findings on both T2W-STIR-BB and FDG-PET suggest active myocardial inflammation. CMR, cardiac
magnetic resonance; CS, cardiac sarcoidosis; FDG-PET, 18F-fluoro-2-deoxyglucose positron emission tomography; LGE, late
gadolinium enhancement; MSR, myocardium-to-spleen ratio; T2W-STIR-BB, T2-weighted short-tau-inversion-recovery black-
blood.
Tonegawa-Kuji R, et al. Open Heart 2021;8:e001728. doi:10.1136/openhrt-2021-001728 7Open Heart
Open Heart: first published as 10.1136/openhrt-2021-001728 on 28 September 2021. Downloaded from http://openheart.bmj.com/ on October 24, 2021 by guest. Protected by copyright.
Figure 5 Graphs illustrating diagnostic performance of FDG-PET and T2W-STIR-BB imaging when we used positive findings
in conventional methods as the gold standard of CS activity. Sensitivity, specificity and accuracy of T2W-STIR-BB imaging
were statistically non-inferior to those of FDG-PET among all comparisons. CS, cardiac sarcoidosis; FDG-PET, 18F-fluoro-2-
deoxyglucose positron emission tomography; T2W-STIR-BB, T2-weighted short-tau-inversion-recovery black-blood images.
spleen as the MSR. Most studies of myocarditis analysed analysis. Moreover, with the use of the MSR method,
T2-weighted images using an oedema ratio, defined as T2W-STIR-BB imaging demonstrated comparable diag-
the ratio of myocardial to skeletal muscle signal intensity, nostic performance to that of FDG- PET (sensitivity
with values above a set value considered pathological. 79% vs 70%; accuracy 83% vs 92%) for detecting CS
However, in this study, an oedema ratio was not available in patients in the conventional active group. Calcula-
due to a lack of skeletal muscle in the field of view.26 27 The tion of the MSR is a simple semi-quantitative method
skeletal muscles were excluded in some cases; however, that requires neither specialised software nor contrast.
the MSR was successfully calculated in all cases. While FDG-PET may reveal only inflammatory changes
Positive T2W-STIR-BB and FDG-PET segments showed in the myocardium, CMR imaging could reflect a wider
similar distribution. In addition, the distribution of posi- spectrum of CS activity; for example, cine images offer
tive segments on T2W-STIR-BB, LGE and FDG-PET in information on ventricular wall motion and morpho-
this study was comparable to that of previous reports logical abnormalities, and LGE can indicate fibrosis
(figure 3).5 6 The minor dissimilarity in the distribution or inflammatory changes.29 30 However, it is difficult to
of positive findings on T2W-STIR-BB and FDG-PET can know whether LGE reflects active inflammation or not.
be explained by the different morphological foundations In fact, in our study, LGE compatible with CS occurred
of the two modalities. A high signal on T2W-STIR-BB more frequently than positive findings on T2W-STIR-BB
images is thought to represent interstitial oedema and/ images. With the combined use of T2W-STIR-BB imaging
or increased extracellular spaces resulting from inflam- and LGE, it may be possible to comprehensively distin-
mation,28 whereas FDG accumulates within the cell itself guish inflammation from fibrosis on MRI.
with augmented glucose intake (eg, inflammatory cells). Our study is limited by its retrospective design.
It can be hypothesised that FDG-PET and T2W-STIR-BB Although our patient population was small, we included
images depict pathologically different lesions, which a larger number of patients compared with previous
could result in a dissimilarity between distributions. studies.5 14 23 Only five of our 40 patients’ diagnoses
When using FDG-PET imaging for identifying myocar-
were histologically proven by extracardiac biopsy, and
dial inflammation as the gold standard, the sensitivity,
none of the 40 participants underwent endomyocar-
specificity and accuracy of T2W- STIR-BB imaging
dial biopsy. However, the biopsy procedure offers a very
were better when images were analysed with the semi-
low diagnostic yield (20%) and presents a relatively
quantitative MSR method rather than with visual
high degree of invasiveness and rate of complications.31
In fact, JCS2016 guidelines4 allow for diagnosis of CS
Table 3 Diagnostic performance of high signal intensity without histological proof. Further, we did not include
on T2-weighted short-tau-inversion recovery black-blood a comparison with gallium scintigraphy. The number
compared with 18F-fluoro-2-deoxyglucose positron emission of patients with gallium positive myocardial uptake was
tomography very small (only 7 out of 40 patients), which made it
Quantitative Qualitative difficult to interpret the results of regional agreement
analysis (%) analysis (%) P value between modalities. Finally, the right ventricle was not
Sensitivity 92 60 0.005 investigated due to the difficulty in setting an ROI on the
Specificity 53 33 0.180 myocardium to calculate the MSR.
In conclusion, T2W- STIR- BB imaging with a semi-
Accuracy 78 50 0.041
quantitative MSR method demonstrated comparable
Positive predictive 77 60 –
diagnostic performance to that of FDG-PET. High signal
value
intensity on T2W-STIR-BB images provided an additional
Negative predictive 80 33 –
non-invasive and radiation-free tool for evaluation of CS
value
activity.
8 Tonegawa-Kuji R, et al. Open Heart 2021;8:e001728. doi:10.1136/openhrt-2021-001728Heart failure and cardiomyopathies
Open Heart: first published as 10.1136/openhrt-2021-001728 on 28 September 2021. Downloaded from http://openheart.bmj.com/ on October 24, 2021 by guest. Protected by copyright.
Author affiliations 10 Osborne MT, Hulten EA, Singh A, et al. Reduction in ¹⁸F-
1
Departmenf of Cardiovascular Medicine, National Cerebral and Cardiovascular fluorodeoxyglucose uptake on serial cardiac positron emission
Center, Suita, Japan tomography is associated with improved left ventricular ejection
2 fraction in patients with cardiac sarcoidosis. J Nucl Cardiol
Department of Advanced Cardiovascular Medicine, Kumamoto University Graduate
2014;21:166–74.
School of Medical Sciences, Kumamoto, Japan 11 Momose M, Kadoya M, Koshikawa M, et al. Usefulness of 67GA
3
Department of Radiology, Jichi Medical University Saitama Medical Center, SPECT and integrated low-dose CT scanning (SPECT/CT) in the
Saitama-City, Japan diagnosis of cardiac sarcoidosis. Ann Nucl Med 2007;21:545–51.
4
Department of Radiology, Saitama Cardiovascular and Respiratory Center, 12 Kandolin R, Lehtonen J, Airaksinen J, et al. Cardiac sarcoidosis:
Kumagaya-City, Japan epidemiology, characteristics, and outcome over 25 years in a
5
Department of Cardiology, Saitama Cardiovascular and Respiratory Center, nationwide study. Circulation 2015;131:624–32.
13 Okumura W, Iwasaki T, Toyama T, et al. Usefulness of fasting
Kumagaya-City, Japan 18F-FDG PET in identification of cardiac sarcoidosis. J Nucl Med
6
HB Calleja Heart and Vascular Institute, St.Luke's Medical Center, Quezon City, 2004;45:1989–98.
Philippines 14 Ohira H, Tsujino I, Ishimaru S, et al. Myocardial imaging with 18F-
fluoro-2-deoxyglucose positron emission tomography and magnetic
Twitter Reina Tonegawa-Kuji @@ReinaTonegawa resonance imaging in sarcoidosis. Eur J Nucl Med Mol Imaging
2008;35:933–41.
Contributors RT-K and TN conceived the idea. RT-K and SN collected the clinical 15 Youssef G, Leung E, Mylonas I, et al. The use of 18F-FDG PET
information of the patients and analysed the result statistically. TN and CMHP in the diagnosis of cardiac sarcoidosis: a systematic review
analysed radiological imagings visually. RA measured the myocardium to spleen and metaanalysis including the Ontario experience. J Nucl Med
ratio (MSR) while blinded to the clinical information. RT-K wrote the article with 2012;53:241–8.
support from NO-M and KK. 16 Vignaux O. Cardiac sarcoidosis: spectrum of MRI features. AJR Am
J Roentgenol 2005;184:249–54.
Funding NO-M was supported by grant from the Japan Society for the Promotion of 17 Vignaux O, Dhote R, Duboc D, et al. Detection of myocardial
Science (JSPS) KAKENHI #20K08042 (NOM). involvement in patients with sarcoidosis applying T2-weighted,
contrast-enhanced, and cine magnetic resonance imaging:
Competing interests None declared. initial results of a prospective study. J Comput Assist Tomogr
Patient consent for publication Not applicable. 2002;26:762–7.
18 Oyama-Manabe N, Manabe O, Aikawa T, et al. The role of
Ethics approval The study protocol was approved by the research ethics board of multimodality imaging in cardiac sarcoidosis. Korean Circ J
Hospital A. 2021;51:561–78.
Provenance and peer review Not commissioned; externally peer reviewed. 19 Arnold JR, McCann GP. Cardiovascular magnetic resonance:
applications and practical considerations for the general cardiologist.
Data availability statement Data are available upon reasonable request. Heart 2020;106:174–81.
Open access This is an open access article distributed in accordance with the 20 Paquet N, Albert A, Foidart J, et al. Within-patient variability of (18)
F-FDG: standardized uptake values in normal tissues. J Nucl Med
Creative Commons Attribution Non Commercial (CC BY-NC 4.0) license, which
2004;45:784–8.
permits others to distribute, remix, adapt, build upon this work non-commercially, 21 Ishimaru S, Tsujino I, Takei T, et al. Focal uptake on 18F-fluoro-
and license their derivative works on different terms, provided the original work is 2-deoxyglucose positron emission tomography images indicates
properly cited, appropriate credit is given, any changes made indicated, and the use cardiac involvement of sarcoidosis†. Eur Heart J 2005;26:1538–43.
is non-commercial. See: http://creativecommons.org/licenses/b y-nc/4.0/. 22 Aoki R, Nakajima T, Nakano Y, et al. Utility of the signal intensity
ratio of the spleen and myocardium (SMR) on T2-weighted
ORCID iDs short tau inversion recovery black-blood (T2-STIR BB) images
Reina Tonegawa-Kuji http://orcid.org/0000-0001-7998-939X compared to semi-quantitative analysis in patients with images
Noriko Oyama-Manabe http://o rcid.org/0 000-0002-0 394-6391 with diffuse high T2 signal intensity, such as that with takotsubo
Kengo Kusano http://orcid.org/0 000-0002-5760-9285 cardiomyopathy, cardiac amyloidosis, hypereosinophilic myocarditis,
and apical hypertrophic cardiomyopathy. J Cardiovasc Magn Reson
2016;18:Q40.
23 Soussan M, Brillet P-Y, Nunes H, et al. Clinical value of a high-fat
REFERENCES and low-carbohydrate diet before FDG-PET/CT for evaluation
1 Iannuzzi MC, Rybicki BA, Teirstein AS. Sarcoidosis. N Engl J Med of patients with suspected cardiac sarcoidosis. J Nucl Cardiol
2007;357:2153–65. 2013;20:120–7.
2 Kusano KF, Satomi K. Diagnosis and treatment of cardiac 24 Crouser ED, Ono C, Tran T, et al. Improved detection of cardiac
sarcoidosis. Heart 2016;102:184–90. sarcoidosis using magnetic resonance with myocardial T2 mapping.
3 Youssef G, Beanlands RSB, Birnie DH, et al. Cardiac sarcoidosis: Am J Respir Crit Care Med 2014;189:109–12.
applications of imaging in diagnosis and directing treatment. Heart
25 Puntmann VO, Isted A, Hinojar R, et al. T1 and T2 mapping in
2011;97:2078–87.
recognition of early cardiac involvement in systemic sarcoidosis.
4 Terasaki F, Azuma A, Anzai T, et al. JCS 2016 guideline on diagnosis
Radiology 2017;285:63–72.
and treatment of cardiac sarcoidosis-digest version. Circ J
26 Laissy J-P, Messin B, Varenne O, et al. MRI of acute myocarditis:
2019;83:2329–88.
a comprehensive approach based on various imaging sequences.
5 Orii M, Hirata K, Tanimoto T, et al. Comparison of cardiac MRI
and 18F-FDG positron emission tomography manifestations and Chest 2002;122:1638–48.
regional response to corticosteroid therapy in newly diagnosed 27 Luetkens JA, Homsi R, Sprinkart AM, et al. Incremental value
cardiac sarcoidosis with complet heart block. Heart Rhythm of quantitative CMR including parametric mapping for the
2015;12:2477–85. diagnosis of acute myocarditis. Eur Heart J Cardiovasc Imaging
6 Manabe O, Ohira H, Yoshinaga K, et al. Elevated (18)F- 2016;17:154–61.
fluorodeoxyglucose uptake in the interventricular septum is 28 Schulz-Menger J, Gross M, Messroghli D, et al. Cardiovascular
associated with atrioventricular block in patients with suspected magnetic resonance of acute myocardial infarction at a very early
cardiac involvement sarcoidosis. Eur J Nucl Med Mol Imaging stage. J Am Coll Cardiol 2003;42:513–8.
2013;40:1558–66. 29 Kubota R, Yamada S, Kubota K, et al. Intratumoral distribution
7 Muser D, Santangeli P, Pathak RK, et al. Long-term outcomes of of fluorine-18-fluorodeoxyglucose in vivo: high accumulation
catheter ablation of ventricular tachycardia in patients with cardiac in macrophages and granulation tissues studied by
sarcoidosis. Circ Arrhythm Electrophysiol 2016;9. microautoradiography. J Nucl Med 1992;33:1972–80.
8 Blankstein R, Osborne M, Naya M, et al. Cardiac positron emission 30 Lagan J, Schmitt M, Miller CA. Clinical applications of multi-
tomography enhances prognostic assessments of patients with parametric CMR in myocarditis and systemic inflammatory diseases.
suspected cardiac sarcoidosis. J Am Coll Cardiol 2014;63:329–36. Int J Cardiovasc Imaging 2018;34:35–54.
9 Yazaki Y, Isobe M, Hiroe M, et al. Prognostic determinants of long- 31 Uemura A, Morimoto S, Hiramitsu S, et al. Histologic diagnostic rate
term survival in japanese patients with cardiac sarcoidosis treated of cardiac sarcoidosis: evaluation of endomyocardial biopsies. Am
with prednisone. Am J Cardiol 2001;88:1006–10. Heart J 1999;138:299–302.
Tonegawa-Kuji R, et al. Open Heart 2021;8:e001728. doi:10.1136/openhrt-2021-001728 9You can also read