Truly Global Thai Chemical Company - IVL Results 2Q16 and Mid Year Review 2016 - April 26, 2016 10 August 2016 - Set
←
→
Page content transcription
If your browser does not render page correctly, please read the page content below
IVL Results 2Q16 and Mid Year Review 2016

Truly Global Thai
Chemical Company

April 26, 2016
 10 August 2016

Disclaimer

    This presentation and certain statements included herein contain “forward-                                          All such factors are difficult or impossible to predict and contain uncertainties
    looking statements” about the [financial condition and results of operations]                                       that may materially affect actual results. New factors emerge from time to
    of Indorama Ventures Public Company Limited (the “Company”), which are                                              time, and it is not possible for management to predict all such factors or to
    based on management’s current beliefs, assumptions, expectations and                                                assess the impact of each such factor on the Company. Such forward-looking
    projections about future economic performance and events, considering the                                           statements are also based on numerous assumptions and estimates
    information currently available to the management. Any statements                                                   regarding the Company and its subsidiaries’ present and future business
    preceded by, followed by or that include the words “targets”, “believes”,                                           strategies and the environment in which the Company will operate in the
    “expects”, “aims”, “intends”, “will”, “may”, “anticipates”, “would”, “plans”,                                       future. Any forward-looking statements are not guarantees of future
    “could”, “should, “predicts”, “projects”, “estimates”, “foresees” or similar                                        performance and speak only as at the date of this presentation, and none of
    expressions or the negative thereof, identify or signal the presence of                                             the Company, nor any of its agents, employees or advisors intends or has any
    forward-looking statements as well as predictions, projections and forecasts                                        duty or obligation to supplement, amend, update or revise any such forward-
    of the economy or economic trends of the markets, which are not necessarily                                         looking statements to reflect any change in the Company’s expectations with
    indicative of the future or likely performance of the Company. Such forward-                                        regard thereto or any change in events, conditions or
    looking statements, as well as those included in any other material                                                 circumstances on which any such statements are based or whether in the light
    discussed at the presentation, are not statements of historical facts and                                           of new information, future events or otherwise, except as may be required by
    concern future circumstances and results and involve known and unknown                                              applicable laws and stock exchange regulations. The above and other risks
    risks, uncertainties and other important factors beyond the Company’s                                               and uncertainties are described in the Company’s most recent annual
    control that could cause the actual results, performance or achievements of                                         registration statement (Form 56-1), and additional risks or uncertainties may
    the Company to be materially different from the expectations of future                                              be described from time to time in other reports filed by the Company with the
    results, performance or achievements expressed or implied by such forward-                                          Securities and Exchange Commission of Thailand and the Stock Exchange of
    looking statements.                                                                                                 Thailand. Given the aforementioned and other risks, uncertainties and
    Factors that could contribute to such differences include, but are not limited                                      assumptions, you should not place undue reliance on these forward-looking
    to: the highly competitive nature of the industries in which the Company                                            statements as a prediction of actual results or otherwise.
    operates; a potential recurrence of regional or global overcapacity;
    exposures to macro-economic, political,                                                                             The results of operations for the periods reflected herein are not necessarily
    legal and regulatory risks in markets where the Company operates;                                                   indicative of results that may be achieved for future periods, and the
    dependence on availability, sourcing and cost of raw materials; ability to                                          Company’s actual results may differ materially from those discussed in the
    maintain                                                                                                            forward-looking statements as a result of various factors not foreseen at the
    cost structure and efficient operation of manufacturing facilities; shortages or                                    time of giving this presentation.
    disruptions of supplies to customers; operational risks of production facilities;
    costs and difficulties of integrating future acquired businesses and                                                This presentation must not be treated as advice relating to legal, taxation,
    technologies; dependence of informal relationships with other Indorama                                              financial, accounting or investment matters. By attending this presentation,
    group entities in Indonesia and India; project and other risks carried by                                           you acknowledge that you will be solely responsible for your own assessment
    significant capital investments including future development of new facilities;                                     of the market and the market position of the Company and of the risks and
    exchange rate and interest rate fluctuations; pending environmental lawsuits;                                       merits of any investment in the Shares, and that you will conduct your own
    changes in laws and regulations relating beverage containers and                                                    analysis and be solely responsible for forming your own view of the potential
    packaging; the impact of environmental, health and safety laws and                                                  future performance of the Company’s business.
    regulations in the countries in which the Company operates.

                                                               Our vision: “To be a world-class chemical company making great products for society”
2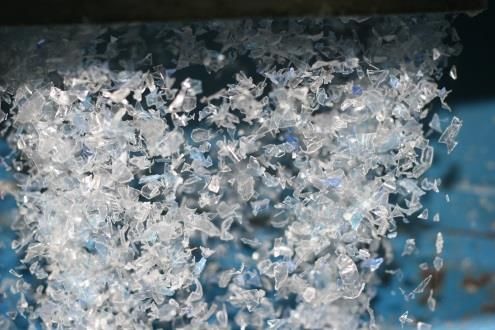
Indorama Ventures’ Essential Elements

                                                          VISION

      To be a world-class chemical company making great products for society

                                                         MISSION

    We commit to be a responsible industry leader leveraging on the excellence of
    our people, processes, and technologies to create value for our stakeholders

                                                         VALUES

        The         Our PEOPLE                     We see
                                                                                                      DIVERSITY is      We are
    CUSTOMER is      make the                   CHANGE as an
                                                                                                       our strength   RESPONSIBLE
    why we exist     difference                  opportunity

                            Our vision: “To be a world-class chemical company making great products for society”
3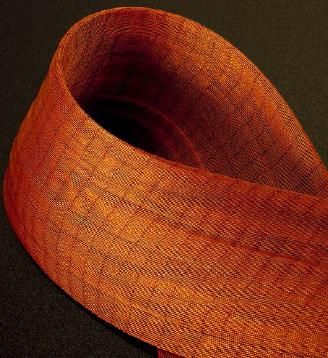
Agenda

         I   2Q16 Results Update

     II       Business Update

               Our vision: “To be a world-class chemical company making great products for society”
4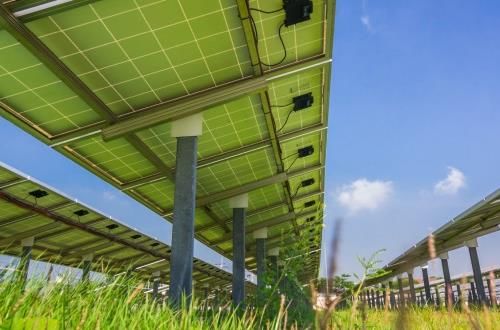
2Q 2016 Headlines

                                                                          Cepsa
                                                                          Spain                                                              Core
    Production +28%                                                               +1.7                                                                 +33%
                YoY
                                                                       0.7MMt and MMt                                                       EBITDA      YoY
      2.3MMt
                                                                       BP Decatur                                                          THB 7.7 B
                                                                         1.0MMt

                           Core                                                                              Core EPS after
                                                                              +75%                                                                +86%
                         Net Profit                                                                              PERP
                                                                               YoY                                                                 YoY
                         THB 2.9 B                                                                            THB 0.56B

Note: Net Operating Debt = Net Debt less project investments that are not generating revenues as on date
                                                    Our vision: “To be a world-class chemical company making great products for society”
5
LTM2Q 2016 Headlines

                                                              Eight
                                                          Completed                                                Core
    Production +16%                                                                           +3.4                          +19%
                YoY
                                                          M&A since                           MMt
                                                                                                                  EBITDA     YoY
      7.7MMt
                                                           Jan 2015                                              THB 24.0 B
                                                            till now

                      Core                                                              Core EPS after
                                                               +61%                                                                        +63%
                    Net Profit                                                              PERP
                                                                YoY                                                                         YoY
                    THB 7.8 B                                                            THB 1.45B

Note: Net Operating Debt = Net Debt less project investments that are not generating revenues as on date, LTM=Last twelve months
                                                    Our vision: “To be a world-class chemical company making great products for society”
6
Improved year on year Performance in Legacy Business
    Maiden Contribution from M&A’s further Added Earnings

                                                                                                                     2Q16           2Q16            2Q15
                                                                                          2Q16
                                                                                                                 IVL excluding       Core            Core
                                                                                        Aromatics
            BP Decatur          THB in Millions                                          Decatur
                                                                                                                   Aromatics     Financials of   Financials of
                                                                                                                    Decatur      Consolidated    Consolidated
    (Aromatics Decatur)                                                                & IVL Spain
                                                                                                                  & IVL Spain      Business        Business
     & Cepsa Spain (IVL
          Spain) added     Production (in '000 tonnes)                                       373                         1,946     2,319           1,815
         1.7mmt of new         Operating rate (%)                                           86%                          87%        87%             90%
               capacity
                                 Net Revenue                                               5,950                     60,780       66,730          61,225
                                 Core EBITDA                                               1,005                         6,679     7,684           5,781
       Double digit core
                               Core EBITDA (%)                                            16.9%                          11.0%     11.5%            9.4%
        EBITDA margin

                                       ROE%                                                  n.a.                        13.6%     15.4%            9.8%
     M&A’s are accretive
              to returns              ROIC%                                               13.1%                          9.3%       9.7%            7.1%
                                     ROCE%                                                 9.7%                          11.4%     11.1%           10.6%

                             Core EBITDA (THB/t)                                           2,693                         3,432     3,313           3,186

                  To Continue Gains from Synergies and Operational Excellence

                                  Our vision: “To be a world-class chemical company making great products for society”
7
IVL Profile 2Q16
Higher Contribution from HVA and Special Position

                              By Segment                                                          By Portfolio                                  By Region

                                   13%                                                                               19%
                                                                                                 32%                                           36%           35%
                                        2.3      43%                                                          2.3                                     2.3
    Production                29%       MMt                                                                   MMt                                     MMt

                                        15%                                                                        50%                                29%

                                       5%                                                             19%
                                                                                                                                               32%
                              31%                39%                                                                                                         43%
                                        THB                                                                    THB          48%                       THB
     EBITDA                             7.7B                                                                   7.7B                                   7.7B
                                                                                                  33%
                                       25%                                                                                                        25%

                                                                                              HVA (High Value Add)
                        PET   Fibers   West Feedstock      Asia PTA                           Special Position (West Necessity)                  NA     EMEA       Asia
                                                                                              Cyclical (East Necessity)

Note: Core Financials 2Q16                              Our vision: “To be a world-class chemical company making great products for society”
8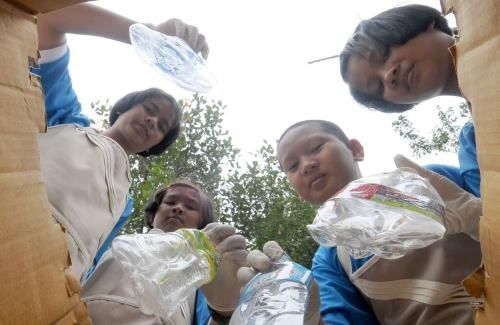
EBITDA – 2Q16 vs 2Q15
Improved Earnings from all Segments
THB B
Baht
0.5 0.2 (0.2) 3,313/T
Asia Holding
West
Baht 0.4 PTA
Feedstock
3,186/T 1.0 Fibers
PET
+33%
Growth
YoY 7.7
5.8
2Q15 2Q16
Core PET $69/T PET $86/T Core
EBITDA/ Fibers $132/T Fibers $159/T EBITDA/
MT W. Feedstock $199/T W. Feedstock $99/T MT
Asia PTA $22/T Asia PTA $34/T
Synergy Benefits to Fully Accrue by 2017
Source: Core financials Our vision: “To be a world-class chemical company making great products for society”
9
Improving Returns on Equity

                                                         IVL Consolidated Returns

                                                   18.0%
      Improving ROCE%,                             16.0%                                                           EOEG shutdown
     ROE% and ROIC% of                                                                                             in USA in 1Q16
                   IVL                             14.0%
                                                   12.0%
          EOEG operated                            10.0%
        below optimum in
                                                    8.0%
       2Q16 post catalyst
             change and                             6.0%
       mechanical issues                            4.0%
      which gradually got
                resolved                            2.0%
                                                    0.0%
                                                                  Yr'12           Yr'13            Yr'14           Yr'15           1Q16       2Q16
            Volume gains in                Core ROCE%             7.1%            6.4%             8.7%            9.3%            7.1%       11.1%
            2H16 over 1H16                 Core ROIC%             3.8%            4.1%             6.5%            7.2%            6.1%       9.7%
                                           Core ROE%              2.3%            3.2%             7.6%            8.8%            6.7%       15.4%

                                                                                          Core ROCE%             Core ROIC%             Core ROE%

Note: ROCE%=Core EBIT annualized/Net Op CE, ROIC= Tax adjusted Core EBIT/Average Net Op CE, ROE%=Core NP after NCI
and PERP/Average Sh. equity, Yearly=Average of quarterly ratios
                                                 Our vision: “To be a world-class chemical company making great products for society”
10
Reconciliation from Core to Reported Net Profit
THB M 2Q16 1Q16 2Q15(R) LTM2Q16 LTM2Q15(R)
Core Net Profit after Tax and NCI 2,890 1,323 1,651 7,827 4,857
Inventory gain (loss) 705 (563) 1,419 (2,776) (2,311)
Total tax on Inventory gain/(loss) (131) 69 (310) 406 493
Net Profit before extraordinary items 3,464 828 2,760 5,457 3,039
Add: Non Operational/Extraordinary
2,485 3,276 2,657 5,379 2,518
income/(expense)
Acquisition cost & pre-operative expense (42) (10) (96) (102) (219)
Net Gain on Bargain Purchase after Impairments 2,608 3,290 2,757 5,577 3,053
Other Extraordinary Income/(Expense) (81) (3) (3) (96) (316)
= Reported Net profit after tax and NCI 5,950 4,104 5,417 10,836 5,557
*Gain on bargain purchase needs to be accounted for on completion of any acquisition as per Thai Accounting Standards and include non-cash accounting impairment of Turkish PET asset for
Baht 514 million and deferred tax asset impairment of PTA units in Thailand for Baht 428 million.
Note: Extraordinary expenses in LTM2Q15 include provision of expenses made to develop Aromatics complex with JV partner in Abu Dhabi, which IVL exited in year 2015 due to strategic
reasons. IVL shall book US$ 12.3 million (Baht 398.1 million) as income in 3Q16 on account of commercial settlement between the parties.
Our vision: “To be a world-class chemical company making great products for society”
11Strong Financial Framework
Balancing Value and Risk Management
Capital Structure Capex Spending
B THB 43
Net Op Debt Total Equity 42
Positive Free Cash
88.3B THB 89.2 B THB
31 Flow in
PERP 29
2016 to 2018
Share- 14 15
holders
and NCI 7 7
Maintenance
2012 2013 2014 2015 1H16 2016 2017 2018 Growth
2Q16
Net Operating Debt Per Ton Net Operating Debt to Equity
Times
400
Adequate
2.0
342 Headroom for
1.5 Future Growth
235 1.3 1.2
200 1.0 1.0
150 1.0 0.8 0.8
Warrants
0.5 Impact
0
2012 2Q16 2018 Net Op
- Debt/Equity
Net Operating Debt ($B) Net Op Debt/Capacity ($/t) 2012 2013 2014 2015 2Q16 2016 2017 2018
Note: Core financials , Net Operating Debt = Net Debt less project capex not generating revenue at this time
Forecast from Capital Day 28 January 2016
Our vision: “To be a world-class chemical company making great products for society”
12Strong Financial Profile
Natural Hedge in line with Global Presence
Credit Rating: A+
Gross Financial Debt: THB 107.0 B Effective Rate of
with stable outlook
Interest: 4.0%1
Cash & Cash by TRIS in Oct’15
Under Management Other
THB 4.6B 4%
Ongoing
ST Loan
Fixed = 48% Interest Coverage
CapexTHB 14.0B EUR
14%
17% Floating = 52% Ratio 7.8 times
LT Loan & Debentures Maturity
Debentures LT Loan
USD LT Loan
48% 51%
Net
2%
OperatingTHB 88.3B
Debt THB
89.3 B
6% 16% 11%
THB Debentures 11% 14%
34% 33% 23%
9%
5%
1% 1% 1%
By Use By Currency By Types 2016-17 2017-18 2018-19 2019-20 2020-21 2021 & after
Liquidity2 of THB 45 Billion (USD1.3 Billion)
Note: Core Financials 2Q16. 1.Interest on short term & long term debts only, 2. Liquidity= cash & cash under management plus unutilized banking lines
Our vision: “To be a world-class chemical company making great products for society”
13Agenda
I 2Q16 Results Update
II Business Update
IVL Business
North America Strategy
Our vision: “To be a world-class chemical company making great products for society”
14The Thai Flag - Touching Billions of Lives Globally
1 in 5 1 in 2 1 in 4
PET bottles Premium baby diapers Airbags are made
are made are made from
from IVL polymers from IVL fibers IVL yarns
#1 #1 #2
Producer of PET Producer of NDC Producer of IPA
Globally Globally Globally
Source: Industry Data 2016, IVL Analysis and IVL capacity including India PET JV
Our vision: “To be a world-class chemical company making great products for society”
15Strong Demand for Polyester Polymer
Driven by Favorable Mega Trends
KMT
80
6.5%
70
CAGR
60
50
40 Polymer Demand
30
20
10
0
2000 2001 2002 2003 2004 2005 2006 2007 2008 2009 2010 2011 2012 2013 2014 2015
>9bn 3bn 60%
People by 2050 Of New Middle Class in Of the World Will
Next 20 Years Live in Cities by 2030
Source: Industry data
Note: Polymer includes PET resins, Polyester Filaments and Fiber & Yarns
Our vision: “To be a world-class chemical company making great products for society”
16Truly Transformed Thai Chemical Company
Protecting Downside and Enhancing Upside Potential
2011 Production: 4.4 MMt *2018F Production: 11.3 MMt
Propylene
Fibers HVA NA (2017)
Ethylene NA
5% (2017)
NDC NA
Fibers
IPA Europe PX NA 3% PET Global
Necessity PTA EMEA 1% 6% 38%
5% 8%
PET Global Fibers HVA
53% 9%
PTA Asia
Fibers
29% Necessity
5%
PTA Asia
MEG NA PTA 11%
PTA NA
3% EMEA
13%
PEO NA 9%
2%
2011 2018F
RM Integration % 31% ~56%
No. of sites 28 65
HVA EBITDA% 12% ~40%
EBITDA Margin% 9.1% ~12%
Capturing More Value Chain
Note: Core financials, *2018F production include PX in NA also just to show our product diversity, though we will report PTA
NA on an integrated PX basis (excluding PX, 2018F production is 10.7MMt)
Our vision: “To be a world-class chemical company making great products for society”
17The Indorama Ventures Unique Value Chain
Integrated, Diversified, Necessities and HVA
*Ethane/Propane Cracker Oil Refinery Shale Gas or Oil
Capacity Reservation
*Ethylene Paraxylene Metaxylene *Propylene Benzene
Butadiene
Ammonia
MEG PTA
Polymer
PEO IPA Polypropylene (PP) ADA/ADN
Polyester Fibers PET PP Fibers Nylon 66 Fibers
HVA PEO HVA Polyester Fibers Polyester PET Film PET Resin HVA PP Fibers HVA Nylon 66 Fibers
Coatings
Fibers
Note: * Gas Cracker of IVL is expected to start by 4Q17, Ratios given are the consumptions for every one ton of output.
IVL Value Chain Value chain supplying raw materials to IVL
Our vision: “To be a world-class chemical company making great products for society”
18Industry Margins Update
Presently at Trough Levels
35,000
Fully Integrated Polyester Polymer Industry Spread Baht/t of Product
Margins in industry are
30,000
below reinvestment
levels
25,000
New investment
announcements in MX Shale Gas
industry are20,000
reducing
Integration15,000
is the key PX/PTA/IPA Ethylene/ MEG
IVL is the most Poly Fiber PET Resin
10,000and
integrated global
competitive producer
Trough
5,000 China overbuild
Downside protection on Steep drop in oil
volumes Weak sentiments
0
2013 2014 2015 1Q16 2Q16
PET Industry Spread PSF Industry Spread over PET Spread
(PTA Industry Spread over MX) X 0.86 (MEG Industry Spread over Ethane/Naphtha) X 0.34
Source: Spreads Industry data
Note: Global Spreads = Simple average of Asia, EMEA & North America, except PSF where only Asia is considered
Our vision: “To be a world-class chemical company making great products for society”
19IVL Necessities
IVL Necessities Value Chain is Integrated & Global
2Q16
Annualized
35,000 7.6
Production
IVL Necessities MMt
1Q16
EBITDA/t30,000
remained
Annualized
steady whereas industry
5.6 5.7
lowered
25,000
4.9
4.7
Driven by IVL Diversity,
Integration
20,000 and
Operational Excellence
EOEG shutdown in
15,000 USA in 1Q16 and
IVL added strategic restarted in 2Q16
capacities
10,000 2,405
IVL gained market share 2,083 2,086 2,086
1,703 EBITDA
5,000 Per MT
Production growth from
4.7mmt in 2013 to
6.2mmt in LTM2Q16
0
2013 2014 2015 1Q16 2Q16
PET Industry Spread PSF Industry Spread over PET Spread
(PTA Industry Spread over MX) X 0.86 (MEG Industry Spread over Ethane/Naphtha) X 0.34
IVL Necessities Core EBITDA/t
Source: Spreads Industry data
Note: Global Spreads = Simple average of Asia, EMEA & North America, except PSF where only Asia is considered
Our vision: “To be a world-class chemical company making great products for society”
20IVL High Value Added
Strategic Steps Taken in Last Three Years
35,000
8,676
Added Automotive, EBITDA
30,000
Chemicals, Hygiene Per MT
Industrial and 7,328 7,212
Packaging businesses
25,000
EOEG shutdown in
5,708 USA in 1Q16 and
Double digit EBITDA restarted in 2Q16 2Q16
margin
20,000 Annualized
4,747 1Q16 1.7
Annualized Production
Higher 15,000
returns on 1.5
1.3 1.4 MMt
capital
1.1
10,000from
Revenue growth
Baht 61B in 2013 to
Baht 85B in LTM2Q16
5,000
Future potential to grow
0HVA
2013 2014 2015 1Q16 2Q16
PET Industry Spread PSF Industry Spread over PET Spread
(PTA Industry Spread over MX) X 0.86 (MEG Industry Spread over Ethane/Naphtha) X 0.34
IVL HVA Core EBITDA/t
Source: Spreads Industry data
Note: Global Spreads = Simple average of Asia, EMEA & North America, except PSF where only Asia is considered
Our vision: “To be a world-class chemical company making great products for society”
21IVL Consolidated
Unique Mix of HVA and Necessities
35,000
8,676
IVL Necessities have
been 30,000
stable and
7,328 7,212
mitigated industry
softness in last few
years on per25,000
MT basis
due to IVL’s actions by 5,708
enhanced presence in EOEG shutdown in
20,000
the West and increased USA in 1Q16 and
4,747
integration restarted in 2Q16
15,000
HVA has performed as 3,306
expected and given 3,117 3,178
10,000 2,579 2,788
superior returns 2,405
2,083 2,086 2,086
1,703
Unique blend of HVA
5,000
and Necessities
increased IVL blended
performance on per0 MT
basis 2013 2014 2015 1Q16 2Q16
PET Industry Spread PSF Industry Spread over PET Spread
(PTA Industry Spread over MX) X 0.86 (MEG Industry Spread over Ethane/Naphtha) X 0.34
IVL Necessities Core EBITDA/t IVL HVA Core EBITDA/t
IVL Conso Core EBITDA/t
Source: Spreads Industry data
Note: Global Spreads = Simple average of Asia, EMEA & North America, except PSF where only Asia is considered
Our vision: “To be a world-class chemical company making great products for society”
22IVL Consolidated
Growing Both HVA and Necessities
IVL Production in MMt Core EBITDA in THB Billion
9 30
8
25
7
6 20
5
15
4
3 10
2
5
1
0 0
2010 2011 2012 2013 2014 2015 LTM2Q15 LTM2Q16 2010 2011 2012 2013 2014 2015 LTM2Q15LTM2Q16
IVL Necessities IVL HVA IVL Necessities IVL HVA
Our vision: “To be a world-class chemical company making great products for society”
23Growing Strategically in Line with our Vision and Strategy
Acquisition from 2011 - Present
PET & Fibers Indonesia
US Mix Feed Cracker
Invista USA & Mexico
IVL Spain (PTA,IPA)
Bangkok Polyester
Aromatics Decatur
PET Poland
PTA Montreal
EOEG USA Serve Global PET China
Special
Customers/MNC’s Micro Pet, India
Positions
Regionally
PET, Turkey
Poly Pet, Indonesia
Driven by People
Recycling Mexico
Performance Fibers
Fiber Visions Packaging Philippines
Innovative, IP, Know
Wellman Packaging Nigeria
how, Technology - HVA
Trivera Packaging UK
PHP Fibers
Our vision: “To be a world-class chemical company making great products for society”
24Agenda
I 2Q16 Results Update
II Business Update
IVL Business
North America Strategy
Our vision: “To be a world-class chemical company making great products for society”
25North America (NAM) Strategy
IVL Positioning
IVL 2017 Yearend Profile (Capacity) Activities from 2012 till 1H16
PET Added 550kt pa EOEG Business
11% 5% PTA
8%
31% Added 1.6mmt pa PTA Business (+720kt pa PX)
13% USA 11% PX
5.2 5.2
Mexico EOEG
MMt MMt Expanded HVA and Recycling
Canada 14%
76% Ethylene &
31% Propylene
Fibers Activities from 2H16 till 2018
Ongoing 400kt pa US Gas Cracker
Fully Integrated
Relentless focus on operational excellence
PX: Ethylene: Propylene:
0.72mmt 0.36mmt 0.04mmt Executive Summary
Most integrated producer with competitive cost
PTA: MEG: PEO: structure
1.62mmt 0.33mmt 0.22mmt
Reliable supply chain for customers
Poly & other Fibers: PET Resin:
0.27mmt 1.60mmt Superior returns on capital
Source: IVL analysis Our vision: “To be a world-class chemical company making great products for society”
26North America (NAM) Strategy
PET Industry
PET Consumption in NAM PET Industry Growth
CSD MMt
13% 4% Domestic
5.5 5.09 5.09
Water producers 4.71 4.93
4.66
11% 29%
Beer
4.08 4.4
4.16 4.24 4.32
1% Imported 4.00 4.08
MMt
Other bottles & 3.3
46% Containers
Packaging and 96% 2.2 87%
83% 84% 85%
Sheets 82%
1.1
PET Trade in 2015 0.0
Mexico Net Exports USA Net Imports Canada Net Imports 2015 2016 2017 2018 2019
Capacity Consumption Operating Rate
22% 17% 21%
30% 31%
195 46% 331 53
Outlook
10% KMT KMT 21% KMT
21% New capacity 0.5mmt expected in 2017 and
22% 32% 27% 0.5mmt in 2018
Colombia Venezuela Trinidad & Tobago Korea South Oman Taiwan China Pakistan Other ADD on PET on certain countries set precedence
for future & impact import volumes
Major Current Capacities in NAM
Mexico advantaged FTA with Latin America and
MMt
1.6 1.7 Europe for potential exports
1.8
1.2 0.9
High-cost, legacy assets expected to be
0.6 restructured/converted to fibers/specialties
0.6
0 Demand growth ~2%pa
IVL Alpek M&G Others
Note: IVL analysis, Industry Data (PCI, Tecnon), US Census, INEGI, Statistic Canada
Our vision: “To be a world-class chemical company making great products for society”
27North America (NAM) Strategy
PTA Industry
PTA Trade in 2015 PTA Industry Growth
MMt
Mexico Net Exports USA Net Import Canada Net Exports 6.57
7.00 6.27
6.00 5.37 5.37 5.62
9% 6% 5.20
19% 5.00 4.79 5.05
4.44 4.51
4.00
416 52 33%
13% 54% NIL 3.00
93%
KMT KMT 89%
92% 92% 90%
2.00
52%
14% 1.00
0.00
2015 2016 2017 2018 2019
Brazil Lithuania Spain Indonesia Belgium Korea South Other Capacity Consumption Operating Rate
Major Current Capacities in NAM Outlook
MMt
New capacity 1.2mmt expected in 2018
3
2.3 Increased demand from new PET and Fibers
2.4
1.8 1.6 Mexico advantaged FTA with Latin America and
1.3 Europe for potential exports
1.2
IVL PTA is integrated to PX in a deficit PX NAM
0.6
0.2 market
0 IVL PTA is fully sold to captive needs and
IVL Alpek BP Others strategic customers
Note: IVL analysis, Industry Data (PCI), US Census, INEGI, Statistic Canada
Our vision: “To be a world-class chemical company making great products for society”
28Key Ongoing Projects
An update
PET JV India PTA Expansion Rotterdam
700 kt pa combined JV capacity – IVL Micropet &
Dhunseri India PET 330 kt pa brownfield expansion
Expect completion in 2H16 Expect completion in 1H17
2nd largest PET producer in growing PET market in Lowered cost and captive consumption
India
50% PTA captive integration in EMEA:
PANIPAT JV in Current: 51%
MPET – 220 KMT IVL
Post Expansion: 75%
RIL & JBF HALDIA
1.15MMt DPL – 480 KMT
Our vision: “To be a world-class chemical company making great products for society”
29Key Ongoing Projects
An Update
Gas Cracker USA Tire Cord Expansion China
400 kt pa under restart with >50% lower capex
17 kt pa brownfield expansion
compared to a new greenfield
Expect completion by 1Q18
Expect completion by 4Q17
Serve growing demand and long term contracts
US Shale benefit and captive consumption
Long lead time items ordered
On Schedule
20%
80%
80%
20%
Max. Ethane Max. Propane
Ethane Propane
Our vision: “To be a world-class chemical company making great products for society”
30IVL Business Plan 2018
“Four Years Plan” Set the Targets over 2014
By Portfolio By Geography
MMt MMt
12.0 12.0
10.7 10.7
6.25 3.8 6.25 3.6
8.0 8.0
Production 1.4
1.0
1.6 3.1
0.6 2.8
4.0 4.0
1.2
4.3 1.6
3.1 4.0
1.9
0.0 0.0
2014 2018 2014 2018
$M $M
1,400 1,400
1,200 1,200
1,000 1,000
800 600 800 600
EBITDA 600 47 600
158
147
400 126 400 146
200 286 200 301
0 0
2014 2018 2014 2018
PET Fibers Olefin Aromatics North America EMEA Asia
Note: Core financials, Olefin=EOEG, Ethylene and Propylene, Aromatics= PTA, PX, IPA and NDC
Source: CMD Jan 2016
Our vision: “To be a world-class chemical company making great products for society”
31IVL Business Plan 2018
Expect to Beat Volumes and Meet EBITDA/t
MMt
12 0.7 10.7
9.3 0.7 10.0
Operating Announced 3.8
8 3.5 Capex &
Production 3.5 Rate Impact
Organic 1.0
0.6
0.5 1.6 Projects 1.6
1.4
4
4.0 4.3 4.3
0
2Q16 Annualized 2018 on 2Q16 Portfolio 2018F
$M
1500
1,034
1000 873 Synergies,
Cost 115
-Mix Announced Operational
224 Volume Impact 237
Capex & Excellence &
EBITDA 90 Impact
Impact
-Op rate 293 Organic Margins
500 219 - Chip to Fibers
- Power plant Projects
340 389
0
2Q16 Annualized 2018 on 2Q16 2018F
Porfolio & Core
EBITDA/t
PET Fibers Olefin Aromatics
Note: Core financials, Olefin=EOEG, Ethylene and Propylene, Aromatics= PTA, PX, IPA and NDC
Source: CMD Jan 2016
Our vision: “To be a world-class chemical company making great products for society”
32IVL Business Plan 2018
Expect to Beat Volumes and Meet EBITDA/t
NA EMEA Asia
MMt
12 0.7 10.7
0.7 10.0
9.3
Operating Announced 3.6
8 3.6
Production 3.3 Rate Impact Capex &
Organic 3.1
2.7 2.8 Projects
4
3.3 3.6 4.0
0
2Q16 Annualized 2018 on 2Q16 Portfolio 2018F
$/t
900
800
700
600 6 4 104
93 67
EBITDA 500 61 Announced Synergies,
400 -Mix Cost
198 198 205 Capex & Operational
205
Per MT 300 Impact Impact
Organic Excellence &
200 - Chip to Fibers -Op rate
159 159 plant 189 Projects 179
Margins
100 - Power
0 86 86 90 90
2Q16 Annualized 2018 on 2Q16 2018F
Porfolio & Core
EBITDA/t
PET Fibers Olefin Aromatics Column3
Note: Core financials, Olefin=EOEG, Ethylene and Propylene, Aromatics= PTA, PX, IPA and NDC
Source: CMD Jan 2016
Our vision: “To be a world-class chemical company making great products for society”
33Aiming on Delivering Consistent, Superior Value
7 Consecutive Years of Core EPS Growth 2012-2018F
With Strong Cash Flow and Attractive ROCE
1.6X Value Double- ~$3B
~4.0X Core
Addition Digit Operating >15%
EPS growth
Growth EBITDA Cash Flow ROCE
2015-18
since 2015 Margin in 2016-18
Driven by HVA
Enlarging from >85% Revenue Enhanced by Creating
Margins and
Integration and from Consumer Value Addition & Shareholder
Volumes and
Feedstock Scale Staples Capex Discipline Value
Integration
Our vision: “To be a world-class chemical company making great products for society”
34We Are Closer Than You Think
Economic Outlook
Tight supply situation
Production of cotton globally has been on a
decline since peak in 2012-13 at 27 Million
tons to 22.3 million tons
Consumption has increased from 23.6
Cotton million tons to 24.29 million tons.
Reduction in ending stocks from 24.48 M
tons peak in 2014-15 to 19.87 in 2016-17
There as been a steady decline of cotton
cropping area and reducing yield per
hectare
6.8 CNY per 1USD Chinese export to be more competitive in
6.7 general
6.6 However as seen in past as RMB
6.5 depreciated even other currencies
RMB 6.4 depreciate against the US$
6.3 More tariff barriers
Weakening There may be capital outflow and reduced
6.2
6.1
FDI
6.0
Lower confidence in economy
Higher Inflation to reduce cost efficiencies
5.9
2015 2016
Source: Various industry sources
Our vision: “To be a world-class chemical company making great products for society”
36New Supply Declining in 2016-18
MMt New Supply Outpace New Demand New Demand Outpace New Supply
6
PET
4
2
0
2013-15 2016-18
MMt
20
15
PTA
10
5
0
2013-15 2016-18
MMt
6
MEG
4
2
0
2013-15 2016-18
Demand Change Supply Change
Source: Industry Data, Forecast data for 2016-2018
Note: New supplies @ 80% operating rate,
Our vision: “To be a world-class chemical company making great products for society”
37HVA Business of IVL
Meeting Mission-Critical Demands, Serving Consumer Needs
Verticals End Use Applications Customers
Safety Airbags
(Trend: Light Weighting Automotive Tires
& Fuel efficiency) Seatbelts
Diapers
Personal Care Hygiene Wipes
(Trend: Better Life Style) Feminine
Hygiene Products
Food & Beer, milk,
Packaging Beverages wine
(Trend: Light weighting Personal & Bio PET
& Performance) Home Care Recycle PET
Polyester Shale gas
Industrial PA 66/PP cracking
(Trend: Efficiency
PEO Filtration
& Performance)
IPA Chemicals
Specialty Recycle
Active Wear
apparel Fibers
(Trend: Fashion & Health
consciousness) Bio-active Sports
textiles Fashion
Note: Examples only for illustration purposes with no commercial intention to market these products or brand here
Our vision: “To be a world-class chemical company making great products for society”
38Strong Governance
Five Star CG Rating Thailand, Committed to Sustainability
Governance Framework
14 Board Members 3 Sub-Committees
7 Independent Directors Audit Committee
7 Executive and Non-Executive Directors Nomination, Compensation and Corporate
Governance Committee
Executive Committee Sustainability and Risk Management
Committee
6 Executive Members
Independent Directors
Rathian Maris William Dr. Siri Kanit
Russell
Chakramon
Srimongkol Samaram E. Heinecke Ganjarerndee Si Kekuewa
Independent Independent Director Independent Director Independent Independent Phasukavanich
Independent Director
Independent Director
Director ***** ***** Director Director ***** *****
***** Independent Director Founder, Chairman ***** ***** Former Vice Ex Industry Minister
President and and Chairman of Audit and CEO, Minor Director of the Bank Executive Vice President for South Thailand
CEO, Krungthai Committee, Siam International PCL and of Thailand Board, President, Bangkok and Southeast Asia,
Card PCL Commercial Bank PCL its subsidiaries Former Assistant Bank PCL Tetra Pak
Governor at Bank of
Thailand
Our vision: “To be a world-class chemical company making great products for society”
39Embedding Sustainability into our Corporate DNA
Renewable Energy:
Solar Farm in
Carbon Footprint Thailand
Recycling Business: Strong Innovation
Circular Economy Platform
Sustainability
Our People Leadership
Our vision: “To be a world-class chemical company making great products for society”
40EBITDA – LTM2Q16 vs LTM2Q15
W. Feedstock- Lower on New Blend and EOEG
THB B
Baht
2.3 (0.7) 0.3 3,135/T
0.2
Baht 1.7 Holding
West Asia
3,060/T Feedstock PTA
Fibers
PET
19% Growth 24.0
20.2
YoY
LTM2Q15 LTM2Q16
Core PET $81/T PET $79/T Core
EBITDA/ Fibers $125/T Fibers $154/T EBITDA/
MT W. Feedstock $186/T W. Feedstock $93/T MT
Asia PTA $22/T Asia PTA $26/T
Synergy Benefits to Fully Accrue by 2017
Source: Core financials Our vision: “To be a world-class chemical company making great products for society”
41PET
Improving Margins and Growing Volumes
Volume (MMt) EBITDA (THB B)
1.08
0.19 0.19 3.63 10.23
3.24 0.57
Increase in 8.58
New Higher
Full Volume Utilization Margins
Volume
Year & Market
12% Mix
Results 19%
Growth Growth
YoY YoY
LTM2Q15 LTM2Q16 LTM2Q15 LTM2Q16
0.31 3.00
0.65
0.04 0.99 Higher
0.88 0.06 2.03 Volume
Quarter New Increase in Margins
Volume Utilization & Market
Results Mix 48%
12%
Growth
Growth YoY
YoY
2Q15 2Q16 2Q15 2Q16
Note: Core financials Our vision: “To be a world-class chemical company making great products for society”
42Fibers
Highest Boost to IVL earnings
Volume (MMt) EBITDA (THB B)
0.11 1.36 0.61 7.43
1.25 - 1.74
Increase in Higher
New 5.09 Volume
Full Volume
Utilization
Higher
Year Margins 46%
Results 9%
Growth Growth
YoY YoY
LTM2Q15 LTM2Q16 LTM2Q15 LTM2Q16
0.35 - (0.002) 0.34 (0.01)
0.43 1.93
New Decrease in
Volume Utilization 1.51 Lower
Quarter Higher Volume
(0.5)% Margins
Results Growth 28%
YoY Growth
YoY
2Q15 2Q16 2Q15 2Q16
Note: Core financials Our vision: “To be a world-class chemical company making great products for society”
43Western Feedstock
Impacted negatively due to lower EOEG & change in Mix
Volume (MMt) EBITDA (THB B)
0.34
5.86 (2.64)
1.55 1.98 5.19
Increase in
Full 0.25 Utilization
0.96
Year New Volume
Margins
Results Volume 62% & Market(11)%
Growth Mix Growth
YoY
YoY
LTM2Q15 LTM2Q16 LTM 2Q15 LTM 2Q16
0.14 1.38 2.38
0.68 1.89 (0.88)
0.25
Increase in
Quarter Utilization
Results 0.29
137% Margins 26% Volume
New & MarketGrowth
Volume Growth
YoY Mix YoY
2Q15 2Q16 2Q15 2Q16
Note: Core financials Our vision: “To be a world-class chemical company making great products for society”
44Asian PTA
Shown some signs of recovery
Volume (MMt) EBITDA (THB B)
0.23 0.02 1.04
1.15 (0.02) 0.83 Volume
1.13
Full Utilization Margins
Year (2)%
& Market
25%
Mix
Results Growth Growth
YoY YoY
LTM2Q15 LTM2Q16 LTM 2Q15 LTM 2Q16
0.01
0.30 0.01 0.31 0.15 0.38
Utilization Volume
Quarter 0.22
Results 4% 75%
Margins
Growth Growth
YoY & Market YoY
Mix
2Q15 2Q16 2Q15 2Q16
Note: Core financials Our vision: “To be a world-class chemical company making great products for society”
45Truly Global Integrated Thai Chemical Company
Strategic Integration Provides Advantage
North America EMEA ASIA Global
Number of Integration Number of Integration Number of Integration Number of Integration
sites Sites Sites Sites
PX 1 67% - - - - 1 26%
PTA 2 100% 2 75% 3 77% 7 86%
MEG 1 54% - - - - 1 16%
Ethylene 1 100% - - - - 1 100%
IPA - - 1 100% - - 1 100%
Total 5 81% 3 40% 3 39% 11 56%
Strategic Integration
Feedstock Security
Reliability of Supply to Customers
Value Chain Capturing
Notes: IVL 2018F capacities and include JV capacities in % of IVL holding
Our vision: “To be a world-class chemical company making great products for society”
46Truly Global Thai Chemical Company
21 Countries, 65 Sites, 11 R&D Centers, 14000 Employees with 57 Nationalities
North America EMEA Asia & ROW
35% of Net Revenue 34% of Net Revenue 31% of Net Revenue
3 Countries 12 Countries 6 Countries
16 Production Sites 21 Production Sites 16 Production Sites
4 R&D Centers 4 R&D Centers 3 R&D Centers
>95% Domestic Sales >95% Domestic Sales >75% Domestic Sales
Note: Net revenue for 2Q16, Domestic sales are revenues within the region
Our vision: “To be a world-class chemical company making great products for society”
47Glossary of commonly used terms
Core = Core financials are calculated as reported financials less Inventory gain/ (loss)-tax adjusted as
applicable and less extraordinary items, if any to reflect operations before any extraordinary items
HVA = High Value Added, which is defined as below:
a) all Fibers & Yarns in Western Countries
b) PEO (purified ethylene oxide) at our EOEG site in NA
c) all downstream packaging businesses (Preforms, Bottles, Closures etc.)
d) all specialty PET resins including recycled products globally
e) all specialty Fibers & Yarns in Asia including recycled products
f) IPA (purified isophthalic acid) with Cepsa, Spain acquisition
g) NDC (naphthalene dicarboxylate) with BP Alabama, USA acquisition
Necessities = Items not classified as HVA but which are essential part of our daily lives
West = North America & EMEA
EMEA = Europe, Middle East & Africa
West Necessities = Necessities in the West (also termed “special position” )
East Necessities = Necessities in Asia (also termed “cyclicals”)
Feedstocks = PTA, MEG and IPA as they are raw materials for PET resin and/or polyester fibers
West Feedstocks = Feedstocks in West region
Our vision: “To be a world-class chemical company making great products for society”
48You can also read